Correspondence should be addressed to Dake Wang;
|
|
|
- Beatrix Perkins
- 5 years ago
- Views:
Transcription
1 Advances in Optics, Article ID , 9 pages Research Article The Spectral Analysis of Dynamic Laser Speckle Patterns Generated by Brownian Particle Suspensions: A Stroboscopic Effect Based Filtering Technique Dake Wang, James Ranger, and Adam Moyer Department of Physics, Furman University, Greenville, SC 29613, USA Correspondence should be addressed to Dake Wang; dake.wang@furman.edu Received 17 April 2014; Revised 17 July 2014; Accepted 18 July 2014; Published 5 August 2014 Academic Editor: Chi-Wai Chow Copyright 2014 Dake Wang et al. This is an open access article distributed under the Creative Commons Attribution License, which permits unrestricted use, distribution, and reproduction in any medium, provided the original work is properly cited. The power spectrum of the time-varying intensity in the dynamic laser speckle patterns is determined by passing the shifted power spectrum through a low-pass filter which is implemented via the signal integration. The light intensity is modulated sinusoidally to induce the stroboscopic effect which shifts the resonant frequency component of the spectrum to 0 Hz. The homodyne dynamic laser speckles generated by the quasi-inelastic scattering of the Brownian motions in colloidal suspensions are investigated. Within the frequency range from 10 Hz to 10 khz used in this work, the bandwidth of the Lorenztian power spectrums is shown to be inversely proportional to the particle size, which is in agreement with the prediction of the dynamic light scattering theory of diffusing particle. The spatial variation observed in the full-field power spectrum maps is caused by the nonuniform distribution of average speckle intensity and varies with the modulation frequency. However, the bandwidths measured at different locations are found to be intensity independent. 1. Introduction The frequency spectrum of the dynamic laser speckle pattern, which fluctuates with time in response to the motions of the scattering centers, can be used to reveal the nature of the scatterer dynamics. A well-known example is the Doppler broadening of the scattered light by the Brownian motion of particles in colloidal suspensions. The frequency shifts generated by quasi-elastic light scatterings, however, are too small to be effectively detected by the traditional optical filtering method that is based on diffraction gratings, interferometers, or molecular filters. Optical mixing techniques, on the other hand,workwellwiththeslowerdynamicprocesswhichhas a characteristic time longer than 10 6 sec [1]. Optical mixing techniques, such as photon correlation spectroscopy and laser Doppler velocimetry, have been adopted for a wide array of applications in biomedical and tissue optics [2 10]. Inasmuch as photon correlation spectroscopy and laser Doppler technique are based on the autocorrelation functions or their Fourier transforms, sufficiently fast sampling rates are needed to meet the Nyquist criterion in the frequency domain. In the context of blood flow imaging applications, a minimum frame rate of 20 khz is often needed to measure the flows in arterioles, and hundreds and more frames must be recorded to reach a spectral resolution of 5Hz [11, 12]. For full-field applications, the requirements on sampling and recording demand the use of high-speed multiple-channel detectors and substantial computing power for the subsequent data processing to recover the spectrum of the time-varying intensity recorded at each pixel. Although high-speed CMOS detectors with fast data transfer rates and the computing power needed for data processing are now available for full-field imaging applications [11 14], it is still desirable to device a more flexible technique that is capable of extracting the spectral information at frequencies of interest and does not rely as heavily on the hardware capacity. In this work, we introduce a spectral filtering technique which utilizes low-pass filtering to extract the DC component of the power spectrum. The low-pass filtering is performed by the CMOS detector via the signal integration, which does
2 2 Advances in Optics not separate signal light of different frequencies into different physical channels as the traditional optical filtering technique does. In order to extract non-dc frequency components, the spectrum is shifted in the frequency domain via the temporal modulation of the light intensity. The temporal modulation induces the stroboscopic effect; namely, if a cyclic motion has the same periodicity as the modulation frequency of the strobelightitwillappearstationaryintherecordedfilm sequence. In the language of spectral analysis, the spectrum of the cyclic motion is shifted to 0 Hz (i.e., it is made stationary). As will be explained in the theoretical section, our approach hinges on the calculation of the statistic variance resulted from the random phase angles of the sinusoidal modulation. It is this inherently statistic nature that sets this approach apart from the regular stroboscopic photography. Without the need of high-speed recordings, it can be implemented with regular multichannel detectors and is free from the limitation imposed the Nyquist criterion. As the modulation frequencycanbechosenoverawiderange,ithasthepotential for probing a wide range of frequency shifts in a variety of quasi-inelastic light scattering experiments. For instance, this large dynamic range makes it useful for mapping the speed and flow distributions of blood cells in circulatory and vascular systems. This method has been investigated for the time-varying speckle patterns generated by moving random phase objects using an imaging speckle setup [15]. Here, we demonstrate the working of this method for the Doppler broadening generated by Brownian particles in colloidal suspensions using a far-field backscattering configuration. Temporal modulation technique has been applied to fluorescence lifetime imaging, where the modulation of the excitation light or the detector sensitivity is used to generate the phase delay between the fluorescence signals and the excitation [16 19]. However, the time-delay or phase-shift is not the quantities of interest in our work. A wide-field heterodyne optical mixing configuration, which also operates in frequency domain and makes use of low-frame-rate multiple-channel detectors, has been developed for imaging the Doppler signature of the cerebral blood flow [20, 21]. This scheme differs from ours in that it employs a frequencyshifted local oscillator and is derived from the off-axis holographic method which offers it a high sensitivity at the price of the reduced field of view. Recently, an intensity fluctuation modulation (IFM) method has been applied to obtain fullfield laser speckle microvessel images [22]. Contrary to our approach, the IFM imaging is insensitive to flow velocity and is used to reconstruct microvessel images. 2. Theory Instead of shifting the band-pass filter over the spectral range of interest, as in the case of most filtering techniques, we shifted the signal spectrum itself by the sinusoidal modulation of the intensity I(t), producing the modulated intensity signal: I(t, f 0,φ) = [1 + Δ cos(2πf 0 t+φ)] I(t),whereΔ is the modulation depth which is smaller than unity, f 0 the modulation frequency, and φ thephaseangleofthesinusoidal modulation at the start of each recording. In the frequency domain, the modulation gives rise to two side-bands which are located at f 0 and f 0 : X(f,f 0,φ) =X(f)+ 1 2 Δ[e iφ X(f+f 0 )+e iφ X(f f 0 )], where X(f, f 0,φ) and X(f) are the Fourier transforms of I(t, f 0,φ)and I(t),respectively. In this approach, the low-pass filtering is implemented via the signal integration which yields the DC component of the time-varying signal in the limit of very long integration time. In practice, the integration time should be much longer than the decorrelation time associated with the time-varying intensity signal and the characteristic time of the modulation. The DC component of X(f, f 0,φ),obtainedviathelow-pass filtering is F(f 0,φ)=X(0) +Δ[cos φ X R (f 0 )+sin φ X I (f 0 )], (2) where X R (f 0 ) and X I (f 0 ) are the real and imaginary parts of the spectrum X(f) at the modulation frequency (i.e., the resonant frequency component), respectively. To obtain the power spectrum, a series of F(f 0,φ n ) are recorded at a numbers of random phase angles φ n.itcan be shown that the statistic variance in F(f 0,φ n ) is directly proportional to the power spectrum of the intensity signal I(t) [15]: (1) Var [F (f 0,φ n )] X(f 0) 2, (3) where the power spectrum is given by: X(f 0 ) 2 =X 2 R (f 0)+ X 2 I (f 0). This relationship between the variance and the power spectrum can be understood by considering two situations: f 0 is close to the characteristic frequency of the timevarying signal and f 0 is very different from the characteristic frequency.intheformer,anychangeinthephaseangle will give rise to a substantial variation in F(f 0,φ n );thatis, the frame-to-frame variance is large, whereas, in the latter, F(f 0,φ n ) is insensitive to the phase angle and the variance is small. To calculate the variance with high confidence, adequate numbers of recordings will be needed so that the random phase angles can go through sufficient numbers of different values. Unlike the regular stroboscopic photography where thesequenceoftherecordingsmustbekeptinorderto faithfully reconstruct the motion, the calculation of variance does not concern the sequence of the recording. In other words, our approach is a statistic method and is suitable for analyzing the dynamic laser speckle that is stochastic in nature. 3. Experimental An intensity-stabilized He-Ne laser (Newport), operating at 632.8nm,wasusedasthecoherentlightsource.Theintensity of the light was modulated by a Pockels cell electrooptic modulator (Leysop) driven by a sinusoidal voltage. The modulator
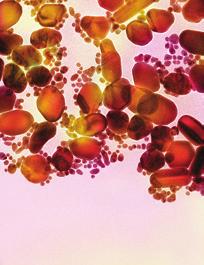
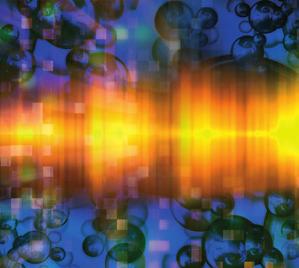
3 Advances in Optics 3 was biased at 50% transmission and responded linearly to the driving voltage. Before reaching the samples, the modulated light was expanded by a beam expander to a diameter of 7 mm, which ensures that the light was scattered by sufficient numbers of particles and the Gaussian statistic was applicable [1]. Monodisperse polystyrene particles (Bangs Laboratories) with size ranging from 0.17 μm to 3.11 μmweremixedwithdi water to form colloidal suspensions at the room temperature. The volume concentrations ranged from 0.1% to 1%, with the lowest concentrations used for smaller particles, to ensure that the single scattering condition was met [23]. The colloidal suspensions appeared to be translucent and the Tyndall effect was clear visible. The backscattering configuration is shown in Figure 1. The light scattered from the colloidal suspension was collected by a Fourier transform lens with a focal length of 10 cm, and the far-field speckle pattern was formed on an 8-bit 1024-by-1024 pixel CMOS sensor (Thorlabs) placed at thefocalplaneofthelens.thecmossensorwaspositioned with its edge aligned with the optical axis of the system to record half of the scattering pattern (because the scattering pattern is symmetric about the optical axis, this arrangement makes a better use of CMOS sensor and covers a greater range of scattering angles). An iris was placed near the lens to control the speckle size. A polarizer-analyzer pair was cross polarized to cut out the specular reflection from the cuvette. In the absence of the local oscillator, the experimental setup is expected to measure the homodyne spectrums. The integration times ranged from 100 ms to 3 s, making them much longer than the estimated characteristic times of the Brownian motion in the samples tested in our experiments. 4. Result and Discussion For each type of colloidal suspensions, 102 frames of specklepatternswererecordedateachmodulationfrequency. Figure2(a) shows a typical speckle patterns produced by Brownian particles with a diameter of 2.08 μmintheabsence of modulation. The intensity profile is measured along the horizontal reference line in Figure 2(a) and plotted in Figure 2(b). The speckle intensity is stronger at the left edge of the field where the optical axis is located (thereafter called the center of the field) and decreases towards the edge of the field, largely a result of the vignetting effect [24].The speckle patterns produced by smaller particles are characterized by similar patterns where the speckle intensity decreases towards the edge, albeit to a slightly lesser degree, which is most likely caused by the wider angular distribution of the light scattered by smaller particles [25]. The average speckle size was found tobeabout5timesthatofthepixelsize,meetingthenyquist criterion in the spatial domain [26]. In the presence of the temporal modulation, although the overall appearance of the speckle pattern remains the same, the time-integrated intensity recorded at each pixel (i.e., the DC component given in (2), obtained via low-pass filtering) fluctuates from one frame to the next. A 20-by-20 pixel region-of-interest (ROI) located at the left end of the reference line is chosen for computing the frame-to-frame Cuvette Polarizer Modulated beam Iris Analyzer Beam splitter Lens CMOS Figure 1: Schematic diagram of the backscattering configuration for recording the far-field dynamic speckle pattern. The light scattered from the colloidal suspension in the cuvette was collected by the Fourier transform lens, and the far-field speckle pattern was formed on the CMOS sensor placed at the focal plane of the lens. variance of the speckle intensity at each modulation frequency. The 400-pixel-averaged intensity in the ROI recorded at each frame is plotted in Figure 3(a) for two time-varying intensity series, with one recorded at a modulation frequency of 10 Hz, while the other is recorded at 400 Hz. According to (3), the extent of variation is directly proportional to the power spectrum at the modulation frequency, the smaller variation observed at f 0 = 400 Hz (the lower curve in Figure 3(a)) can then be explained by the fact that the homodyne power spectrum deceases monotonically with increasing frequency. For the 2.08 μm particles shown in Figure 3(a), the change in the extent of the frame-to-frame variation is most obvious when the modulation frequency increases from 10 Hz to 100 Hz. As its power spectrum levels out at higher frequencies, the frame-to-frame variation nolongerchangeappreciablywithincreasingmodulation frequency. To the contrary, the frame-to-frame variation observed for the 0.17 μm particles remains almost constant from f 0 =10Hz to 100 Hz, indicating a much flatter power spectrumatthelowendofthefrequencyrange. Similartothecalculationofthemeanvalueofastochastic variable, the frame-to-frame variance fluctuates from one calculation to the next. The accuracy of the frame-to-frame variance obviously improves with increasing number of frames used in each calculation. To find out how many frames are needed, the frame-wise variance is evaluated using increasing numbers of frames, with each calculation repeatedmultipletimestoformasetofvariancevalues.in other words, each set of variance values consists of multiple calculations performed using the same number of frames, and the standard deviation is computed for each set of variance values. As expected, the standard deviation of the variance in each set decreases with increasing number of frames used in the calculation. As shown in Figure 3(b), there is no significant drop in the standard deviation of the variance,oncethenumberofframesusedincalculatingthe variance exceeds 100 frames. Thus, it is used as the number of frames for all the calculations of variance in this work. The power spectrum of the intensity is the Fourier transform of the intensity autocorrelation g 2 (τ), whosenormalized form is given by the Siegert relation as g 2 (τ) =
4 4 Advances in Optics 120 Speckle intensity (a.u.) Pixel number (a) (b) Figure 2: (a) A typical laser speckle pattern (1024-by-1024 pixels) produced by the 2.08 μm particles. (b) The speckle intensity profile measured along the horizontal reference line given in Figure 2(a). The dashed vertical lines mark the locations of ROIs used for the spectral analysis. 24 DC component (a.u.) STD of variance (a.u.) Hz 400 Hz Frame sequence (a) Hz 400 Hz Number of frames (b) Figure 3: (a) The frame-wise fluctuation of the 400-pixel-averaged intensity in the ROI located at the field center for the 2.08 μm particles at two modulation frequencies: 10 Hz and 400 Hz. (b) The standard deviation in the frame-wise variance calculated using different numbers of frames. The solid lines are guides to the eyes. 1 + β g 1 (τ) 2,whereβ is a number depending on the ratio of detector pixel size to speckle size [27, 29]. For diffusing Brownian particles, the electric field autocorrelation g 1 (τ) is given by the diffusion coefficient D and the scattering wavevector q: g 1 (τ) = exp( Dq 2 τ). TheFouriertransform of g 2 (τ) = 1 + β exp( 2Dq 2 τ) then gives the well-known Lorentzian power spectrum. The frame-to-frame variance of the pixel-averaged intensity in the ROI is computed using 102 frames recorded at each modulation frequency, and the result isplottedagainstthefrequencyinfigure 4(a).Thedatapoints arefittedtothelorentzianpowerspectrum: X(ω) 2 =B+ C Δω [ω 2 + Δω 2 ], (4) where the bandwidth Δω is Δω = 2Dq 2 and ω is given by the modulation frequency. With the value of Δω extracted from
5 Advances in Optics Power (a.u.) Bandwidth (rad/s) μm 2.08 μm Modulation frequency (Hz) (a) Diameter (μm) (b) Figure 4: (a) The frame-wise variance of the pixel-averaged intensity in the ROI versus the modulation frequency for 0.69 μm(open squares) and 2.08 μm (solid circulars) particles. The solid lines are the Lorenztian spectral functions generated by the curve fit. (b) The bandwidths of the power spectrums obtained from the curve fit versus the actual particle diameters. The error bars are the uncertainties in Δω, produced by the least-square curve fitting procedure. The solid dots give the bandwidths obtained using the conventional intensity correlation analysis for dynamic speckle patterns recorded at a sampling rate of 120 Hz. the curve fit and the scattering wavevector calculated from the 180 scattering angle, the diffusion coefficient can then be calculated. The Stokes-Einstein equation =k B T/6πηa allows the particle size, a, to be eventually determined. The Δω extracted from the two sets of data points in Figure 4(a) is 152 and 459 rad/s, and the corresponding particle diameters are 1.99 μm and 0.66μm which are in agreement with the actual particle diameters of 2.08 μm and 0.69 μm. The bandwidths ofthepowerspectrumsobtainedfromthecurvefitare plotted against the actual particle diameters in Figure 4(b) for the colloidal suspensions tested. Comparing the six data points against the theoretical bandwidth-versus-diameter curve, which is given by the simple inverse relation, Δω = 2k B Tq 2 /6πηa, we find that the bandwidths measured using our approach agree with the values predicted based on the single scattering assumption and the Stokes-Einstein equation. To further demonstrate the benefit of the modulationbased filtering technique, the dynamic speckle produced by thediffusingparticleswasrecordedusingthesamecmos sensor at a frame rate of 120 fps. Each frame consists of 640-by-480 pixels, and the speckle intensity was recorded without the temporal modulation. The conventional correlation analysis was performed to analyze the speckle intensity: the intensity autocorrelation function was evaluated by performing the ensemble averaging over all pixels in each frame, and the subsequent Fourier transform yields the power spectrum. The bandwidths of the spectrums produced by different sized particles are plotted in Figure 4(b) along with the bandwidths determined by the modulation-based filtering technique. For the largest particle whose corresponding theoretical bandwidth is 97 rad/s, the 120 Hz sampling rate is adequate, and the bandwidths obtained by the two different schemes match well. As the particle size decreases and the sampling rate becomes smaller relative to the characteristic time of the intensity fluctuation, the bandwidths obtained with the conventional correlation analysis fall below the predicted values. For the smallest two particle sizes, because the power spectrums deviate substantially from the Lorenztian functional form due to the pronounced aliasing effect, the bandwidth can no longer be used to characterize the spectrums. Of course, one can trade off the number of pixels recorded in each frame for the faster frame rates. However, this tradeoff implies that one needs to use the time averaging in place of the ensemble averaging, and the advantage of multichannel detector is lost. To the contrary, in the modulation-based filtering technique, the upper bound of themeasurablebandwidthissetbythemodulationfrequency rather than the fastest frame rate. The values of the fitting parameter B, extracted for different particle sizes, are very close to each other, which can be verified by the observation of both fitted curves asymptotically approaching the 0.78 level in the high frequency limit in Figure 4(a). Thisbaselineofthepowerspectrum presents the white noise floor, which is contributed by the sensor dark current, the amplifier readout noise, and the shot noise as well. The data recorded in dark condition reveals a negligible detector dark current; that is, the noise is intensity related. To see the dependence of the noise on the average speckle intensity, six additional ROIs, whose locations are labeled in Figure 2(b),arechosentoanalyzethe frame-to-frame variance and extract the fitting parameters.
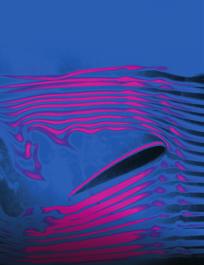
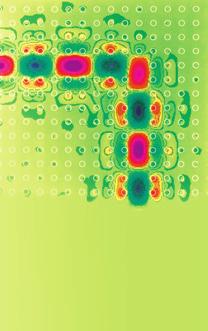
6 6 Advances in Optics Fitting parameter B Fitting parameter C C/B Speckle intensity (a.u.) (a) Speckle intensity (a.u.) (b) Figure 5: (a) The values of parameter B and C versus the speckle intensity averaged over the 400 pixels in each ROI. The red continuous curve is a quadratic function generated from the curve fit. The error bars are the uncertainties in B and C, produced by the least-square curve fitting of (4). (b) The ratio of C versus B. The solid line is a guide to the eyes. As shown in Figure 5(a), the value of parameter B decreases with decreasing speckle intensity which is averaged over the 400 pixels in each ROI. In case of pure shot noise, the noise power should be linearly proportional to the average intensity. Therefore, the nonlinear nature of the intensity dependence of the noise observed in our experiment implies that it has a more complicated origin. The dependence of the other fitting parameter (parameter C in (4)) on the average intensity is also shown in Figure 5(a), and a simple quadratic relation can be seen with the help of a fitting curve. This quadratic dependence on the average intensity is an expected resultbasedonthedefinitionofthestatisticvariance.itis worth noting that although the values of parameter B and C do not affect the Lorenztian power spectrum, as shown in (4), the ratio of C/B does affect the signal-to-noise ratio which decreases with decreasing intensity. The frame-to-frame variance of the pixel intensity for theentirefieldisalsocomputed,andtheresultsobtained at f 0 = 10Hz and 400 Hz are shown in Figures 6(a) and 6(b), where the gray level at a pixel stands for the variance in the 102 intensity values recorded at this pixel. In both maps, the variance declines from the center of the filed to the edge, but the contrast in the 10 Hz map is more pronounced. The variance profiles measured along the horizontal reference lines are shown in Figures 6(c) and 6(d),whichconfirmsthe different contrast observed in Figures 6(a) and 6(b). To ensure that the less pronounced contrast observed at f 0 =400Hz is indeed related to the dynamics of the Brownian particles, the colloidal suspension was replaced by a frost glass plate which produced similar but stationary speckle patterns. The result obtained using the frost glass plate did not vary with the modulation frequency. Given the far-filed configuration, different pixel records light scattered into different scattering angles, and consequently the variance maps are expected to show the angular distribution of the power spectrum. However, given the backscattering geometry and the small field angle (less than 5 )thechangeinbandwidthismerelyafractionof 1 Hz from the center of field to the edge, meaning that the bandwidth remains nearly constant across the field. Instead of being a consequence of the change in the spectrum, the contrast change observed in the variance maps is a result of both the modulation frequencies and the values of parameter C. At all field locations, the variance level, that is, the power spectrum, declines with increasing modulation frequency. Butbecausethechangeinthepowerspectrumisamplified by parameter C,ascanbeseenin(4), the variancemeasured at the center of the field, where the values of C are greater, is more sensitive to the increasing modulation frequency. The power spectrums at f 0 = 10Hz and 400 Hz are computed as functions of field locations using the fitting parameters and bandwidth obtained from the spectral analysis. The calculated power spectrums (Figures 6(c) and 6(d)) agreewith themeasuredonesandconfirmthedifferentialdeclination of power spectrum from the field center to the edge. Despite the smaller contrast in the variance map observed at higher frequencies, the bandwidths measured at different ROIs show no appreciable difference as predicted. This intensityindependent feature of our approach is a great advantage in the presence of nonuniform laser source profile and artifacts caused by projecting optics. For instance, a recent study has pointed out that the spatial variations in the intensity profile can impact the flow rates measured via the laser speckle contrast imaging method [29]. 5. Conclusion We demonstrated an approach for analyzing the power spectrum of the time-varying intensity presented in dynamic laser speckle patterns. The temporal modulation of the light intensity induces the stroboscopic effect which shifts the resonant
 0 200 400 600 800 1000 400 Hz 10 Hz Pixel number (d) Figure 6: The full-field power spectrum maps of for 2.")

7 Advances in Optics 7 (a) (b) Power (a.u.) Power (a.u.) Hz 400 Hz Pixel number (c) Hz 10 Hz Pixel number (d) Figure 6: The full-field power spectrum maps of for 2.08 μm particles recorded at modulation frequency of 10 Hz (a), and 400 Hz (b). The power spectrum profiles (scattered dots) measured along the horizontal reference line for 10 Hz (c), and 400 Hz (d). The solid and dashed lines are the calculated power spectrum profiles at corresponding frequencies. frequency component of the spectrum to 0 Hz. The subsequent low-pass filtering via the signal integration allows the resonant frequency component to be extracted. The random phase angle of the modulation gives rise to the frame-toframe fluctuation which is shown to be directly proportional to the value of power spectrum at the modulation frequency. The homodyne dynamic laser speckles generated by thequasi-inelasticscatteringofthebrownianmotionsin colloidal suspensions are recorded at different modulation frequencies. Each frame records the DC component of the modulated spectrum, and the frame-to-frame variance yields the original power spectrum of the time-varying intensity. The frame-to-frame variance is observed to decrease with increasing modulation frequency, giving rise to the characteristic Lorenztian power spectrum produced by the Brownian particles. The diameters of the particles are obtained based on the bandwidths obtained from the spectral analysis, which is in agreement with the actual diameters. The fitting parameter extracted from the analysis indicates that the temporal noise involved in our experiments depends on the average speckle intensity in a nonlinear fashion. Both the speckle intensity patterns and the corresponding variance maps are observed to decrease from the center of the field to the edge. The level of variance drops faster with increasing modulation frequency at the field center than at the edge, reducing the contrast observed in the variance map recorded at higher frequency. This frequency dependent behavior of the fullfield power spectrum distribution is satisfactorily explained by the amplifying effect of the average speckle intensity distribution across the field. The bandwidths measured at different ROIs are found to be independent of the average speckle intensity.
8 8 Advances in Optics To determine the power spectrum over a frequency range, themodulationfrequencywillneedtobescannedover that range. Nevertheless, the result obtained in our work demonstrates that the spectral analysis procedure can be performed with good confidence by using as few as 10 data points for spectrums lacking complex and sharp features. Within the frequency range from 10 Hz to 10 khz investigated in this work, the result demonstrates that the Lorenztian power spectra can be determined with a good accuracy provided that the integration time is much longer than the characteristic time of the modulation and the dynamics of scatterers. Applying this full-field temporal modulation method to study dynamics processes that generate sharp and distinct spectral bands is currently underway. Conflict of Interests The authors declare that there is no conflict of interests regarding the publication of this paper. Acknowledgment The authors would like to acknowledge the support of NSF RII South Carolina EPSCoR Program on tissue engineering (EPS ). References [1] B. J. Berne and R. Pecora, Dynamic Light Scattering: With Applications to Chemistry, Biology, and Physics, Dover,New York, NY, USA, [2] A. Humeau, J. L. Saumet, and J. P. L Huillier, Laser Doppler blood flowmetry multiple scattering study during reactive hyperaemia, in Proceedings of the Optical Techniques and Instrumentation for the Measurement of Blood Composition, Structure, and Dynamics,pp.9 17,July2000. [3] K. Dörschel and G. Müller, Velocity resolved laser Doppler blood flow measurements in skin, Flow Measurement and Instrumentation,vol.7,pp ,1996. [4] Y. Imai and K. Tanaka, Direct velocity sensing of flow distribution based on low-coherence interferometry, the Optical Society of America A: Optics and Image Science, and Vision,vol.16,no.8,pp ,1999. [5] F. Fitzal, D. Valentini, A. Worseg, J. Holle, and H. Redl, Evaluation of total vs. regional blood perfusion with a laser Doppler imaging system in the rat epigastric flap, Reconstructive Microsurgery,vol.17,no.1,pp.59 67,2001. [6]T.J.H.EssexandP.O.Byrne, AlaserDopplerscannerfor imaging blood flow in skin, Biomedical Engineering, vol.13,no.3,pp ,1991. [7]W.R.Ferrell,P.V.Balint,andR.D.Sturrock, Noveluseof laser Doppler imaging for investigating epicondylitis, Rheumatology,vol.39,no.11,pp ,2000. [8] D.P.Chowdhury,C.M.Sorensen,T.W.Taylor,J.F.Merklin,and T. W. Lester, Application of photon correlation spectroscopy to flowing Brownian motion systems, Applied Optics, vol.23,no. 22, pp , [9] R. Weber and G. Schweiger, Photon correlation spectroscopy on flowing polydisperse fluid-particle systems: Theory, Applied Optics,vol.37,no.18,pp ,1998. [10] W. V. Meyer, A. E. Smart, R. G. W. Brown, and M. A. Anisimov, Photon correlation and scattering: introduction to the feature issue, Applied Optics,vol.36,no.30,pp ,1997. [11] A. Serov, B. Steinacher, and T. Lasser, Full-field laser Doppler perfusion imaging and monitoring with an intelligent CMOS camera, Optics Express, vol. 13, p. 3681, [12] A. Serov and T. Lasser, High-speed laser Doppler perfusion imaging using an integrating CMOS image sensor, Optics Express,vol.13,no.17,pp ,2005. [13] M. Draijer, E. Hondebrink, T. Van Leeuwen, and W. Steenbergen, Twente optical perfusion camera: system overview and performance for video rate laser Doppler perfusion imaging, Optics Express,vol.17,no.5,pp ,2009. [14]J.H.Park,J.Platisa,J.V.Verhagenetal., Head-mountable high speed camera for optical neural recording, Neuroscience Methods,vol.201,no.2,pp ,2011. [15] D. Wang, A. Moyer, and M. Henderson, Intensity fluctuation spectra of dynamic laser speckle patterns acquired by a full-field temporal modulation method, Applied Optics,vol.51,no.31,pp , [16] A.C.Mitchell,J.E.Wall,J.G.Murray,andC.G.Morgan, Direct modulation of the effective sensitivity of a CCD detector: a new approach to time-resolved fluorescence imaging, Journal of Microscopy,vol.206,no.3,pp ,2002. [17] C.G.Morgan,Y.Hua,A.C.Mitchell,J.G.Murray,andA.D. Boardman, A compact frequency domain fluorometer with a directly modulated deuterium light source, Review of Scientific Instruments,vol.67,no.1,pp.41 47,1996. [18] J. R. Lakowicz and K. W. Berndt, Lifetime-selective fluorescence imaging using an rf phase-sensitive camera, Review of Scientific Instruments,vol.62,no.7,pp ,1991. [19] P. Herman, B. P. Maliwal, H. Lin, and J. R. Lakowicz, Frequency-domain fluorescence microscopy with the LED as a light source, Microscopy,vol.203,no.2,pp , [20] M. Simonutti, M. Paques, J. A. Sahel et al., Holographic laser Doppler ophthalmoscopy, Optics Letters, vol. 35, no. 12, pp , [21] M. Atlan, M. Gross, B. C. Forget, T. Vitalis, A. Rancillac, and A. K. Dunn, Frequency-domain wide-field laser Doppler in vivo imaging, Optics Letters, vol. 31, no. 18, pp , [22] Y. Zeng, M. Wang, G. Feng, X. Liang, and G. Yang, Laser speckle imaging based on intensity fluctuation modulation, Optics Letters, vol. 38, no. 8, pp , [23] A. Quirantes, F. Arroyo, and J. Quirantes-Ros, Multiple light scattering by spherical particle systems and its dependence on concentration: a T-matrix study, JournalofColloidandInterface Science,vol.240,no.1,pp.78 82,2001. [24] E. Wolf and M. Born, Principles of Optics, Cambridge University Press, Cambridge, UK, 7th edition, [25] H. C. van de Hulst, Light Scattering by Small Particles, Dover Publications, New York, NY, USA, [26] D.D.Duncan,S.J.Kirkpatrick,andR.K.Wang, Statisticsof local speckle contrast, the Optical Society of America A: Optics and Image Science, and Vision,vol.25,no.1,pp.9 15, [27] R.Bandyopadhyay,A.S.Gittings,S.S.Suh,P.K.Dixon,andD. J. Durian, Speckle-visibility spectroscopy: a tool to study timevarying dynamics, Review of Scientific Instruments,vol.76, no. 9, Article ID , 2005.
9 Advances in Optics 9 [28] T. B. Rice, S. D. Konecky, C. Owen, B. Choi, and B. J. Tromberg, Determination of the effect of source intensity profile on speckle contrast using coherent spatial frequency domain imaging, Biomedical Optics Express, vol. 3, no. 6, pp , [29] P.-A. Lemieux and D. J. Durian, Investigating non-gaussian scattering processes by using nth-order intensity correlation functions, the Optical Society of America A. Optics, Image Science, and Vision,vol.16,no.7,pp ,1999.


10 The Scientific World Journal Gravity Photonics Advances in Condensed Matter Physics Soft Matter Aerodynamics Fluids Submit your manuscripts at International International Optics Statistical Mechanics Thermodynamics Computational Methods in Physics Solid State Physics Astrophysics Physics Research International Advances in High Energy Physics International Superconductivity Atomic and Molecular Physics Biophysics Advances in Astronomy
Lab Report 3: Speckle Interferometry LIN PEI-YING, BAIG JOVERIA
 Lab Report 3: Speckle Interferometry LIN PEI-YING, BAIG JOVERIA Abstract: Speckle interferometry (SI) has become a complete technique over the past couple of years and is widely used in many branches of
M. N. Trainer and P. J. Freud. Application Note. SL-AN-05 Revision D. Provided By: Microtrac, Inc. Particle Size Measuring Instrumentation
 High-Concentration Submicron Particle Size Distribution by Dynamic Light Scattering: Power spectrum development with heterodyne technology advances biotechnology and nanotechnology measurements M. N. Trainer
Acoustic resolution. photoacoustic Doppler velocimetry. in blood-mimicking fluids. Supplementary Information
 Acoustic resolution photoacoustic Doppler velocimetry in blood-mimicking fluids Joanna Brunker 1, *, Paul Beard 1 Supplementary Information 1 Department of Medical Physics and Biomedical Engineering, University
Bias errors in PIV: the pixel locking effect revisited.
 Bias errors in PIV: the pixel locking effect revisited. E.F.J. Overmars 1, N.G.W. Warncke, C. Poelma and J. Westerweel 1: Laboratory for Aero & Hydrodynamics, University of Technology, Delft, The Netherlands,
Figure1. To construct a light pulse, the electric component of the plane wave should be multiplied with a bell shaped function.
 Introduction The Electric field of a monochromatic plane wave is given by is the angular frequency of the plane wave. The plot of this function is given by a cosine function as shown in the following graph.
Spectral phase shaping for high resolution CARS spectroscopy around 3000 cm 1
 Spectral phase shaping for high resolution CARS spectroscopy around 3 cm A.C.W. van Rhijn, S. Postma, J.P. Korterik, J.L. Herek, and H.L. Offerhaus Mesa + Research Institute for Nanotechnology, University
Exp No.(8) Fourier optics Optical filtering
 Fourier optics Optical filtering") Exp No.(8) Fourier optics Optical filtering Fig. 1a: Experimental set-up for Fourier optics (4f set-up). Related topics: Fourier transforms, lenses, Fraunhofer diffraction, index of refraction, Huygens
Exp No.(8) Fourier optics Optical filtering Fig. 1a: Experimental set-up for Fourier optics (4f set-up). Related topics: Fourier transforms, lenses, Fraunhofer diffraction, index of refraction, Huygens
Research Article Responsivity Enhanced NMOSFET Photodetector Fabricated by Standard CMOS Technology
 Advances in Condensed Matter Physics Volume 2015, Article ID 639769, 5 pages http://dx.doi.org/10.1155/2015/639769 Research Article Responsivity Enhanced NMOSFET Photodetector Fabricated by Standard CMOS
Examination, TEN1, in courses SK2500/SK2501, Physics of Biomedical Microscopy,
 KTH Applied Physics Examination, TEN1, in courses SK2500/SK2501, Physics of Biomedical Microscopy, 2009-06-05, 8-13, FB51 Allowed aids: Compendium Imaging Physics (handed out) Compendium Light Microscopy
Photons and solid state detection
 Photons and solid state detection Photons represent discrete packets ( quanta ) of optical energy Energy is hc/! (h: Planck s constant, c: speed of light,! : wavelength) For solid state detection, photons
Sensitive measurement of partial coherence using a pinhole array
 1.3 Sensitive measurement of partial coherence using a pinhole array Paul Petruck 1, Rainer Riesenberg 1, Richard Kowarschik 2 1 Institute of Photonic Technology, Albert-Einstein-Strasse 9, 07747 Jena,
Fast Raman Spectral Imaging Using Chirped Femtosecond Lasers
 Fast Raman Spectral Imaging Using Chirped Femtosecond Lasers Dan Fu 1, Gary Holtom 1, Christian Freudiger 1, Xu Zhang 2, Xiaoliang Sunney Xie 1 1. Department of Chemistry and Chemical Biology, Harvard
Exposure schedule for multiplexing holograms in photopolymer films
 Exposure schedule for multiplexing holograms in photopolymer films Allen Pu, MEMBER SPIE Kevin Curtis,* MEMBER SPIE Demetri Psaltis, MEMBER SPIE California Institute of Technology 136-93 Caltech Pasadena,
MASSACHUSETTS INSTITUTE OF TECHNOLOGY Department of Electrical Engineering and Computer Science
 Student Name Date MASSACHUSETTS INSTITUTE OF TECHNOLOGY Department of Electrical Engineering and Computer Science 6.161 Modern Optics Project Laboratory Laboratory Exercise No. 6 Fall 2010 Solid-State
Rec. ITU-R P RECOMMENDATION ITU-R P *
 Rec. ITU-R P.682-1 1 RECOMMENDATION ITU-R P.682-1 * PROPAGATION DATA REQUIRED FOR THE DESIGN OF EARTH-SPACE AERONAUTICAL MOBILE TELECOMMUNICATION SYSTEMS (Question ITU-R 207/3) Rec. 682-1 (1990-1992) The
R. J. Jones College of Optical Sciences OPTI 511L Fall 2017
 R. J. Jones College of Optical Sciences OPTI 511L Fall 2017 Active Modelocking of a Helium-Neon Laser The generation of short optical pulses is important for a wide variety of applications, from time-resolved
7 CHAPTER 7: REFRACTIVE INDEX MEASUREMENTS WITH COMMON PATH PHASE SENSITIVE FDOCT SETUP
 7 CHAPTER 7: REFRACTIVE INDEX MEASUREMENTS WITH COMMON PATH PHASE SENSITIVE FDOCT SETUP Abstract: In this chapter we describe the use of a common path phase sensitive FDOCT set up. The phase measurements
EVLA Memo 170 Determining full EVLA polarization leakage terms at C and X bands
 EVLA Memo 17 Determining full EVLA polarization leakage terms at C and s R.J. Sault, R.A. Perley August 29, 213 Introduction Polarimetric calibration of an interferometer array involves determining the
Supplementary Figure 1. Effect of the spacer thickness on the resonance properties of the gold and silver metasurface layers.
 Supplementary Figure 1. Effect of the spacer thickness on the resonance properties of the gold and silver metasurface layers. Finite-difference time-domain calculations of the optical transmittance through
GAIN COMPARISON MEASUREMENTS IN SPHERICAL NEAR-FIELD SCANNING
 GAIN COMPARISON MEASUREMENTS IN SPHERICAL NEAR-FIELD SCANNING ABSTRACT by Doren W. Hess and John R. Jones Scientific-Atlanta, Inc. A set of near-field measurements has been performed by combining the methods
Figure 1: A detailed sketch of the experimental set up.
 Electronic Supplementary Material (ESI) for Soft Matter. This journal is The Royal Society of Chemistry 2015 Supplementary Information Detailed Experimental Set Up camera 2 long range objective aluminum
CHAPTER 5 FINE-TUNING OF AN ECDL WITH AN INTRACAVITY LIQUID CRYSTAL ELEMENT
 CHAPTER 5 FINE-TUNING OF AN ECDL WITH AN INTRACAVITY LIQUID CRYSTAL ELEMENT In this chapter, the experimental results for fine-tuning of the laser wavelength with an intracavity liquid crystal element
On spatial resolution
 On spatial resolution Introduction How is spatial resolution defined? There are two main approaches in defining local spatial resolution. One method follows distinction criteria of pointlike objects (i.e.
Phased Array Velocity Sensor Operational Advantages and Data Analysis
 Phased Array Velocity Sensor Operational Advantages and Data Analysis Matt Burdyny, Omer Poroy and Dr. Peter Spain Abstract - In recent years the underwater navigation industry has expanded into more diverse
Introduction to Phase Noise
 hapter Introduction to Phase Noise brief introduction into the subject of phase noise is given here. We first describe the conversion of the phase fluctuations into the noise sideband of the carrier. We
Characteristics of point-focus Simultaneous Spatial and temporal Focusing (SSTF) as a two-photon excited fluorescence microscopy
 as a two-photon excited fluorescence microscopy") Characteristics of point-focus Simultaneous Spatial and temporal Focusing (SSTF) as a two-photon excited fluorescence microscopy Qiyuan Song (M2) and Aoi Nakamura (B4) Abstracts: We theoretically and experimentally
Characteristics of point-focus Simultaneous Spatial and temporal Focusing (SSTF) as a two-photon excited fluorescence microscopy Qiyuan Song (M2) and Aoi Nakamura (B4) Abstracts: We theoretically and experimentally
Doppler-Free Spetroscopy of Rubidium
 Doppler-Free Spetroscopy of Rubidium Pranjal Vachaspati, Sabrina Pasterski MIT Department of Physics (Dated: April 17, 2013) We present a technique for spectroscopy of rubidium that eliminates doppler
Speckle disturbance limit in laserbased cinema projection systems
 Speckle disturbance limit in laserbased cinema projection systems Guy Verschaffelt 1,*, Stijn Roelandt 2, Youri Meuret 2,3, Wendy Van den Broeck 4, Katriina Kilpi 4, Bram Lievens 4, An Jacobs 4, Peter
Astigmatism Particle Tracking Velocimetry for Macroscopic Flows
 1TH INTERNATIONAL SMPOSIUM ON PARTICLE IMAGE VELOCIMETR - PIV13 Delft, The Netherlands, July 1-3, 213 Astigmatism Particle Tracking Velocimetry for Macroscopic Flows Thomas Fuchs, Rainer Hain and Christian
DetectionofMicrostrctureofRoughnessbyOpticalMethod
 Global Journal of Researches in Engineering Chemical Engineering Volume 1 Issue Version 1.0 Year 01 Type: Double Blind Peer Reviewed International Research Journal Publisher: Global Journals Inc. (USA)
Single Photon Interference Katelynn Sharma and Garrett West University of Rochester, Institute of Optics, 275 Hutchison Rd. Rochester, NY 14627
 Single Photon Interference Katelynn Sharma and Garrett West University of Rochester, Institute of Optics, 275 Hutchison Rd. Rochester, NY 14627 Abstract: In studying the Mach-Zender interferometer and
NEW LASER ULTRASONIC INTERFEROMETER FOR INDUSTRIAL APPLICATIONS B.Pouet and S.Breugnot Bossa Nova Technologies; Venice, CA, USA
 NEW LASER ULTRASONIC INTERFEROMETER FOR INDUSTRIAL APPLICATIONS B.Pouet and S.Breugnot Bossa Nova Technologies; Venice, CA, USA Abstract: A novel interferometric scheme for detection of ultrasound is presented.
Digital Camera Technologies for Scientific Bio-Imaging. Part 2: Sampling and Signal
 Digital Camera Technologies for Scientific Bio-Imaging. Part 2: Sampling and Signal Yashvinder Sabharwal, 1 James Joubert 2 and Deepak Sharma 2 1. Solexis Advisors LLC, Austin, TX, USA 2. Photometrics
Understanding the performance of atmospheric free-space laser communications systems using coherent detection
 !"#$%&'()*+&, Understanding the performance of atmospheric free-space laser communications systems using coherent detection Aniceto Belmonte Technical University of Catalonia, Department of Signal Theory
1.6 Beam Wander vs. Image Jitter
 8 Chapter 1 1.6 Beam Wander vs. Image Jitter It is common at this point to look at beam wander and image jitter and ask what differentiates them. Consider a cooperative optical communication system that
Spatially Resolved Backscatter Ceilometer
 Spatially Resolved Backscatter Ceilometer Design Team Hiba Fareed, Nicholas Paradiso, Evan Perillo, Michael Tahan Design Advisor Prof. Gregory Kowalski Sponsor, Spectral Sciences Inc. Steve Richstmeier,
Far field intensity distributions of an OMEGA laser beam were measured with
 Experimental Investigation of the Far Field on OMEGA with an Annular Apertured Near Field Uyen Tran Advisor: Sean P. Regan Laboratory for Laser Energetics Summer High School Research Program 200 1 Abstract
Optimization of supercontinuum generation in photonic crystal fibers for pulse compression
 Optimization of supercontinuum generation in photonic crystal fibers for pulse compression Noah Chang Herbert Winful,Ted Norris Center for Ultrafast Optical Science University of Michigan What is Photonic
FRAUNHOFER AND FRESNEL DIFFRACTION IN ONE DIMENSION
 FRAUNHOFER AND FRESNEL DIFFRACTION IN ONE DIMENSION Revised November 15, 2017 INTRODUCTION The simplest and most commonly described examples of diffraction and interference from two-dimensional apertures
A Study of Slanted-Edge MTF Stability and Repeatability
 A Study of Slanted-Edge MTF Stability and Repeatability Jackson K.M. Roland Imatest LLC, 2995 Wilderness Place Suite 103, Boulder, CO, USA ABSTRACT The slanted-edge method of measuring the spatial frequency
Nature Neuroscience: doi: /nn Supplementary Figure 1. Optimized Bessel foci for in vivo volume imaging.
 Supplementary Figure 1 Optimized Bessel foci for in vivo volume imaging. (a) Images taken by scanning Bessel foci of various NAs, lateral and axial FWHMs: (Left panels) in vivo volume images of YFP + neurites
Study of self-interference incoherent digital holography for the application of retinal imaging
 Study of self-interference incoherent digital holography for the application of retinal imaging Jisoo Hong and Myung K. Kim Department of Physics, University of South Florida, Tampa, FL, US 33620 ABSTRACT
Design of a digital holographic interferometer for the. ZaP Flow Z-Pinch
 Design of a digital holographic interferometer for the M. P. Ross, U. Shumlak, R. P. Golingo, B. A. Nelson, S. D. Knecht, M. C. Hughes, R. J. Oberto University of Washington, Seattle, USA Abstract The
Transmission- and side-detection configurations in ultrasound-modulated optical tomography of thick biological tissues
 Transmission- and side-detection configurations in ultrasound-modulated optical tomography of thick biological tissues Jun Li, Sava Sakadžić, Geng Ku, and Lihong V. Wang Ultrasound-modulated optical tomography
Laser Speckle Reducer LSR-3000 Series
 Datasheet: LSR-3000 Series Update: 06.08.2012 Copyright 2012 Optotune Laser Speckle Reducer LSR-3000 Series Speckle noise from a laser-based system is reduced by dynamically diffusing the laser beam. A
Proceedings of Meetings on Acoustics
 Proceedings of Meetings on Acoustics Volume 19, 2013 http://acousticalsociety.org/ ICA 2013 Montreal Montreal, Canada 2-7 June 2013 Physical Acoustics Session 2pPA: Material Characterization 2pPA9. Experimental
Particle Image Velocimetry
 Markus Raffel Christian E. Willert Steve T. Wereley Jiirgen Kompenhans Particle Image Velocimetry A Practical Guide Second Edition With 288 Figures and 42 Tables < J Springer Contents Preface V 1 Introduction
Notes on Optical Amplifiers
 Notes on Optical Amplifiers Optical amplifiers typically use energy transitions such as those in atomic media or electron/hole recombination in semiconductors. In optical amplifiers that use semiconductor
2013 LMIC Imaging Workshop. Sidney L. Shaw Technical Director. - Light and the Image - Detectors - Signal and Noise
 2013 LMIC Imaging Workshop Sidney L. Shaw Technical Director - Light and the Image - Detectors - Signal and Noise The Anatomy of a Digital Image Representative Intensities Specimen: (molecular distribution)
Nd:YSO resonator array Transmission spectrum (a. u.) Supplementary Figure 1. An array of nano-beam resonators fabricated in Nd:YSO.
 Supplementary Figure 1. An array of nano-beam resonators fabricated in Nd:YSO.") a Nd:YSO resonator array µm Transmission spectrum (a. u.) b 4 F3/2-4I9/2 25 2 5 5 875 88 λ(nm) 885 Supplementary Figure. An array of nano-beam resonators fabricated in Nd:YSO. (a) Scanning electron microscope
a Nd:YSO resonator array µm Transmission spectrum (a. u.) b 4 F3/2-4I9/2 25 2 5 5 875 88 λ(nm) 885 Supplementary Figure. An array of nano-beam resonators fabricated in Nd:YSO. (a) Scanning electron microscope
Low-Frequency Vibration Measurement by a Dual-Frequency DBR Fiber Laser
 PHOTONIC SENSORS / Vol. 7, No. 3, 217: 26 21 Low-Frequency Vibration Measurement by a Dual-Frequency DBR Fiber Laser Bing ZHANG, Linghao CHENG *, Yizhi LIANG, Long JIN, Tuan GUO, and Bai-Ou GUAN Guangdong
Spectrally resolved frequency comb interferometry for long distance measurement
 Spectrally resolved frequency comb interferometry for long distance measurement Steven van den Berg, Sjoerd van Eldik, Nandini Bhattacharya Workshop Metrology for Long Distance Surveying 21 November 2014
Research Article A Polymer Film Dye Laser with Spatially Modulated Emission Controlled by Transversely Distributed Pumping
 Optical Technologies Volume 2016, Article ID 1548927, 4 pages http://dx.doi.org/10.1155/2016/1548927 Research Article A Polymer Film Dye Laser with Spatially Modulated Emission Controlled by Transversely
Fundamentals of Radio Interferometry
 Fundamentals of Radio Interferometry Rick Perley, NRAO/Socorro Fourteenth NRAO Synthesis Imaging Summer School Socorro, NM Topics Why Interferometry? The Single Dish as an interferometer The Basic Interferometer
SUPPLEMENTARY INFORMATION
 Supplementary Information S1. Theory of TPQI in a lossy directional coupler Following Barnett, et al. [24], we start with the probability of detecting one photon in each output of a lossy, symmetric beam
Exercise questions for Machine vision
 Exercise questions for Machine vision This is a collection of exercise questions. These questions are all examination alike which means that similar questions may appear at the written exam. I ve divided
Supplementary Materials for
 advances.sciencemag.org/cgi/content/full/4/2/e1700324/dc1 Supplementary Materials for Photocarrier generation from interlayer charge-transfer transitions in WS2-graphene heterostructures Long Yuan, Ting-Fung
Improving the Collection Efficiency of Raman Scattering
 PERFORMANCE Unparalleled signal-to-noise ratio with diffraction-limited spectral and imaging resolution Deep-cooled CCD with excelon sensor technology Aberration-free optical design for uniform high resolution
Supplementary Information
 Supplementary Information Supplementary Figure 1. Modal simulation and frequency response of a high- frequency (75- khz) MEMS. a, Modal frequency of the device was simulated using Coventorware and shows
Optical Signal Processing
 Optical Signal Processing ANTHONY VANDERLUGT North Carolina State University Raleigh, North Carolina A Wiley-Interscience Publication John Wiley & Sons, Inc. New York / Chichester / Brisbane / Toronto
Phase-sensitive high-speed THz imaging
 Phase-sensitive high-speed THz imaging Toshiaki Hattori, Keisuke Ohta, Rakchanok Rungsawang and Keiji Tukamoto Institute of Applied Physics, University of Tsukuba, 1-1-1 Tennodai, Tsukuba, Ibaraki, 305-8573
Multispectral Image Capturing System Based on a Micro Mirror Device with a Diffraction Grating
 Multispectral Image Capturing System Based on a Micro Mirror Device with a Diffraction Grating M. Flaspöhler, S. Buschnakowski, M. Kuhn, C. Kaufmann, J. Frühauf, T. Gessner, G. Ebest, and A. Hübler Chemnitz
AC CURRENTS, VOLTAGES, FILTERS, and RESONANCE
 July 22, 2008 AC Currents, Voltages, Filters, Resonance 1 Name Date Partners AC CURRENTS, VOLTAGES, FILTERS, and RESONANCE V(volts) t(s) OBJECTIVES To understand the meanings of amplitude, frequency, phase,
AD-A 'L-SPv1-17
 APPLIED RESEARCH LABORATORIES.,THE UNIVERSITY OF TEXAS AT AUSTIN P. 0. Box 8029 Aujn. '"X.zs,37 l.3-s029( 512),35-i2oT- FA l. 512) i 5-259 AD-A239 335'L-SPv1-17 &g. FLECTE Office of Naval Research AUG
Periodic Error Correction in Heterodyne Interferometry
 Periodic Error Correction in Heterodyne Interferometry Tony L. Schmitz, Vasishta Ganguly, Janet Yun, and Russell Loughridge Abstract This paper describes periodic error in differentialpath interferometry
Signal and Noise scaling factors in digital holography
 Signal and Noise scaling factors in digital holography Max Lesaffre, Nicolas Verrier, Michael Atlan, Michel Gross To cite this version: Max Lesaffre, Nicolas Verrier, Michael Atlan, Michel Gross. Signal
Gerhard K. Ackermann and Jurgen Eichler. Holography. A Practical Approach BICENTENNIAL. WILEY-VCH Verlag GmbH & Co. KGaA
 Gerhard K. Ackermann and Jurgen Eichler Holography A Practical Approach BICENTENNIAL BICENTENNIAL WILEY-VCH Verlag GmbH & Co. KGaA Contents Preface XVII Part 1 Fundamentals of Holography 1 1 Introduction
Study of Graded Index and Truncated Apertures Using Speckle Images
 Study of Graded Index and Truncated Apertures Using Speckle Images A. M. Hamed Department of Physics, Faculty of Science, Ain Shams University, Cairo, 11566 Egypt amhamed73@hotmail.com Abstract- In this
Supplementary Information. Stochastic Optical Reconstruction Microscopy Imaging of Microtubule Arrays in Intact Arabidopsis thaliana Seedling Roots
 Supplementary Information Stochastic Optical Reconstruction Microscopy Imaging of Microtubule Arrays in Intact Arabidopsis thaliana Seedling Roots Bin Dong 1,, Xiaochen Yang 2,, Shaobin Zhu 1, Diane C.
Holography as a tool for advanced learning of optics and photonics
 Holography as a tool for advanced learning of optics and photonics Victor V. Dyomin, Igor G. Polovtsev, Alexey S. Olshukov Tomsk State University 36 Lenin Avenue, Tomsk, 634050, Russia Tel/fax: 7 3822
STEM Spectrum Imaging Tutorial
 STEM Spectrum Imaging Tutorial Gatan, Inc. 5933 Coronado Lane, Pleasanton, CA 94588 Tel: (925) 463-0200 Fax: (925) 463-0204 April 2001 Contents 1 Introduction 1.1 What is Spectrum Imaging? 2 Hardware 3
Coherence of Light and Generation of Speckle Patterns in Photobiology and Photomedicine
 Coherence of Light and Generation of Speckle Patterns in Photobiology and Photomedicine Zeev Zalevsky 1* and Michael Belkin 1 Faculty of Engineering, Bar-Ilan University, Ramat-Gan 5900, Israel, Goldshleger
Akinori Mitani and Geoff Weiner BGGN 266 Spring 2013 Non-linear optics final report. Introduction and Background
 Akinori Mitani and Geoff Weiner BGGN 266 Spring 2013 Non-linear optics final report Introduction and Background Two-photon microscopy is a type of fluorescence microscopy using two-photon excitation. It
Theoretical Framework and Simulation Results for Implementing Weighted Multiple Sampling in Scientific CCDs
 Theoretical Framework and Simulation Results for Implementing Weighted Multiple Sampling in Scientific CCDs Cristobal Alessandri 1, Dani Guzman 1, Angel Abusleme 1, Diego Avila 1, Enrique Alvarez 1, Hernan
Filtering and Data Cutoff in FSI Retrievals
 Filtering and Data Cutoff in FSI Retrievals C. Marquardt, Y. Andres, L. Butenko, A. von Engeln, A. Foresi, E. Heredia, R. Notarpietro, Y. Yoon Outline RO basics FSI-type retrievals Spherical asymmetry,
Characterization of Silicon-based Ultrasonic Nozzles
 Tamkang Journal of Science and Engineering, Vol. 7, No. 2, pp. 123 127 (24) 123 Characterization of licon-based Ultrasonic Nozzles Y. L. Song 1,2 *, S. C. Tsai 1,3, Y. F. Chou 4, W. J. Chen 1, T. K. Tseng
ANALYSIS OF ELECTRON CURRENT INSTABILITY IN E-BEAM WRITER. Jan BOK, Miroslav HORÁČEK, Stanislav KRÁL, Vladimír KOLAŘÍK, František MATĚJKA
 ANALYSIS OF ELECTRON CURRENT INSTABILITY IN E-BEAM WRITER Jan BOK, Miroslav HORÁČEK, Stanislav KRÁL, Vladimír KOLAŘÍK, František MATĚJKA Institute of Scientific Instruments of the ASCR, v. v.i., Královopolská
Spectral Analysis of the LUND/DMI Earthshine Telescope and Filters
 Spectral Analysis of the LUND/DMI Earthshine Telescope and Filters 12 August 2011-08-12 Ahmad Darudi & Rodrigo Badínez A1 1. Spectral Analysis of the telescope and Filters This section reports the characterization
Swept Wavelength Testing:
 Application Note 13 Swept Wavelength Testing: Characterizing the Tuning Linearity of Tunable Laser Sources In a swept-wavelength measurement system, the wavelength of a tunable laser source (TLS) is swept
Measurements of Droplets Spatial Distribution in Spray by Combining Focus and Defocus Images
 Measurements of Droplets Spatial Distribution in Spray by Combining Focus and Defocus Images Kentaro HAASHI 1*, Mitsuhisa ICHIANAGI 2, Koichi HISHIDA 3 1: Dept. of System Design Engineering, Keio University,
SUPPLEMENTARY INFORMATION DOI: /NPHOTON
 Supplementary Methods and Data 1. Apparatus Design The time-of-flight measurement apparatus built in this study is shown in Supplementary Figure 1. An erbium-doped femtosecond fibre oscillator (C-Fiber,
White-light interferometry, Hilbert transform, and noise
 White-light interferometry, Hilbert transform, and noise Pavel Pavlíček *a, Václav Michálek a a Institute of Physics of Academy of Science of the Czech Republic, Joint Laboratory of Optics, 17. listopadu
OCT Spectrometer Design Understanding roll-off to achieve the clearest images
 OCT Spectrometer Design Understanding roll-off to achieve the clearest images Building a high-performance spectrometer for OCT imaging requires a deep understanding of the finer points of both OCT theory
z t h l g 2009 John Wiley & Sons, Inc. Published 2009 by John Wiley & Sons, Inc.
 x w z t h l g Figure 10.1 Photoconductive switch in microstrip transmission-line geometry: (a) top view; (b) side view. Adapted from [579]. Copyright 1983, IEEE. I g G t C g V g V i V r t x u V t Z 0 Z
Sampling Efficiency in Digital Camera Performance Standards
 Copyright 2008 SPIE and IS&T. This paper was published in Proc. SPIE Vol. 6808, (2008). It is being made available as an electronic reprint with permission of SPIE and IS&T. One print or electronic copy
Parallel Digital Holography Three-Dimensional Image Measurement Technique for Moving Cells
 F e a t u r e A r t i c l e Feature Article Parallel Digital Holography Three-Dimensional Image Measurement Technique for Moving Cells Yasuhiro Awatsuji The author invented and developed a technique capable
Imaging obscured subsurface inhomogeneity using laser speckle
 Imaging obscured subsurface inhomogeneity using laser speckle Ralph Nothdurft, Gang Yao Department of Biological Engineering, University of Missouri-Columbia, Columbia, MO 65211 renothdurft@mizzou.edu,
Section 2 ADVANCED TECHNOLOGY DEVELOPMENTS
 Section 2 ADVANCED TECHNOLOGY DEVELOPMENTS 2.A High-Power Laser Interferometry Central to the uniformity issue is the need to determine the factors that control the target-plane intensity distribution
EENG473 Mobile Communications Module 3 : Week # (12) Mobile Radio Propagation: Small-Scale Path Loss
 Mobile Radio Propagation: Small-Scale Path Loss") EENG473 Mobile Communications Module 3 : Week # (12) Mobile Radio Propagation: Small-Scale Path Loss Introduction Small-scale fading is used to describe the rapid fluctuation of the amplitude of a radio
EENG473 Mobile Communications Module 3 : Week # (12) Mobile Radio Propagation: Small-Scale Path Loss Introduction Small-scale fading is used to describe the rapid fluctuation of the amplitude of a radio
COTTON FIBER QUALITY MEASUREMENT USING FRAUNHOFER DIFFRACTION
 COTTON FIBER QUALITY MEASUREMENT USING FRAUNHOFER DIFFRACTION Ayodeji Adedoyin, Changying Li Department of Biological and Agricultural Engineering, University of Georgia, Tifton, GA Abstract Properties
Ph 3455 The Photoelectric Effect
 Ph 3455 The Photoelectric Effect Required background reading Tipler, Llewellyn, section 3-3 Prelab Questions 1. In this experiment you will be using a mercury lamp as the source of photons. At the yellow
Robert B.Hallock Draft revised April 11, 2006 finalpaper2.doc
 How to Optimize the Sharpness of Your Photographic Prints: Part II - Practical Limits to Sharpness in Photography and a Useful Chart to Deteremine the Optimal f-stop. Robert B.Hallock hallock@physics.umass.edu
ADAPTIVE CORRECTION FOR ACOUSTIC IMAGING IN DIFFICULT MATERIALS
 ADAPTIVE CORRECTION FOR ACOUSTIC IMAGING IN DIFFICULT MATERIALS I. J. Collison, S. D. Sharples, M. Clark and M. G. Somekh Applied Optics, Electrical and Electronic Engineering, University of Nottingham,
WELCOME TO PHYC 493L Contemporary Physics Lab
 WELCOME TO PHYC 493L Contemporary Physics Lab Spring Semester 2016 Instructor: Dr Michael Hasselbeck Teaching Assistant: Chih Feng Wang (CHTM) WHAT IS THIS COURSE ABOUT? Laboratory experience for advanced
R. J. Jones Optical Sciences OPTI 511L Fall 2017
 R. J. Jones Optical Sciences OPTI 511L Fall 2017 Semiconductor Lasers (2 weeks) Semiconductor (diode) lasers are by far the most widely used lasers today. Their small size and properties of the light output
1. Explain how Doppler direction is identified with FMCW radar. Fig Block diagram of FM-CW radar. f b (up) = f r - f d. f b (down) = f r + f d
 = f r - f d. f b (down) = f r + f d") 1. Explain how Doppler direction is identified with FMCW radar. A block diagram illustrating the principle of the FM-CW radar is shown in Fig. 4.1.1 A portion of the transmitter signal acts as the reference
1. Explain how Doppler direction is identified with FMCW radar. A block diagram illustrating the principle of the FM-CW radar is shown in Fig. 4.1.1 A portion of the transmitter signal acts as the reference
Improved Spectra with a Schmidt-Czerny-Turner Spectrograph
 Improved Spectra with a Schmidt-Czerny-Turner Spectrograph Abstract For years spectra have been measured using traditional Czerny-Turner (CT) design dispersive spectrographs. Optical aberrations inherent
Pseudorandom encoding for real-valued ternary spatial light modulators
 Pseudorandom encoding for real-valued ternary spatial light modulators Markus Duelli and Robert W. Cohn Pseudorandom encoding with quantized real modulation values encodes only continuous real-valued functions.
Module 5: Experimental Modal Analysis for SHM Lecture 36: Laser doppler vibrometry. The Lecture Contains: Laser Doppler Vibrometry
 The Lecture Contains: Laser Doppler Vibrometry Basics of Laser Doppler Vibrometry Components of the LDV system Working with the LDV system file:///d /neha%20backup%20courses%2019-09-2011/structural_health/lecture36/36_1.html
Theory and Applications of Frequency Domain Laser Ultrasonics
 1st International Symposium on Laser Ultrasonics: Science, Technology and Applications July 16-18 2008, Montreal, Canada Theory and Applications of Frequency Domain Laser Ultrasonics Todd W. MURRAY 1,