Dayton Audio is proud to introduce DATS V2, the best tool ever for accurately measuring loudspeaker driver parameters in seconds.
|
|
|
- Hubert Turner
- 5 years ago
- Views:
Transcription

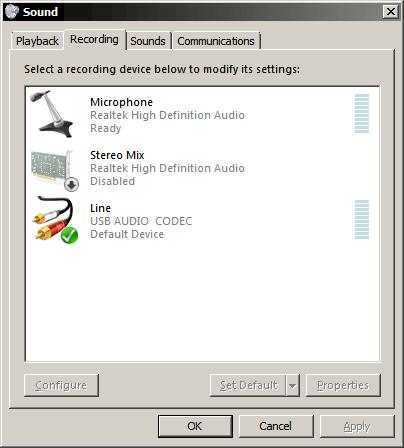
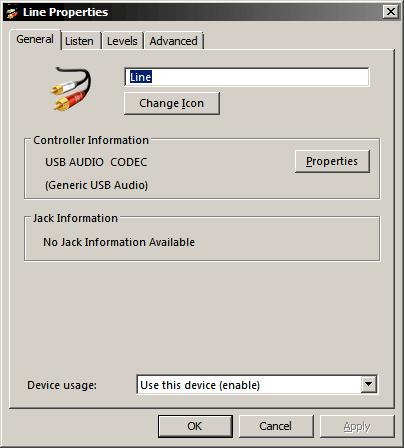
1 Dayton Audio is proud to introduce DATS V2, the best tool ever for accurately measuring loudspeaker driver parameters in seconds. DATS V2 is the latest edition of the Dayton Audio Test System. The original DATS set new standards for speed, accuracy and precision in audio impedance testing. Now DATS V2 expands and improves everything users have come to love about DATS. The price remains unchanged at $ Measure Driver Parameters Quickly Screen Drivers for Rub and Buzz Issues Measure Capacitors plus ESR and DF Measure Inductors plus DCR Measure Resistors Measure 70 V Speaker Lines Generate Various Audio Signals General Audio Impedance Measurement The system measures impedance and extracts loudspeaker parameters or passive component (R, L, and C) values in just seconds and even includes our unique impedance based Rub and Buzz test. DATS includes a second test mode featuring a general purpose signal generator and oscilloscope working in tandem. The scope and generator combination provides a powerful general purpose audio test set extending beyond the capability of previous generations of woofer testers. When used with the DATS hardware the oscilloscope monitors the DATS generator output. When standard audio interfaces are available the input to the oscilloscope can be switched to another device to allow the monitoring of arbitrary input signals in addition to the DATS generator output. DATS V2 features a redesigned audio interface unit with an upgraded CODEC and instant-on behavior. The new DATS V2 system uses the default Windows settings so that no adjustments are required.
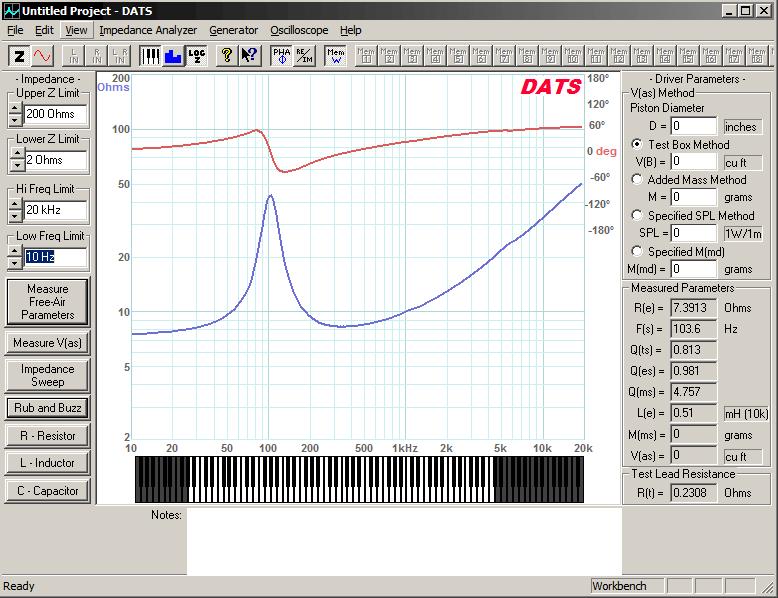
2 In addition to the hardware improvements DATS V2 also includes new V2 software adding features such as: Enhanced capacitor measurement: The new capacitor measurement module goes beyond just measuring the capacitor s value and now includes measurement of the capacitor's equivalent series resistance (ESR), dissipation factor (DF), quality factor (Q) and loss angle (δ) at three different frequencies: 120, 1k and 10k Hz. Wright Parameters: Loudspeaker parameter measurement has been expanded to include the Wright parameters which are especially useful for precision simulation. The Wright parameters allow for the accurate reproduction of a driver's high frequency inductive impedance from the four new parameters: K R X R K I and X I. Log Impedance Scale: A new user setting allows easy switching between linear and logarithmic impedance scales. Often it is convenient to view impedance on a log scale because the impedance of a pure capacitor or inductor becomes a straight line and any non-linearity is seen at a glance. The new log impedance scale has adjustments for both upper and lower impedance plot limits. Loudspeaker Parameter Measurement with DATS: Dayton Audio's DATS makes measuring loudspeaker driver parameters easier, faster and more accurate than ever before. While competitive woofer testers take around 6 minutes to measure just 30 impedance points, DATS measures over 30,000 data points in just a few seconds using a unique swept sine technique. The result is a very high-resolution impedance measurement that allows the extraction of highly accurate driver parameters, suitable for the finest loudspeaker design work. Free air parameters are measured in just a few seconds. VAS can be measured by the test box method, added mass method or more conveniently by just specifying the SPL of the driver (either 1W/1m or 2.83V). No other loudspeaker impedance tester is as fast, versatile or as easy to use as DATS. Here is the main DATS screen when measuring speaker driver parameters: Figure 1: A typical DATS V2 measurement screen

3 Figure 2 shows the Parameters page of the DATS Driver Editor. Because space on the main screen is limited, only select parameters can be displayed there. The additional measured parameters can be viewed at the Driver Editor pages. The Driver Editor pages provide space for additional user entered data beyond that which is measured by DATS. User entered data could include such things as the driver manufacturer, model number, etc. Figure 2: The DATS Driver Editor parameters page

4 Rub and Buzz Testing with DATS: Finally, the loudspeaker industry has a rub and buzz test that is affordable enough to allow routine testing of all types and sizes of speakers! DATS includes loudspeaker rub and buzz testing at a price point unheard of until now. This is made possible by our discovery that impedance measurements can reveal that rubbing is occurring in a loudspeaker. Up to this time rub and buzz problems could be detected only by resorting to acoustic measurements using expensive and specialized distortion measurement systems. Our new rub and buzz test relies on precision low level impedance measurements to detect rubbing problems. This greatly simplifies rub and buzz testing. Using the new method DATS can detect the slightest rubbing even in noisy production environments. The sensitivity of the rub and buzz test is easily customizable for efficient and adaptable production testing. Figure 3 shows the Rub and Buzz Test setup screen showing the default settings and an overview of the rub and buzz test procedure: Figure 3: The DATS Rub and Buzz setup page At the top left of the test setup window the user can adjust the signal level used for the test which (by default) is set to 30 db below the standard test level or -30 db. The other edit fields allow the user to adjust the pass/fail tolerances for FS and ZMAX. Together, these three settings give the user total control over the sensitivity of the test and are saved along with the reference sweep and other memories as part of each DATS project file. Guidelines are provided on screen for each test setting with the default values being at the center of the useful range. Figures 4 and 5 show typical test results for passing and failing drivers respectively. The green plot in each screen is the reference plot made at full signal level. The second plot is the test plot made at the reduced signal level. The test compares the FS and ZMAX of the reference unit at full signal level to the same parameters of a test unit measured at the reduced signal level. In addition to indicating the pass/fail status of the unit just tested the pass/fail dialogs also show the percent deviation from the

5 reference unit. This information can be helpful for production technicians when fine tuning the thresholds to be used to reject test units. Figure 4 shows a unit that passes the run and buzz test. We see that the low level impedance of the test unit is a good match to the response of the reference unit at full level. Figure 4: Rub and Buzz results for a good driver In Figure 5 we see a speaker that has failed the Rub and Buzz Test by exceeding both the FS and ZMAX tolerance limits. Figure 5: Rub and Buzz results for a defective driver


 driver can be tested by letting it serve as its own reference in the Rub and Buzz test.")
6 The FS is in error by 226% with a tolerance setting of ±40% so it fails the FS test. The ZMAX is in error by -241% which exceeds the 100% tolerance setting for ZMAX causing the driver to also fail this second aspect of the rub and buzz test. The shifted and miss-shaped resonance of the failed test unit is indicative of rubbing and is readily detected by the software. Good units and rubbing units are distinguished by comparing the FS and ZMAX of the test unit to that of the known good reference unit. Only if both parameters are within their tolerance settings does a unit pass the rub and buzz test. An individual (single) driver can be tested by letting it serve as its own reference in the Rub and Buzz test. Measuring Resistors, Capacitors and Inductors with DATS: The resistor, inductor and capacitor measurements employ a unique adaptive measurement procedure to assure highly accurate measurements. The R, L and C values are measured at many frequencies and then the most accurate data is identified and used to obtain the final values. This results in highly accurate and repeatable measurements of resistors, inductors and capacitors and their extended parameters. Figure 6 shows the R, L and C measurement windows following typical measurements. Note that the inductors DC resistance is measured in addition to its inductance value. For capacitors DATS V2 has added a number of new measurements including: ESR, DF, Q and loss angle measured at three different frequencies: 120, 1k and 10k Hz. Figure 6: Typical resistor, inductor and capacitor measurement dialogs
7 System Troubleshooting with DATS: DATS can also be used to diagnose fault conditions in complete multi-way speaker systems and even large installations with numerous speakers. In Figure 7 we see a comparison of a normal vented box 2-way speaker (lower curve) versus an identical speaker with a tweeter that has failed with an open circuit (upper curve). Most importantly, DATS shows that the impedance is significantly different between the two speakers thereby revealing that a problem exists. An experienced technician can quickly conclude from this comparison that the tweeter is most likely blown. Figure 7: Troubleshooting a complete speaker system with DATS This same comparative approach can be used for troubleshooting in a wide range of installed audio systems. Large sound system installations often employ 70 V audio distribution systems with long complex wire runs. By disconnecting the amplifier output and using DATS to sweep the 70 V speaker lines it is possible to compare different cable runs and quickly identify problems such as incorrect tap settings and open or shorted lines. Microphone cable runs (with microphones disconnected) can be tested in the same way as speaker cables.


8 The DATS Signal Generator and Oscilloscope Monitor: The DATS signal generator produces a low-distortion sine wave adjustable from 5.0 Hz to 20 khz. The output level is specified in dbu. In addition to the sine wave, the generator can also generate square, triangle, saw tooth and impulse waveforms as well as pink noise and white noise. The duty cycle of the square wave is adjustable. DATS also provides three different digitally synthesized logarithmic sine sweeps from 10 Hz to 20 khz. This digital sweep is a high-resolution alternative to using pink noise or stepped sine methods for system testing. You can also use the repeating sweep as a quick way to identify speaker cables in complex installations. At the top of the dialog bar is the On/Off button that starts and stops the generator output. Below the On/Off switch is the Frequency field where you enter the frequency for the sine wave generator. The generator can produce fractional frequencies such as 20.5 Hz which is very useful in low frequency testing where integer (whole number) frequencies are too coarse. The up/down buttons allow you to step the sine wave frequency up or down in steps of various sizes. Normally the frequency is stepped in musical half tones or 1/12 th octave steps. If the Shift key is held down while stepping then the step size is increased to one octave. If the Ctrl key is held down then the step size is reduced to 1 Hz. The DATS oscilloscope shows you the input audio waveform with amplitude on the vertical scale versus time on the horizontal scale. The dual-trace oscilloscope displays the input signals in several different modes. The voltage range can be adjusted from 5 V per division down to.001 V per division. The time base ranges from 200 ms/division down to 0.05 ms/division. The traces can be triggered from either the left or right inputs. The oscilloscope trace can be frozen at any time by stopping the generator. Oscilloscope controls are available at both the scope menu and at the dialog bar. The input to the oscilloscope is selected at the main toolbar. The background and trace colors for the scope display can be switched among 5 different color schemes at the View menu. The user s notes are saved along with the trace currently on the workbench with each project file. In Figure 8 the oscilloscope screen at the left shows a sine wave on the left channel. The screen on the right shows a sweep on both channels. The blue trace shows the sweep at the far side of the unit s output sensing resistor whereas the red trace is the reference signal measured at the near side of the sensing resistor. The overall envelope of the sweep seen in the blue trace actually reveals the overall shape of the impedance measurement curve. Figure 8: DATS Oscilloscope screens
 Perform Rub and Buzz Testing (with Continuous Mode for Production Testing) Measure Values of Resistors, Capacitors (also ESR and DF) and Inductors (also RE) Generate Audio Waveforms at Any")
9 DATS V2 allows you to: Measure Speaker Parameters Quickly and Accurately (FS, QTS, QMS, QES, RE, VAS, etc.) Perform Rub and Buzz Testing (with Continuous Mode for Production Testing) Measure Values of Resistors, Capacitors (also ESR and DF) and Inductors (also RE) Generate Audio Waveforms at Any Frequency or Level up to 20 khz and +5 dbu Generate Sine, Square, Triangle, Saw Tooth and Impulse Waveforms Generate Pink Noise, White Noise and Three Different Log Sweeps Monitor Generator Output Waveforms On The Dual Channel Oscilloscope Design and Verify Impedance Compensation Networks Extract Parameters from Imported Driver Impedance Data Characterize Complete Loudspeaker Systems (FSC, FB, etc.) Diagnose Loudspeaker Fault Conditions (open or shorted drivers, cables or components) Perform General Purpose Impedance Measurements (1Hz to 20k Hz, and 1 Ohm to 10k Ohms) Measure Real and Imaginary Parts of the Impedance in Addition to Magnitude and Phase Additional Features of DATS V2: Straightforward, Easy-to-Use Measurement Software Save and Load Project Files (Up to 20 Memories Each) and Print Custom Reports 1 Hz - 20,000 Hz Response, Measures any Loudspeaker Driver, Including Tweeters USB Connection Provides Power From and Data Transfer to the PC Compact USB Interface Includes Molded Test Leads with Large Alligator Clips Measured Data Can Be Printed or Saved to Create a Driver Library Parameters Can Be Exported to WinSpeakerz and Other Popular Box Design Programs Measures VAS Using Added Mass, Test Box, Specified SPL or Specified MMD Methods Easily Switch Between Measurement Units by Double-clicking the Units Field Manufactured with State-of-the-Art Equipment Using Surface Mount Components Blue LED Power Indicator Limited Five Year Warranty Package Contents USB Speaker Measuring Interface with leads CDROM with Software and online User s Guide Calibration Resistor (1k Ohm, ±0.1%) Quick Start sheet (not shown)
10 User s loved the original DATS rating it an average of 4 ½ stars out of 5 at the Parts Express product pages: Here is a sampling of actual user comments from online reviews of DATS: I love the DATS Very usefull for quick testing speakers Perfect! A vital tool for the speaker builder Essential equipment for the serious speaker builder outstanding value, a hobbyist MUST-HAVE DATS is BRILLIANT Simply fantastic Excellent purchase choice! DATS V2 System Requirements! A PC running Windows Vista, 7, 8 or 10! At Least One Available USB Port Buy DATS at Parts Express: Dayton Audio 705 Pleasant Valley Dr. Springboro, OH (937) info@daytonaudio.com Revised: 23Feb16

11
12

13
14

15
16

17
18
19
20
21
22
23
24
Dayton Audio is proud to introduce DATS V2, the best tool ever for accurately measuring loudspeaker driver parameters in seconds.
 Dayton Audio is proud to introduce DATS V2, the best tool ever for accurately measuring loudspeaker driver parameters in seconds. DATS V2 is the latest edition of the Dayton Audio Test System. The original
The Woofer Tester Pro. Integrated Speaker Measurement & Design. Web: Phone:
 Integrated Speaker Measurement & Design 1 Features Precision Thiele-Small Measurement System (Microwatt to 200W test range) Measures Voice Coil and Suspension AC and DC Compression Effects 100pF-1000uF,
The Woofer Tester 2. Precision Thiele-Small & RLC Measurement Simulation and Box Analysis. Web: Phone:
 Precision Thiele-Small & RLC Measurement Simulation and Box Analysis 1 Features Precision Thiele Small Measurement System using Constant Current Source Advanced Thiele Small Simulator with Frequency Dependent
Loudspeaker Design & Measurement
 Loudspeaker Design & Measurement Keith Larson Smith & Larson Audio Presentation to the Lone Star Audio Fest 5/3/2008 Overview Bass Enclosure Design (WT2, ST or WTPro) Thiele Small Measurements Designing
Measurement of weighted harmonic distortion HI-2
 Measurement of weighted harmonic distortion HI-2 Software of the KLIPPEL R&D and QC SYSTEM ( Document Revision 1.0) AN 7 DESCRIPTION The weighted harmonic distortion HI-2 is measured by using the DIS-Pro
Practical Impedance Measurement Using SoundCheck
 Practical Impedance Measurement Using SoundCheck Steve Temme and Steve Tatarunis, Listen, Inc. Introduction Loudspeaker impedance measurements are made for many reasons. In the R&D lab, these range from
Acoustic Measuring System
 Acoustic Measuring System Up-to-date Replacement for LMS and MLSSA Multiple curves 16 + 16 +? (depending on memory) Same calibrated sine wave level for both SPL and Impedance THD and 2 nd to 9 th harmonic
CLIO Pocket is Audiomatica's new Electro-Acoustical Multi-Platform Personal measurement system.
 Release 1.5! CLIO Pocket is Audiomatica's new Electro-Acoustical Multi-Platform Personal measurement system. The system comes complete of the CLIO Pocket software (Windows and OSX native), the CLIO CP-01
Pre-Lab. Introduction
 Pre-Lab Read through this entire lab. Perform all of your calculations (calculated values) prior to making the required circuit measurements. You may need to measure circuit component values to obtain
Lab 10 - INTRODUCTION TO AC FILTERS AND RESONANCE
 159 Name Date Partners Lab 10 - INTRODUCTION TO AC FILTERS AND RESONANCE OBJECTIVES To understand the design of capacitive and inductive filters To understand resonance in circuits driven by AC signals
Measurement of Weighted Harmonic Distortion HI-2
 Measurement of Weighted Harmonic Distortion HI-2 Application Note for the R&D and QC SYSTEM (Document Revision 1.2) AN 7 DESCRIPTION The weighted harmonic distortion HI-2 can be measured by using the DIS-Pro
FINEBox. Non-Linear High Power Box Design Program For Hi-Fi, PA and Micro loudspeakers T U T O R I A L
 FINEBox Non-Linear High Power Box Design Program For Hi-Fi, PA and Micro loudspeakers T U T O R I A L 1 FINEBox is the ideal Box Design Program for all Loudspeakers including Micro and PA drivers. Simulation
Quadra 10 Available in Black and White
 S P E C I F I C A T I O N S Quadra 10 Available in Black and White Frequency response, 1 meter on-axis, swept-sine in anechoic environment: 74 Hz 18 khz (±3 db) Usable low frequency limit (-10 db point):
Measurement at defined terminal voltage AN 41
 Measurement at defined terminal voltage AN 41 Application Note to the KLIPPEL ANALYZER SYSTEM (Document Revision 1.1) When a loudspeaker is operated via power amplifier, cables, connectors and clips the
Class #7: Experiment L & C Circuits: Filters and Energy Revisited
 Class #7: Experiment L & C Circuits: Filters and Energy Revisited In this experiment you will revisit the voltage oscillations of a simple LC circuit. Then you will address circuits made by combining resistors
P a g e 1 ST985. TDR Cable Analyzer Instruction Manual. Analog Arts Inc.
 P a g e 1 ST985 TDR Cable Analyzer Instruction Manual Analog Arts Inc. www.analogarts.com P a g e 2 Contents Software Installation... 4 Specifications... 4 Handling Precautions... 4 Operation Instruction...
ME 365 EXPERIMENT 1 FAMILIARIZATION WITH COMMONLY USED INSTRUMENTATION
 Objectives: ME 365 EXPERIMENT 1 FAMILIARIZATION WITH COMMONLY USED INSTRUMENTATION The primary goal of this laboratory is to study the operation and limitations of several commonly used pieces of instrumentation:
On-Line Students Analog Discovery 2: Arbitrary Waveform Generator (AWG). Two channel oscilloscope
. Two channel oscilloscope") EET 150 Introduction to EET Lab Activity 8 Function Generator Introduction Required Parts, Software and Equipment Parts Figure 1 Component /Value Quantity Resistor 10 kω, ¼ Watt, 5% Tolerance 1 Resistor
EET 150 Introduction to EET Lab Activity 8 Function Generator Introduction Required Parts, Software and Equipment Parts Figure 1 Component /Value Quantity Resistor 10 kω, ¼ Watt, 5% Tolerance 1 Resistor
CONTENTS. How to get started FINEQC calibration procedure 3
 CONTENTS How to get started.. 2 1. FINEQC calibration procedure 3 1.1 Output level.. 3 1.2 SPL Loopback calibration.. 4 1.3 Impedance (Z) Loopback calibration using FINELab hardware.. 5 1.4 Impedance (Z)
Balanced Armature Check (BAC)
") Balanced Armature Check (BAC) S39 Module of the KLIPPEL ANALYZER SYSTEM (QC Ver. 6.1, db-lab Ver. 210) Document Revision 1.1 FEATURES Measure the Armature offset in μm No additional sensor required Ultra-fast
Balanced Armature Check (BAC) S39 Module of the KLIPPEL ANALYZER SYSTEM (QC Ver. 6.1, db-lab Ver. 210) Document Revision 1.1 FEATURES Measure the Armature offset in μm No additional sensor required Ultra-fast
Experiment 8: An AC Circuit
 Experiment 8: An AC Circuit PART ONE: AC Voltages. Set up this circuit. Use R = 500 Ω, L = 5.0 mh and C =.01 μf. A signal generator built into the interface provides the emf to run the circuit from Output
CI-22. BASIC ELECTRONIC EXPERIMENTS with computer interface. Experiments PC1-PC8. Sample Controls Display. Instruction Manual
 CI-22 BASIC ELECTRONIC EXPERIMENTS with computer interface Experiments PC1-PC8 Sample Controls Display See these Oscilloscope Signals See these Spectrum Analyzer Signals Instruction Manual Elenco Electronics,
Lab 9: Operational amplifiers II (version 1.5)
") Lab 9: Operational amplifiers II (version 1.5) WARNING: Use electrical test equipment with care! Always double-check connections before applying power. Look for short circuits, which can quickly destroy
Lab 9: Operational amplifiers II (version 1.5) WARNING: Use electrical test equipment with care! Always double-check connections before applying power. Look for short circuits, which can quickly destroy
Impulse response. Frequency response
 CLIOwin 7, by Audiomatica, is the new measurement software for the CLIO System. The CLIO System is the easiest and less expensive way to measure: - electrical networks - electronic equipment - loudspeaker
Sampling and Reconstruction
 Experiment 10 Sampling and Reconstruction In this experiment we shall learn how an analog signal can be sampled in the time domain and then how the same samples can be used to reconstruct the original
playing! The program will print the help information, so I did this for off-line study.
 FIGURE 1: Test Lead Calibration with and without leads twisted. FIGURE 2: WT3 main screen. proper wiring of crossover networks. 7. With additional software you can calculate how severely a speaker system
10: AMPLIFIERS. Circuit Connections in the Laboratory. Op-Amp. I. Introduction
 10: AMPLIFIERS Circuit Connections in the Laboratory From now on you will construct electrical circuits and test them. The usual way of constructing circuits would be to solder each electrical connection
ECE 4670 Spring 2014 Lab 1 Linear System Characteristics
 ECE 4670 Spring 2014 Lab 1 Linear System Characteristics 1 Linear System Characteristics The first part of this experiment will serve as an introduction to the use of the spectrum analyzer in making absolute
SSE 26 SPECIFICATIONS
 SPECIFICATIONS SSE 26 Description The new SSE enclosure series features high power ratings with custom components, a sleek look and a unique, snap-in metal grille. The SSE 26 is a two-way system featuring
A Guide to Reading Transducer Specification Sheets
 A Guide to Reading Transducer Specification Sheets There are many numbers and figures appearing on a transducer specification sheet. This document serves as a guide to understanding the key parameters,
Minirators MR-PRO / MR2
 Sine Test Signals Frequency Sweeps, Chirps Pink Noise, White Noise Polarity & Delay Signal User Wavfile Playback with MRPRO Minirators MRPRO / MR2 AUDIO Signal GeneratorS Measurement Functions with MRPRO
Rub & Buzz Detection with Golden Unit AN 23
 Rub & Buzz etection with Golden Unit A 23 Application ote to the KLIPPEL R& SYSTEM Rub & buzz effects are unwanted, irregular nonlinear distortion effects. They are caused by mechanical or structural defects
FINEBox T U T O R I A L
 FINEBox Non-Linear High Power Box Design Program For Hi-Fi, PA and Micro loudspeakers T U T O R I A L www.loudsoft.com 1 Contents 1. Micro Loudspeaker / Receiver Box Design... 4 2. 15 inch PRO-Sound Woofer...
Causes for Amplitude Compression AN 12
 Causes for Amplitude AN 2 Application Note to the R&D SYSTEM Both thermal and nonlinear effects limit the amplitude of the fundamental component in the state variables and in the sound pressure output.
Agilent U8903A Audio Analyzer
 Agilent U8903A Audio Analyzer Fast and accurate multi-channels audio analysis made affordable (Replacement of the HP 8903B) Page 1 Agilent Restricted New U8903A Audio Analyzer Replacing the Popular HP
NTI Minirator MR-PRO Mike Rivers
 NTI Minirator MR-PRO Mike Rivers I love neat gadgets, and when the Neutrik (at the time) Minirator MR1 was introduced at the Fall 1988 AES show, it was love at first sight. This pocket sized audio signal
Experiment 1.A. Working with Lab Equipment. ECEN 2270 Electronics Design Laboratory 1
 .A Working with Lab Equipment Electronics Design Laboratory 1 1.A.0 1.A.1 3 1.A.4 Procedures Turn in your Pre Lab before doing anything else Setup the lab waveform generator to output desired test waveforms,
Experiment 1: Instrument Familiarization (8/28/06)
") Electrical Measurement Issues Experiment 1: Instrument Familiarization (8/28/06) Electrical measurements are only as meaningful as the quality of the measurement techniques and the instrumentation applied
Electrical Measurement Issues Experiment 1: Instrument Familiarization (8/28/06) Electrical measurements are only as meaningful as the quality of the measurement techniques and the instrumentation applied
SPECIFICATIONS QW -1. Listen To This. Mid Frequency Section: 101 db SPL, (2 Volt input) High Frequency Section: 111 db SPL, (2.
 High Frequency Section: 111 db SPL, (2.") SPECIFICATIONS QW -1 Frequency response, 1 meter on-axis, swept-sine in an anechoic environment: 200 Hz to 18 khz (±3 db) Usable low frequency limit (-10 db point): 150 Hz Power handling: Full Range: 600
SPECIFICATIONS QW -1 Frequency response, 1 meter on-axis, swept-sine in an anechoic environment: 200 Hz to 18 khz (±3 db) Usable low frequency limit (-10 db point): 150 Hz Power handling: Full Range: 600
Core Technology Group Application Note 6 AN-6
 Characterization of an RLC Low pass Filter John F. Iannuzzi Introduction Inductor-capacitor low pass filters are utilized in systems such as audio amplifiers, speaker crossover circuits and switching power
Frequency Selective Circuits
 Lab 15 Frequency Selective Circuits Names Objectives in this lab you will Measure the frequency response of a circuit Determine the Q of a resonant circuit Build a filter and apply it to an audio signal
LABORATORY 4. Palomar College ENGR210 Spring 2017 ASSIGNED: 3/21/17
 LABORATORY 4 ASSIGNED: 3/21/17 OBJECTIVE: The purpose of this lab is to evaluate the transient and steady-state circuit response of first order and second order circuits. MINIMUM EQUIPMENT LIST: You will
Experiment 1: Instrument Familiarization
 Electrical Measurement Issues Experiment 1: Instrument Familiarization Electrical measurements are only as meaningful as the quality of the measurement techniques and the instrumentation applied to the
SSE 10 SPECIFICATIONS
 SPECIFICATIONS SSE 10 Description The SSE is a new enclosure series featuring high power ratings with custom components, a sleek look and a unique, snap-in metal grille. The SSE 10 is a twoway system featuring
Meta-Hearing Defect Detection
 Meta-Hearing Defect Detection S20 Specification to the KLIPPEL ANALYZER SYSTEM (QC6.1, db-lab 210) Document Revision 2.0 FEATURES Extension of regular Rub&Buzz detection method for highest sensitivity
UCE-DSO210 DIGITAL OSCILLOSCOPE USER MANUAL. FATIH GENÇ UCORE ELECTRONICS REV1
 UCE-DSO210 DIGITAL OSCILLOSCOPE USER MANUAL FATIH GENÇ UCORE ELECTRONICS www.ucore-electronics.com 2017 - REV1 Contents 1. Introduction... 2 2. Turn on or turn off... 3 3. Oscilloscope Mode... 3 3.1. Display
ECE3204 D2015 Lab 1. See suggested breadboard configuration on following page!
 ECE3204 D2015 Lab 1 The Operational Amplifier: Inverting and Non-inverting Gain Configurations Gain-Bandwidth Product Relationship Frequency Response Limitation Transfer Function Measurement DC Errors
ET 304A Laboratory Tutorial-Circuitmaker For Transient and Frequency Analysis
 ET 304A Laboratory Tutorial-Circuitmaker For Transient and Frequency Analysis All circuit simulation packages that use the Pspice engine allow users to do complex analysis that were once impossible to
SSE 12 SPECIFICATIONS
 SPECIFICATIONS SSE 12 Description The SSE is a new enclosure series featuring high power ratings with custom components, a sleek look and a unique, snap-in metal grille. The SSE 12 is a twoway system featuring
Resonant Frequency of the LRC Circuit (Power Output, Voltage Sensor)
") 72 Resonant Frequency of the LRC Circuit (Power Output, Voltage Sensor) Equipment List Qty Items Part Numbers 1 PASCO 750 Interface 1 Voltage Sensor CI-6503 1 AC/DC Electronics Laboratory EM-8656 2 Banana
72 Resonant Frequency of the LRC Circuit (Power Output, Voltage Sensor) Equipment List Qty Items Part Numbers 1 PASCO 750 Interface 1 Voltage Sensor CI-6503 1 AC/DC Electronics Laboratory EM-8656 2 Banana
Quadra 15 Available in Black and White
 S P E C I F I C A T I O N S Quadra 15 Available in Black and White Frequency response, 1 meter onaxis, swept-sine in anechoic environment: 64 Hz to 18 khz (±3 db) Usable low frequency limit (-10 db point):
Audio Analyzer R&S UPV. Up to the limits
 44187 FIG 1 The Audio Analyzer R&S UPV shows what is possible today in audio measurements. Audio Analyzer R&S UPV The benchmark in audio analysis High-resolution digital media such as audio DVD place extremely
klippel qc system 100% end-of-line testing
 klippel qc system 100% end-of-line testing What KLIPPEL QC Offers for End-of-line Testing: KLIPPEL instruments, the recognized standard in R&D loudspeaker analysis, developed a new generation of diagnostics
Measurement of Amplitude Modulation AN 6
 Measurement of Application Note to the KLIPPEL R&D System (Document Revision 1.1) DESCRIPTION In a loudspeaker transducer, the difference between the amplitude response of the fundamental high frequency
APPLICATION NOTE MAKING GOOD MEASUREMENTS LEARNING TO RECOGNIZE AND AVOID DISTORTION SOUNDSCAPES. by Langston Holland -
 SOUNDSCAPES AN-2 APPLICATION NOTE MAKING GOOD MEASUREMENTS LEARNING TO RECOGNIZE AND AVOID DISTORTION by Langston Holland - info@audiomatica.us INTRODUCTION The purpose of our measurements is to acquire
3. Apparatus/ Materials 1) Computer 2) Vernier board circuit
 Computer 2) Vernier board circuit") Experiment 3 RLC Circuits 1. Introduction You have studied the behavior of capacitors and inductors in simple direct-current (DC) circuits. In alternating current (AC) circuits, these elements act somewhat
Experiment 3 RLC Circuits 1. Introduction You have studied the behavior of capacitors and inductors in simple direct-current (DC) circuits. In alternating current (AC) circuits, these elements act somewhat
Experiment Guide: RC/RLC Filters and LabVIEW
 Description and ackground Experiment Guide: RC/RLC Filters and LabIEW In this lab you will (a) manipulate instruments manually to determine the input-output characteristics of an RC filter, and then (b)
SPECS. Impulse (4 and 8 ohm) Two-Way Weather-Resistant Injection-Molded Speaker System SPECIFICATIONS. Built under U.S.
 Two-Way Weather-Resistant Injection-Molded Speaker System SPECIFICATIONS. Built under U.S.") SPECS P E A V E Y E L E C T R O N I C S Impulse 1012 (4 and 8 ohm) Two-Way Weather-Resistant Injection-Molded Speaker System Built under U.S. Patent 6,064,745 SPECIFICATIONS Enclosure: Peavey Impulse 1012
SPECS P E A V E Y E L E C T R O N I C S Impulse 1012 (4 and 8 ohm) Two-Way Weather-Resistant Injection-Molded Speaker System Built under U.S. Patent 6,064,745 SPECIFICATIONS Enclosure: Peavey Impulse 1012
Lab 9 Frequency Domain
 Lab 9 Frequency Domain 1 Components Required Resistors Capacitors Function Generator Multimeter Oscilloscope 2 Filter Design Filters are electric components that allow applying different operations to
datasheet Impact 55T IMPACT SERIES ENGINEERING INFORMATION FEATURES APPLICATIONS 70v/100v line transformer with low impedance tap
 IMPACT SERIES ENGINEERING datasheet The Impact series of full range, passive loudspeakers has been designed to be used in a variety of installed sound system applications, both indoors and outdoors, ranging
Rigol DG1022A Function / Arbitrary Waveform Generator
 Rigol DG1022A Function / Arbitrary Waveform Generator The Rigol DG1000 series Dual-Channel Function/Arbitrary Waveform Generator adopts DDS (Direct Digital Synthesis) technology to provide stable, high-precision,
Laboratory Project 4: Frequency Response and Filters
 2240 Laboratory Project 4: Frequency Response and Filters K. Durney and N. E. Cotter Electrical and Computer Engineering Department University of Utah Salt Lake City, UT 84112 Abstract-You will build a
AC CURRENTS, VOLTAGES, FILTERS, and RESONANCE
 July 22, 2008 AC Currents, Voltages, Filters, Resonance 1 Name Date Partners AC CURRENTS, VOLTAGES, FILTERS, and RESONANCE V(volts) t(s) OBJECTIVES To understand the meanings of amplitude, frequency, phase,
Precalculations Individual Portion Introductory Lab: Basic Operation of Common Laboratory Instruments
 Name: Date of lab: Section number: M E 345. Lab 1 Precalculations Individual Portion Introductory Lab: Basic Operation of Common Laboratory Instruments Precalculations Score (for instructor or TA use only):
Phase Noise Measurement Personality for the Agilent ESA-E Series Spectrum Analyzers
 Phase Noise Measurement Personality for the Agilent ESA-E Series Spectrum Analyzers Product Overview Now the ESA-E series spectrum analyzers have one-button phase noise measurements, including log plot,
4. Digital Measurement of Electrical Quantities
 4.1. Concept of Digital Systems Concept A digital system is a combination of devices designed for manipulating physical quantities or information represented in digital from, i.e. they can take only discrete
UCE-DSO212 DIGITAL OSCILLOSCOPE USER MANUAL. UCORE ELECTRONICS
 UCE-DSO212 DIGITAL OSCILLOSCOPE USER MANUAL UCORE ELECTRONICS www.ucore-electronics.com 2017 Contents 1. Introduction... 2 2. Turn on or turn off... 3 3. Oscilloscope Mode... 4 3.1. Display Description...
Lab E5: Filters and Complex Impedance
 E5.1 Lab E5: Filters and Complex Impedance Note: It is strongly recommended that you complete lab E4: Capacitors and the RC Circuit before performing this experiment. Introduction Ohm s law, a well known
Testing Power Sources for Stability
 Keywords Venable, frequency response analyzer, oscillator, power source, stability testing, feedback loop, error amplifier compensation, impedance, output voltage, transfer function, gain crossover, bode
CLIO 10, by Audiomatica, is the new measurement software for the CLIO System. The CLIO System is the easiest and less expensive way to measure:
 CLIO 10, by Audiomatica, is the new measurement software for the CLIO System. The CLIO System is the easiest and less expensive way to measure: electrical networks electronic equipment loudspeaker systems
3D Distortion Measurement (DIS)
") 3D Distortion Measurement (DIS) Module of the R&D SYSTEM S4 FEATURES Voltage and frequency sweep Steady-state measurement Single-tone or two-tone excitation signal DC-component, magnitude and phase of
3D Distortion Measurement (DIS) Module of the R&D SYSTEM S4 FEATURES Voltage and frequency sweep Steady-state measurement Single-tone or two-tone excitation signal DC-component, magnitude and phase of
Agilent Correlation between TDR oscilloscope and VNA generated time domain waveform
 Agilent Correlation between TDR oscilloscope and VNA generated time domain waveform Application Note Introduction Time domain analysis (TDA) is a common method for evaluating transmission lines and has
Production Noise Immunity
 Production Noise Immunity S21 Module of the KLIPPEL ANALYZER SYSTEM (QC 6.1, db-lab 210) Document Revision 2.0 FEATURES Auto-detection of ambient noise Extension of Standard SPL task Supervises Rub&Buzz,
Audio Measurements with a Network Analyser
 Audio Measurements with a Network Analyser Peter D. Hiscocks, James Gaston Syscomp Electronic Design Limited phiscock@ee.ryerson.ca www.syscompdesign.com September 6, 2006 1 Frequency Response Much work
LAB12 Professional Series
 Specification Nominal Basket Diameter Nominal Impedance* Power Rating** Watts Music Program Resonance Usable Frequency Range*** Sensitivity Magnet Weight Gap Height Voice Coil Diameter Thiele & Small Parameters
Test No. 1. Introduction to Scope Measurements. Report History. University of Applied Sciences Hamburg. Last chance!! EEL2 No 1
 University of Applied Sciences Hamburg Group No : DEPARTMENT OF INFORMATION ENGINEERING Laboratory for Instrumentation and Measurement L: in charge of the report Test No. Date: Assistant A2: Professor:
EXPERIMENT NUMBER 2 BASIC OSCILLOSCOPE OPERATIONS
 1 EXPERIMENT NUMBER 2 BASIC OSCILLOSCOPE OPERATIONS The oscilloscope is the most versatile and most important tool in this lab and is probably the best tool an electrical engineer uses. This outline guides
DEPARTMENT OF INFORMATION ENGINEERING. Test No. 1. Introduction to Scope Measurements. 1. Correction. Term Correction. Term...
 2. Correction. Correction Report University of Applied Sciences Hamburg Group No : DEPARTMENT OF INFORMATION ENGINEERING Laboratory for Instrumentation and Measurement L: in charge of the report Test No.
DiGi++ Noise Meter. Main functions
 Main functions DiGi++ Noise Meter This application brings the functionalities of a Sound Level Meter (SLM) and of a Spectrum Analizer (RTA) to your phone: mobile hardware introduce some limitations (lower
Multiple Instrument Station Module
 Multiple Instrument Station Module Digital Storage Oscilloscope Vertical Channels Sampling rate Bandwidth Coupling Input impedance Vertical sensitivity Vertical resolution Max. input voltage Horizontal
IE-35 & IE-45 RT-60 Manual October, RT 60 Manual. for the IE-35 & IE-45. Copyright 2007 Ivie Technologies Inc. Lehi, UT. Printed in U.S.A.
 October, 2007 RT 60 Manual for the IE-35 & IE-45 Copyright 2007 Ivie Technologies Inc. Lehi, UT Printed in U.S.A. Introduction and Theory of RT60 Measurements In theory, reverberation measurements seem
Electro-Voice S40. Full Range Compact Speaker System 160 Watts Power Handling Available is Black or White
 Electro-Voice S40 Full Range Compact Speaker System 160 Watts Power Handling Available is Black or White NOTE: This data sheet refers to several graphs. In order to keep the size of this document reasonable
Quadra 12 Available in Black and White
 S P E C I F I C A T I O N S Quadra 12 Available in Black and White Frequency response, 1 meter onaxis, swept-sine in anechoic environment: 76 Hz to 18 khz (±3 db) Usable low frequency limit (-10 db point):
MULT SWP X1K K VERN START FREQ DURATION AMPLITUDE 0 TTL OUT RAMP
 Signal Generators This document is a quick reference guide to the operation of the signal generators available in the laboratories. Major functions will be covered, but some features such as their sweep
datasheet IMPACT 50 IMPACT SERIES ENGINEERING INFORMATION FEATURES APPLICATIONS Attractive injection moulded enclosure 100 watt power rating
 IMPACT SERIES ENGINEERING INFORMATION The Impact series of full range, passive loudspeakers has been designed to be used in a variety of installed sound system applications ranging from discotheques, clubs
Multi-function Gain-Phase Analyzer (Frequency Response Analyzer) Model 2505
 Model 2505") OTHER PRODUCTS.. Multi-function Gain-Phase Analyzer ( Response Analyzer) Model 2505 Standard Configurations Gain phase analyzer response analyzer Phase Angle Voltmeter (PAV) Fast dual channel wide-band
OTHER PRODUCTS.. Multi-function Gain-Phase Analyzer ( Response Analyzer) Model 2505 Standard Configurations Gain phase analyzer response analyzer Phase Angle Voltmeter (PAV) Fast dual channel wide-band
Experiment 2: Transients and Oscillations in RLC Circuits
 Experiment 2: Transients and Oscillations in RLC Circuits Will Chemelewski Partner: Brian Enders TA: Nielsen See laboratory book #1 pages 5-7, data taken September 1, 2009 September 7, 2009 Abstract Transient
Lauren Gresko, Elliott Williams, Elaine McVay Final Project Proposal 9. April Analog Synthesizer. Motivation
 Lauren Gresko, Elliott Williams, Elaine McVay 6.101 Final Project Proposal 9. April 2014 Motivation Analog Synthesizer From the birth of popular music, with the invention of the phonograph, to the increased
Bench LCR Meter Model 891
 Data Sheet Bench LCR Meter The 891 is a compact, precise, and versatile LCR meter capable of measuring inductors, capacitors, and resistors at DC or from 20 Hz to 300 khz. The instrument s 2U half-rack
3D Intermodulation Distortion Measurement AN 8
 3D Intermodulation Distortion Measurement AN 8 Application Note to the R&D SYSTEM The modulation of a high frequency tone f (voice tone and a low frequency tone f (bass tone is measured by using the 3D
QC Software Feature Overview
 QC Feature Overview QC Version 1-6 Rev 1.2 2018-08-01 1 QC System Feature Overview Valid for QC Version 6 / db-lab version 210 August 2018 For details please see specifications under www.klippel.de. Measurements
PSM Soft. Features and Functions January PC Software Guide. Getting connected and Communication
 PSM Soft PC Software Guide Features and Functions January 2010 The PSM series Phase Sensitive Multimeters provide a wide range of exceptionally accurate and versatile instrumentation in one unique package.
Low Frequency Section: 98.0 db SPL, (2.83 V input) High Frequency Section: db SPL, (2.83 V input)
 High Frequency Section: db SPL, (2.83 V input)") S P E C I F I C A T I O N S ILS 1564 Frequency Response, 1 meter on-axis, swept-sine in anechoic environment: 47 Hz - 18.5 khz (±3 db) Usable Low Frequency Limit (-10 db point): 38 Hz Power Handling: Full
S P E C I F I C A T I O N S ILS 1564 Frequency Response, 1 meter on-axis, swept-sine in anechoic environment: 47 Hz - 18.5 khz (±3 db) Usable Low Frequency Limit (-10 db point): 38 Hz Power Handling: Full
Vector Network Analyzers (VERY) Basics. Tom Powers USPAS SRF Testing Course 19 Jan. 2014
 Basics. Tom Powers USPAS SRF Testing Course 19 Jan. 2014") Vector Network Analyzers (VERY) Basics Tom Powers USPAS SRF Testing Course 19 Jan. 2014 S-Parameters A scattering matrix relates the voltage waves incident on the ports of a network to those reflected
Vector Network Analyzers (VERY) Basics Tom Powers USPAS SRF Testing Course 19 Jan. 2014 S-Parameters A scattering matrix relates the voltage waves incident on the ports of a network to those reflected
How To... Commission an Installed Sound Environment
 How To... Commission an Installed Sound Environment This document provides a practical guide on how to use NTi Audio instruments for commissioning and servicing Installed Sound environments and Evacuation
On-Line Students Analog Discovery 2: Arbitrary Waveform Generator (AWG). Two channel oscilloscope
. Two channel oscilloscope") EET 150 Introduction to EET Lab Activity 5 Oscilloscope Introduction Required Parts, Software and Equipment Parts Figure 1, Figure 2, Figure 3 Component /Value Quantity Resistor 10 kω, ¼ Watt, 5% Tolerance
EET 150 Introduction to EET Lab Activity 5 Oscilloscope Introduction Required Parts, Software and Equipment Parts Figure 1, Figure 2, Figure 3 Component /Value Quantity Resistor 10 kω, ¼ Watt, 5% Tolerance
EE2210 Laboratory Project 1 Fall 2013 Function Generator and Oscilloscope
 EE2210 Laboratory Project 1 Fall 2013 Function Generator and Oscilloscope For students to become more familiar with oscilloscopes and function generators. Pre laboratory Work Read the TDS 210 Oscilloscope
Agilent 86030A 50 GHz Lightwave Component Analyzer Product Overview
 Agilent 86030A 50 GHz Lightwave Component Analyzer Product Overview 2 Characterize 40 Gb/s optical components Modern lightwave transmission systems require accurate and repeatable characterization of their
UNIT-3. Electronic Measurements & Instrumentation
 UNIT-3 1. Draw the Block Schematic of AF Wave analyzer and explain its principle and Working? ANS: The wave analyzer consists of a very narrow pass-band filter section which can Be tuned to a particular
Lab 3: RC Circuits. Construct circuit 2 in EveryCircuit. Set values for the capacitor and resistor to match those in figure 2 and set the frequency to
 Lab 3: RC Circuits Prelab Deriving equations for the output voltage of the voltage dividers you constructed in lab 2 was fairly simple. Now we want to derive an equation for the output voltage of a circuit