EXPERIMENTAL EVALUATION OF MODIFIED PHASE TRANSFORM FOR SOUND SOURCE DETECTION
|
|
|
- Myles McGee
- 5 years ago
- Views:
Transcription

1 University of Kentucky UKnowledge University of Kentucky Master's Theses Graduate School 2007 EXPERIMENTAL EVALUATION OF MODIFIED PHASE TRANSFORM FOR SOUND SOURCE DETECTION Anand Ramamurthy University of Kentucky, Click here to let us know how access to this document benefits you. Recommended Citation Ramamurthy, Anand, "EXPERIMENTAL EVALUATION OF MODIFIED PHASE TRANSFORM FOR SOUND SOURCE DETECTION" (2007). University of Kentucky Master's Theses This Thesis is brought to you for free and open access by the Graduate School at UKnowledge. It has been accepted for inclusion in University of Kentucky Master's Theses by an authorized administrator of UKnowledge. For more information, please contact
2 ABSTRACT OF THESIS EXPERIMENTAL EVALUATION OF MODIFIED PHASE TRANSFORM FOR SOUND SOURCE DETECTION The detection of sound sources with microphone arrays can be enhanced through processing individual microphone signals prior to the delay and sum operation. One method in particular, the Phase Transform (PHAT) has demonstrated improvement in sound source location images, especially in reverberant and noisy environments. Recent work proposed a modification to the PHAT transform that allows varying degrees of spectral whitening through a single parameter, β, which has shown positive improvement in target detection in simulation results. This work focuses on experimental evaluation of the modified SRP-PHAT algorithm. Performance results are computed from actual experimental setup of an 8-element perimeter array with a receiver operating characteristic (ROC) analysis for detecting sound sources. The results verified simulation results of PHAT- β in improving target detection probabilities. The ROC analysis demonstrated the relationships between various target types (narrowband and broadband), room reverberation levels (high and low) and noise levels (different SNR) with respect to optimal β. Results from experiment strongly agree with those of simulations on the effect of PHAT in significantly improving detection performance for narrowband and broadband signals especially at low SNR and in the presence of high levels of reverberation. KEYWORDS: Microphone array, Steered Response Power (SRP), Phase Transform (PHAT), Sound Source Location (SSL) Anand Ramamurthy November 19, 2007
3 EXPERIMENTAL EVALUATION OF MODIFIED PHASE TRANSFORM FOR SOUND SOURCE DETECTION By Anand Ramamurthy Dr. Kevin D. Donohue Director of Thesis Dr. YuMing Zhang Director of Graduate Studies November 19, 2007
4 RULES FOR THE USE OF THESIS Unpublished theses submitted for the Masters degree and deposited in the University of Kentucky Library are as a rule open for inspection, but are to be used only with due regard to the rights of the authors. Bibliographical references may be noted, but quotations or summaries of parts may be published only with the permission of the author, and with the usual scholarly acknowledgments. Extensive copying or publication of the thesis in whole or in part also requires the consent of the Dean of the graduate School of the University of Kentucky. A library that borrows this dissertation for use by its patrons is expected to secure the signature of each user. Name Date
5 THESIS Anand Ramamurthy The Graduate School University of Kentucky 2007
6 EXPERIMENTAL EVALUATION OF MODIFIED PHASE TRANSFORM FOR SOUND SOURCE DETECTION THESIS A thesis submitted in partial fulfillment of the requirements for the degree of Master of Science in the College of Engineering at the University of Kentucky By Anand Ramamurthy Lexington, Kentucky Director: Dr. Kevin D. Donohue, Databeam Professor of Electrical and Computer Engineering Lexington, Kentucky 2007 i
7 DEDICATION To Appa, Amma, Arun i
8 1 ACKNOWLEDGEMENTS I would like to express my sincere gratitude to Dr. Kevin D. Donohue for his unwavering support and guidance in this project. I cherish the many discussions that I have had with him throughout this research effort which has improved my understanding in the critical aspects of the subject and spurred me to think independently. Thank you Sir, I have greatly enjoyed working with you. I would also like to thank Dr. Bruce Walcott, Dr. Robert Heath and Dr. Daniel Lau for agreeing to take part in my committee and provide their valuable insight. I would like to extend my special thanks to Dr. Jens Hannemann for his help throughout this work, my lab mates Shantilal and Arul and all my friends for their help and patience in enduring me through these days. iii
9 TABLE OF CONTENTS ACKNOWLEDGEMENTS... iii List of Tables... vii List of Figures... viii List of Files... x CHAPTER 1 Introduction and Literature Review Sound Source Localization Localization and Tracking Acoustic Localization Methods Time Difference of Arrival: TDOA Enhancements to TDOA: Steered Response Power: SRP Evolution of SRP-PHAT-β Motivation: Hypothesis Organization of the Thesis... 8 CHAPTER 2 Steered Response Power with modified PHAT (PHAT-β) Beamforming for SRP The Steered Response Power The Phase Transform (PHAT) Partial whitening Transform: PHAT-β Expected effect of PHAT- β: SSL improvement with PHAT- β: iv
10 CHAPTER 3 Experimental setup and Design Test environment Test signals used Selection of signal types: Signal SNR Algorithm implementation Analysis parameters Tapering window Signal SNR calculation Pixel classification: target vs. noise Computing the ROC values CHAPTER 4 Results and Discussion Results Discussion of target detection performance Analysis method Constant low reverberation (foam only) & different signal SNR Constant high reverberation (plexi only) & different signal SNR Constant signal SNR (lowest) & different reverberation levels CHAPTER 5 Conclusions and Future Work Summary Future work v
11 APPENDICES Appendix A: Acoustic signal modeling Appendix B: Review of different SSL techniques REFERENCES VITA vi
12 List of Tables Table 1: Weighting functions used for SRP... 6 Table 2: Summary of room setup for data acquisition Table 3: Summary of signals used to drive the source Table 4: Step size for β Table 5: Suggested β values vii
13 List of Figures Figure 1: The SRP algorithm using delay-sum beamforming Figure 2: power distribution of the speech segment with β = Figure 3: Time series plot of speech segment with β = Figure 4: power distribution of speech segment with β = Figure 5: Time series plot of speech segment with β = Figure 6: power distribution of Speech segment with β = Figure 7: Time series plot of speech segment with β = Figure 8: Effect of PHAT-β on SRP image Figure 9: Test environment setup Figure 10: Input waveform Figure 11: Flowchart for implementation of the SRP-PHAT- β Figure 12: Band pass filtered signal Figure 13: Selected segment before tapering Figure 14: Signal segment after tapering at the ends Figure 15: Effect of tapering on SRP Figure 16: Example for decision logic for a target pixel Figure 17: Example for decision logic for a noise pixel Figure 18: SRP images for narrowband and broadband signals for β = 0, 0.6 & Figure 19: Broadband Colored noise : different SNR Figure 20: Broadband signal: different SNR Figure 21: Narrowband Colored noise : different SNR Figure 22: Narrowband signal : different SNR Figure 23: Narrowband impulse: different SNR viii
14 Figure 24: Narrowband impulse: different SNR Figure 25: Broadband Colored noise : different SNR Figure 26: Broadband signal : different SNR Figure 27: Narrowband Colored noise : different SNR Figure 28: Narrowband signal : different SNR Figure 29: Broadband colored noise : different reverberation Figure 30: Broadband signal : different reverberation Figure 31: Narrowband colored noise: different reverberation Figure 32: Narrowband signal : different reverberation Figure 33: Directivity pattern of a linear aperture Figure 34: Polar plot of the directivity pattern of a linear aperture Figure 35: Polar plot of the directivity pattern of a linear sensor array Figure 36: Sound source location using TDOA on a microphone array ix
15 List of Files ETD_thesis.pdf x
16 1 CHAPTER 1 Introduction and Literature Review 1.1 Sound Source Localization Modern society craves better comfort, flexibility, quality of living. Technology has kept up to this growing demand with new generation of applications. Sound source location (SSL) with microphone arrays is one such development which finds importance in day-to-day applications like Bluetooth headsets, automobile speech enhancement, noise cancellation for audio communication, teleconferencing, speech recognition, talker characterization and voice capture in reverberant environments [1-3]. Other specialized applications involving this technology are: speech separation, robot navigation, security surveillance systems and as a key component of many new human-computer interface applications under development [4]. Distributed microphone systems have been considered for applications including advanced human computer/machine interfaces, talker tracking, and beamforming for signal-to-noise ratio (SNR) enhancements [1-3]. Many of these applications require detecting and locating a sound source. For example, application in a meeting or conference environment requires detecting and locating all voices and then beamforming on each voice to effectively create independent channels for each speaker. The failure to detect an active sound source or a false detection can significantly degrade the performance of such systems. As a major research topic, sound source location using microphone array has reached levels of performance where it is being integrated and deployed in real environments. E.g. voice-capture and automatic camera steering products using a 4-element microphone array (by Polycom Inc.) [5] and systems for high performance speech recognition in noisy environments [6, 7]. The primary goal of any SSL system is to ensure acceptable performance in different operational conditions [8]. When it comes to real-world applications, the source location estimates need to meet different reliability constraints. The primary reason for failure of such systems is the poor 1
17 performance in adverse environments, such as a room with ambient noise [9]. This problem can be addressed with a judicious decision on microphone array design and choice of a robust SSL algorithm [3, 10]. In general, SSL estimation performance is dependent on factors like: 1) quantity and quality of microphones used 2) microphone placement geometry 3) number of active sources in the FOV 4) ambient noise and reverberation levels The above factors play a major role in the decision process for SSL. Increasing the number of microphones in the array is the simplest means to achieve marginal performance improvement in adverse environmental conditions. However, in most situations, a modest number of microphones can be used to achieve adequate performance provided the ambient conditions are favorable and microphones are positioned accordingly [10]. The optimal solution for number and geometry of an array is driven by factors like room layout, prevailing acoustic conditions, number and type of sources [11]. So, many practical SSL system designs take into consideration, factors like: the specific application conditions, the hardware availability, and other cost criteria. 1.2 Localization and Tracking Obtaining the best accuracy forms the primary objective of localization and tracking systems. The sensor configuration and geometry have a strong bearing on performance. The room layout, speaking scenarios, acoustic conditions, and the prevailing environment have to be taken into consideration while designing the system. However, approaches differ depending on overall objective (e.g. detecting single/multiple sources), specific tracking framework, sensor configuration and use of different approaches such as audio, video, or their combinations. 2
18 1.3 Acoustic Localization Methods Among the different localization and tracking techniques, acoustic source localization techniques have following advantages: a) operational convenience independent of lighting conditions, b) omni-directional sensing performance and c) localization independence from visual occlusion Time Difference of Arrival: TDOA Commonly used acoustic source localization algorithms are based on time delay estimation (TDE) or time-difference of arrival (TDOA) technique. The knowledge of microphone position-geometry along with time difference of arrival of the source signal at different microphones pairs is used to estimate the source location. The reliability of a time delay estimate depends on the spatial coherence of the acoustic signal reaching the sensors, and is influenced by the distance between the microphones, the level of background noise and the extent of the room reverberation. Most of the TDOA schemes are based on estimating the maximum Generalized Cross-Correlation (GCC) between the delayed microphone-pair signals [12]. The GCC is a popular method for estimating time-delays. Its popularity is due to its low computational complexity which is achieved by Fast Fourier Transform (FFT) implementations. Let x i t denote the signal at i th microphone and X i ω be its Fourier transform over a finite interval 0 t T. The cross correlation between 2 microphone channels is: R GCC τ U ω 2 P 12 ω e jωτ (1) where, U ω is the weighting function and the cross power spectrum P 12 ω is: P 12 ω X 2 ω X 1 (ω) The superscript ( ) denotes complex conjugate. (2) 3
19 In the GCC method, the weighting function U ω is set to 1 in equation 1, and the estimated time-delay τ is given by: τ = argmax( R GCC τ ) (3) τ The performance of GCC suffers in conditions of multi-source presence and even worse for moderate to high levels of background noise and reverberation. In such cases, the GCC with Phase Transform (GCC-PHAT) method is found to have significantly better performance over conventional SSL approaches for TDOA based SSL systems [13]. The weighting function for GCC-PHAT is defined for the equation1 above, as: U ω 2 = 1 P 12 ω (4) Enhancements to TDOA: In effort to enhance the accuracy of TDOA estimates and handle multi-speaker cases, Kalman filter smoothing [14] and a combination of TDOA with particle filter approach [15] has been investigated.. The basic Kalman filter is limited to a linear assumption. Kalman filter assumes dynamics to be linear and Gaussian However, most non-trivial systems are non-linear. For example, when the sound source is human, the linearity assumption is not true for sudden changes in source position. Furthermore, in spontaneous speech, short utterances (typically less than a second) that makeup considerable portion of the speech poses further challenges when trying to implement the Kalman filter approach. In such situations, the Extended Kalman Filter (EKF) where the state transition and observation models need not be linear functions but may instead be differentiable functions. Unlike its linear counterpart, the EKF is not an optimal estimator. In addition, if the initial estimate of the state is wrong, or if the process is modeled incorrectly, the filter may quickly diverge [16, 17]. However, the above approaches still encounter difficulties in delivering consistent performance when dealing with spontaneous speech, that is variable in both space (source movement) and is sporadic over time (short intervals of signal energy). Also, the increased computational requirement of complex algorithms prohibits their use in real-time applications. 4
20 Single acoustic source localization and tracking applications are found in [18, 19]. However, fast-changing source movements as encountered in spontaneous multi-party speech requires either specific multi-source models [20] or adapting the single-source model to switch between speakers [21]. Some attempts have been made to combine the TDOA and SRP based approaches to alleviate the disadvantages of TDOA based approach [22]. Measures to improve the performance of TDOA based SSL systems designed assuming presence of ideal conditions could still hurt the performance in normal application environments. The following section describes research on a more robust approach (beamformer based) Steered Response Power: SRP Most state-of-the-art speech processing systems rely on close-talking microphones for speech acquisition to achieve good performance. But, in the case of multiparty conversational setting like meetings, the setup is often not suitable. For such scenarios, microphone arrays present a potential solution by offering distant, hands-free and reliable audio signal acquisition by making use of beamforming techniques. Beamforming consists of filtering and discriminating active speech sources from noise sources based on their spatial location [23]. The simplest technique is delay-sum beamforming, in which a delay filter is applied to each microphone channel before summing them to give a single enhanced output. A more sophisticated filter-sum beamformer that has shown good performance in speech processing applications is super-directive beamforming, in which filters are calculated to maximize the array gain for the look direction [24]. The post filtering of the beamformer output significantly improves desired signal enhancement by reducing background noise. The localization and tracking of multiple active sources is crucial for optimal performance of microphone-array based systems. Many computer vision systems have been studied to detect and track people [25], but are affected by occlusion and illumination effects. Acoustic source localization algorithms can be implemented to work efficiently in such environments independent of lighting conditions. 5
21 1.3.4 Evolution of SRP-PHAT-β Several weighting functions (filters) have been studied for improving the performance of the conventional SRP, such as: maximum likelihood (ML), smoothed coherence transforms (SCOT), the phase transform (PHAT) and the Roth processor. [12, 26-29]. The difference between the above mentioned approaches to SRP is in the weighting function used in each case which is summarized in the table below, where P xi x j (ω) is the cross power spectrum described in equation 2. Table 1: Weighting functions used for SRP Weighting function PHAT SCOT Roth processor Equation 1 P x1 x 2 (ω) 2 1 P x1 x 1 (ω)p x2 x 2 (ω) 1 P x1 x 1 (ω) The weighting function that is found to be robust to reverberant conditions is the PHAT function [5, 12]. The GCC-PHAT method [30] used for TDOA (refer equations1 to 4), is based on estimating the maximum GCC between the delayed signals and is robust to reverberations due to the influence of the PHAT. The steered response power (SRP) method [31] delays signals from different microphone channels to estimate the power output and is robust to background noise. The advantages of both the methods i.e., robustness to reverberation and background noise are combined in the SRP-PHAT method [5]. Donohue et al. (2007) introduced a modification to the PHAT, referred to as the PHAT-β transform [32], that investigates the effect of changing the degree of spectral magnitude information used by the transform using a single parameter (β). In this work, performance results of the β parameter were computed using a Monte Carlo simulation of an 8 element perimeter array and analyzed using receiver operating characteristic (ROC) analysis. Results in [32] have shown that standard PHAT significantly improves detection performance for broadband signals. Proper choice of β can result in performance improvements for both narrowband and broadband signals. 6
22 1.3.5 Motivation: Research work on sound source location has focused on algorithms for enhancing detection and localization of targets. SRP along with the Phase Transform (PHAT) weighting has shown promising results as a robust algorithm for detecting sound sources [33, 34]. A detailed analysis focused on target detection performance has shown that a variant of the PHAT, referred to as modified PHAT or PHAT-β [32, 35], actually outperforms the conventional PHAT for SRP for a variety of signal source types and operating conditions (low SNR, high reverberation). The performance results for PHAT-β demonstrated through simulation results in [32] presented a means to parametrically influence performance of PHAT with respect to signal type and bandwidth of interest. The work described in [32] and subsequently this thesis attempts to evaluate the effect of β for SRP-PHAT based approach in terms of detection performance. Detection performance is assessed using the area under the Receiver Operating Characteristics (ROC) curve [36-38] Hypothesis The objective of this thesis is to verify the results presented in [32] and develop experiments to validate and test the influence of β parameter on target detection performance. Separate tests were designed to study performance with respect to sound source detection in reverberant and noisy rooms and present an effective methodology for its solution. For an efficient evaluation of the acoustic degradations on SSL performance, this thesis will focus on the implementation SRP-PHAT-β algorithm as a function of source type, reverberation levels, and ambient noise (in terms of SNR), rather than focusing on influence of changes in specific environmental scenario and microphone geometry. Prior knowledge about the time frames where the sources was active is assumed for analysis. This is because a received signal could contain not only segment of interest but also of noise source and periods of silence. 7
23 While the focus of the experiments and analysis will be the single-source scenario, the techniques described are applicable to situations involving multiple sources with little modification. 1.4 Organization of the Thesis Chapter 2 gives an introduction to concepts of beamforming used with respect to the delay and sum beamformer implementation for steered response power computation. The later sections of this chapter discuss the SRP algorithm implementation using the PHAT weighting approach and finally the PHAT-β is introduced for SRP implementation. Chapter 3 presents the specifications of the experimental setup where the data used for all analysis in this thesis were collected. This chapter also discusses the decision choices made, and other implementation criterion used for computing and analyzing the SRP-PHAT β. Chapter 4 focuses on the results obtained from the analysis of the data gathered from the experimental setup described in chapter 3. It also presents a case-by-case discussion of the performance results obtained with respect to the simulation results published by Donohue et.al in [32] indicating the agreement of results with those in [32] and also the disagreements. Chapter 5 summarizes the conclusion and future research directions. Appendices A at the end of this thesis gives an introduction to the basics of acoustic signal modeling and the parameters involved. Appendix B is a review of commonly used SSL approaches. 8
24 CHAPTER 2 Steered Response Power with modified PHAT (PHAT-β) This chapter discusses the concepts of beamforming and Steered Response Power algorithms used for SSL. The implementation of PHAT for SRP is discussed in section 2.4 and the final section 2.5 introduces the PHAT- β for SRP implementation and the expected performance improvement for the new algorithm. An important application of SSL based beamforming has been its use in speech-array applications for voice capture [1, 6, 23, 41-43]. When applied to source localization, the beamformer output is maximized when the array is focused on the target location. The SRP algorithm exploits the multitude of microphones in order to overcome the limitation in estimation accuracy of TDOA based approaches in the presence of noise and reverberation. SRP exploits the spatial filtering ability of a microphone array which further increases its applicability for the SSL problem. SRP also enables the selective enhancement of signal from the source of interest while suppressing other unwanted signals [12, 39]. This property of SRP algorithm makes it a more robust choice for SSL applications [32]. The features of SRP which make it a better approach than TDOA in terms of robustness to reverberation for the SSL problem is discussed in this chapter and a new filter is introduced. This filter is derived from the phase transform (PHAT) [32], which applies a magnitude-normalizing weighting function to the cross-spectrum of two microphone signals. 1.1 Beamforming for SRP Consider a set of microphones and sound sources at different spatial locations. Let s i t; r i be the pressure wave resulting from the i th source. The waveform received by the m th microphone is given by [27]: 9
25 x m,i (t; r m, r i ) = s i (t; r i ) * p,i (t; r m, r i ) + n m t (5) where, p,i (t; r m, r i ) is the impulse response of the propagation path from r i to r m and n m t represents all the noise sources. Source x 1(t) Delay 0 x 2(t)... x M(t) Delay 1 Delay M-1... output x 1(t), x M(t) : signal at mics Figure 1: The SRP algorithm using delay-sum beamforming Figure 1 above shows that for an array of M microphones, a delayed and filtered version of the source signal x i (t) exists in each microphone channel. By time-aligning the delayed versions of x i (t), the resulting signals can be summed together so that all copies add constructively while the uncorrelated noise signals present in n m t cancel out. The copies of s i t at each of the individual microphones can be time-aligned by setting the steering delays equal to the negative values of the propagation delays plus some constant delay, τ 0 : m = τ 0 τ m ; (6) where, m takes values from 1,2,..M, τ 0 defines the phase center of the array, and is set to the largest propagation delay among all microphones in the array, making all the steering delays greater than or equal to zero. This implies all shifting operations are causal, which satisfies the requirement for practical implementation in a system. This also makes the steering delay values relative to one microphone. Hence, the output equation for delay-and-sum beamformer shown in Figure1: 10
26 y i t; 1. m M m=1 x m t m (7) where, 1. m are the M steering delays, which focus or steer the array to the source s spatial location or direction and x m is the signal received at the m th microphone. The delay-and-sum beamformer output y i t; 1. m in equation7, can now be expressed in terms of the microphone signal model x m,i (t; r m, r i ) of equation5 and the steering delays m from equation6, giving: y i t; 1. m s i t τ 0 ; r i m,i t τ 0 + τ m ; r m, r i M m =1 M + + n m t τ 0 + τ m m =1 (8) Considering the impulse responses of individual microphone channels m,i t to approximate a band pass filter, the output of the beamformer, as given by equation8, will be a band-limited version of s i t with amplitude M times larger than the signal from any single microphone. The degree, to which the noise signals are suppressed, depends on the nature of the noise. Separating the noise term from equation8: y i t; 1. m s i t τ 0 ; r i m,i t τ 0 + τ 0 ; r m, r i (9) Equation9 gives the output of an M-element, delay-and-sum beamformer in time domain. The frequency domain representation of equation9 is: M m=1 Y i ω M m =1 H m,i ω S i ω e jω Δ m (10) 11
27 1.2 The Steered Response Power The steered response is generally a function of M steering delays, 1. m. The steering delays are used to aim a beamformer (acoustically focus the array) at a particular position or direction in space. The steered response is obtained by sweeping the focus of the beamformer. When the focus of the beamformer corresponds to the source location, the time-aligned signals in the microphone channels add up and the power of the steered response reaches maxima due to constructive interference. The equation8 can be re-written as: y m,i t; r m, r i = m,i t τ 0 + τ m ; r m, r i s i t τ 0 ; r i dλ K + m,k t τ 0 + τ m ; r m, r k n k t τ 0 + τ m ; r k dλ k=1 + n m t (11) where, m,i represents the impulse response of the microphone and propagation path from r i to r m, n k represents correlated noise sources resulting from sources and n m t is the uncorrelated electronic noise from the sensor, amplifier, and digitizer on the m th microphone channel. For reverberant rooms, the impulse response in equation11 can be separated into a signal component (direct path only) and noise component (includes multi path signals also). If the primary operations on the sound source are the effective delays from multiple reflections and attenuation from the propagation paths, the transfer function can be represented as: m,i t; r m, r i = m,i t = N n=0 a m,i,n t τ m,i,n (12) 12
28 where, a m,i,n (t) denotes the n th path of the effective impulse response for the source at r i and microphone at r m, and τ m,i,n is the corresponding path delay. The direct path corresponds to n = 0. As the algorithms for SSL operate on small time segments, only target and noise scatterer delays falling in that segment contribute to the SRP estimate within the frame. For a single SRP frame, equation7 can be expressed in the frequency domain with the substitution of equation8 to give: N T Y m,i ω = S i,l (ω) A m,i,n (ω) i=1 p τ m,i,n e jω τ m,i,n K + N k (ω) A m,i,n (ω) e jω τ m,i,n + N m (ω) k=1 p τ m,i,n (13) where, S i,l (ω) is the Fourier transform of the i th source s i t while N k (ω) and N m (ω) are the Fourier transforms of the correlated and uncorrelated noise sources, respectively for the m th channel. N T is the number of target sources, K is the number of noise sources, and the inner summation index p, denotes summing the signal components. 1.3 The Phase Transform (PHAT) The heart of SRP is the filter-and-sum (or delay-and-sum) beamforming operation, which results in noise power reduction proportional to the number of uncorrelated microphone channels used. Uncorrelated noise typically results from the independent (electronic) noise on each microphone channel. Correlated noise, on the other hand, results from coherent noise sources in the room, like sources outside the FOV, secondary targets and reverberation. Correlated noise presents greater challenges for beamforming than uncorrelated noise, and therefore will also be incorporated into this analysis. Approaches to deal with correlated noise from independent sources and reverberation have included various type of spectral weighing involving the generalized cross correlation (GCC). If the noise spectrum is known, maximum likelihood weights can be developed to deemphasize low SNR spectral regions [33, 40]. If the noise spectrum is not known, a 13
29 phase transform (PHAT), can be applied that effectively whitens the signal spectrum [26, 33, 40, 41]. This approach is very popular when correlations are done for creating SRP likelihood functions or simply estimating time delays. Many claim that this is especially useful in reverberant environments [26]. It was shown in [33] that the PHAT is actually the optimal weighting strategy for minimizing the variance of the time delay estimate. The general PHAT function is denoted as follows, θ m,i ω = Y m,i ω Y m,i ω (14) where, θ m,i ω is the weighting function aimed at emphasizing the true source over the undesired extrema and Y m,i ω is the signal spectrum described in equation9. Just as with the phase transform, this filter whitens the microphone signal spectrum. This whitening technique effectively flattens the signal spectrum. By whitening the microphone signals, SRP can be used effectively in microphone-array applications. The effect of PHAT on SRP output accuracy is better than other similar weighting functions under realistic (reverberant) operating conditions [42]. The hypothesis is that the SRP-PHAT will peak at the actual source location even when operating conditions are noisy and highly reverberant. 1.4 Partial whitening Transform: PHAT-β While results from previous research work has shown that PHAT processing is optimal for SRP [33], there has not been considerable research to study how well targets of interest can be separated from noise peaks related to detection performance (especially at low SNR s and in presence of noise). In addition, there has been no detailed comparison between the nature of the signal bandwidth and the actual PHAT performance. In radar and sonar systems where PHAT was primarily used, the spectrum for the signal of interest is mostly narrowband in nature. Under such conditions, PHAT has shown significant improvement in robustness compared to other weighting functions for use with SRP algorithm. However, the spectral content of speech signals fluctuates (a mixture of narrowband and broadband) and is subject to change with nature and type of the source. 14
30 For such a situation, the SRP weighting function discussed in [32], can be used to control the whitening effect on a part of the spectral range of the signal will be beneficial. The research work presented in this thesis investigates the effect of a modified version of PHAT from [32] to parametrically control the level of whitening influence on the magnitude spectrum. This transform referred to as PHAT β and defined as: θ m,i ω, β = Y m,i ω Y m,i ω β (15) where, compared to equation10, β is the additional parameter that controls the extent of spectral whitening and can take values in the range 0 β 1. When β = 1, equation11 becomes the conventional PHAT (equation10) where the normalized signal spectrum θ m,i ω, β becomes 1 for all frequencies. When β = 0 the denominator is 1 and the PHAT-β has no effect on the original signal spectrum. Therefore, by varying β between 0 and 1, different levels of spectral normalization are achieved Expected effect of PHAT- β: To obtain improvement in signal SNR, a matched filter weighting can be implemented to yield an optimal signal-to-noise ratio enhancement. But, for this a prior knowledge of the signal spectra is required for the filter design. This information is often not practical to obtain, especially in the case of human speech, where source and noise spectra change from frame to frame. The PHAT-β is expected to perform well in such situations, though the PHAT does not always guarantee an improvement in the overall SNR. For wideband signals with significant non-uniformity over the spectrum, the PHAT tends to enhance SNR by increasing the signal energy over the spectrum more than that of the noise components. Also if strong resonances occur due to reverberation, the influence of β is affected relative to other spectral components. On the other hand for narrowband signals, the PHAT increases the low-power regions of the original spectrum containing little or no signal energy, which can reduce the SNR. 15
31 db The plots in Figures 2 to 7 show an example of the effect of change in β values of the modified PHAT transform discussed in this thesis in terms of its effect on the signal in time domain (Figures 2, 4, 6) and their PSD s (Figures 3, 5, 7) respectively. The signal used for generating the above plots was a 25ms segment from a voiced speech sample with the person uttering the alphabet: a in a single microphone channel at a sampling rate of 44.1 khz. The first graph (Figure 2) is the power distribution for frequencies within nyquist range, which is similar to a voiced signal spectrum with no PHAT weighting. The signal spectrum is a clear indication of voiced speech with relatively high energy in the lower end of the spectrum (below 6kHz). Figure 3 is an amplitude-time plot of the original source signal where the β value was set at 0, i.e., no PHAT Frequency (Hz) Figure 2: power distribution of the speech segment with β = 0 i.e., no PHAT x
32 Amplitude Time (secs) Figure 3: Time series plot of speech segment with β = 0 i.e., no PHAT The effect of PHAT whitening (β = 1) is shown by the power distribution plot in Figure 4, which is similar to a white noise signal containing equal content of all frequencies within the Nyquist range. Compared to the original signal in figure 2, there is an equal distribution of power for all frequencies of interest due to the effect of setting β = 1. Even high frequency components beyond the voiced speech bandwidth range (noise) are emphasized. 17
33 Amplitude db Frequency (Hz) x 10 4 Figure 4: power distribution of speech segment with β = 1 i.e., after conventional PHAT transform, when all spectral components are normalized Time (secs) Figure 5: Time series plot of speech segment with β = 1 i.e., after conventional PHAT transform 18
34 db The effect of PHAT-β transform (partial whitening transform), where 0 β 1 is shown in the power distribution in Figure.6 where β was set at 0.6. Comparing the spectrum in figure 6 to figure 2 and 4, clearly shows the effect of controlling the whitening using β. The spectral region beyond 6 khz has been emphasized relative to the frequencies of interest based on the level of whitening specified by β. The corresponding effect of PHAT-β on time signal is shown in Figure Frequency (Hz) Figure 6: power distribution of Speech segment with β = 0.6 i.e., after partial PHAT transform x
35 Amplitude time (secs) Figure 7: Time series plot of speech segment with β = 0.6 i.e., after partial PHAT transform SSL improvement with PHAT- β: The images in Figure 8 show the overall effect of β on SSL performance using SRP-PHAT. Each pair of images corresponds to SRP image obtained using a single value of β mentioned beneath the images for experimental data explained in chapter 4 for a narrowband signal sample at high SNR and for low room reverberation levels. The actual source location was at center of the black circle. The SRP images shown in Figure 8 were generated from experimental data described in chapter 3. The SRP images are shown for different values of β, with (a), (b), (c) showing the actual SRP intensity image and (d), (e), (f) are SRP images with threshold at 0 (all negative SRP values set to 0 ). The results in Figure 8 show a clear improvement in SRP images with respect to reduction in noise peak values in the SRP image. However, for β = 1, there is increase in number and amplitude of false peaks that hurts SSL performance. The influence of PHAT and PHAT-β, on SSL performance for different situations is discussed in-detail in Chapters 4 & 5. 20
")
")
 50 100 150 200 250 300 100 50")
 β =1 (f) Figure 8:")
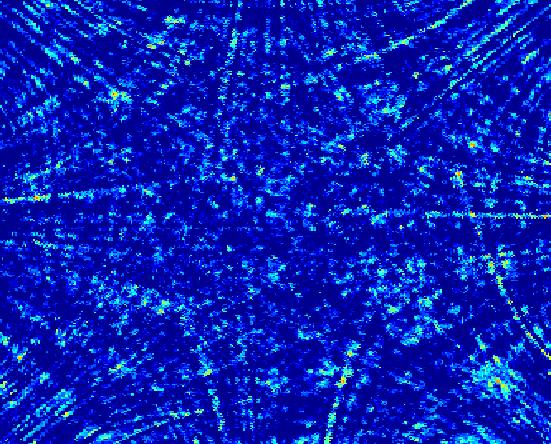
36 (a) β = 0 (d) (b) β = 0.6 (e) (c) β =1 (f) Figure 8: Effect of PHAT-β on SRP image 21
37 CHAPTER 3 Experimental setup and Design This chapter examines the purpose and design of the experimental setup used to collect the data. The purpose of the experiment was to collect data for analysis in conditions similar to what was used to produce the simulations in [32]. It includes details about the test environment, the test signal types, noise levels, hardware setup and also details on the decisions taken during the implementation of SRP-PHAT-β. 1.5 Test environment Sound path FOV Sound source positions Microphone Actual boundary of the laboratory Figure 9: Test environment setup 22
38 The experimental room was set up for data collection at the Audio lab facility in the Center for Visualization and Virtual Environments at the University of Kentucky. Figure 9 represents the experiment space marking the FOV (dotted lines), on which the microphones constituting the array were mounted. A cage was built inside the laboratory (black line) with components from 80/20 Inc. The Industrial Erector Set. The data collection and processing was driven by two AMD dual-core computers running Ubuntu Linux. Each computer is connected to Delta 1010 card by M-Audio and supports 8 analog input channels and 8 analog outputs [43]. In addition, acoustic treatments can be mounted on the wall of the cage to realize various noise and reflectively properties such an inch soundproof foam (Chambersburg, PA) to reduce reverberation levels and plexi glass (high reverberation) were used. The dimensions of the room used to run the experiments for analysis were: 3.66m for both length and width, and 2.22m for the height. The average speed of sound was estimated using the measured delay of arrival between 2 microphones for sound from a predetermined source location. It was calculated at m/s on the day of the experiment. For the data collection, perimeter array geometry was used, consisting of 8 omni-directional microphones (EMC8000, Behringer) as shown in Figure 9, where the microphones formed an equilateral octagon of dimension 1.284m. Each microphone was placed at a height of 1.57m from floor level and 28cm perpendicular from the cage surfaces. The actual microphone positions were verified using a laser measuring device. These details are summarized in table 1 below. Table 2: Summary of room setup for data acquisition Room properties Parameters Length & Width 3.66m Height 2.22m Velocity of sound 346.2ms -1 Mic array geometry 8 mics as vertices of an Equilateral octagon Microphone spacing 1.284m Source height 1.57m 23
39 During each data capture experiment, the sound source (speaker) was moved inside a fixed region within the FOV and placed at predetermined locations shown in Figure 9. At each source position, the sound source was placed along 2 orientations (the speaker facing 2 opposite directions) and data from all 8 microphones were recorded. To vary the room reverberation levels, the material used for the room wall was switched between an acoustic foam (low reverberation) and plexi glass (high reverberation). Soundproof Foam: While the acoustic foam provided increased absorption of multipath signals inside the FOV that would otherwise cause reverberation, depending on the thickness of the foam (1.125 inches for the experiment), low frequency components pass through the foam while others are attenuated. This also includes the noise from outside the FOV. Plexi glass: Plexi glass walls act as excellent reflectors resulting in a worse case multipath scenario inside the FOV. Also, while the plexi glass effectively increases reverberant conditions inside FOV, it blocks noise from outside the FOV. The reverberation time is defined as the time it takes for the acoustic pressure level to decay to one-thousandth of its former value, a 60 db drop, also commonly referred to as the RT 60 of the space. RT 60 time for the experimental environments (foam and plexi) was measured using recordings from a white noise burst. In order to get accurate RT 60 value white noise was played loud enough and long enough for the diffuse sound in the room reached steady state. The source should be about 2 meters away from the measurement mic so that the direct path does not dominate the recording. Then the white noise source was abruptly stopped but the recording continued until the sound levels fell below the noise floor. The beginning and ending parts of the recorded signal were used to estimate the signal power and noise floor power. The roll-off of sound from the room reverberation is found based on these 2 estimates. The slope of the roll-off is estimate in db per second and the amount of time for a 60dB drop in sound is calculated as RT 60 time. The RT 60 time for foam was measured at seconds while that of the plexi glass was measured to be seconds. 24
40 1.6 Test signals used Selection of signal types: Two input signal types were used to drive the source speaker. One was impulse response to a Butterworth filter of order 4, with a lower 3dB cutoff at 400Hz and upper cutoff frequency at 600Hz for the narrowband signal, and 5600Hz for broadband signal. The Butterworth impulse response was chosen due to its maximally flat spectrum in the pass and stop bands for a uniform distribution of spectral power, while its impulse response is a causal signal with the appropriate phase spectrum. This signal generation resulted in an impulse-like signal from which performance for narrow and broadband signals could be inferred. In addition to the impulse signal, a colored noise signal was generated from a white noise source using a band pass filter with a lower 3dB cutoff of 400Hz, and upper cutoff frequency of 600Hz for the narrowband signal, and 5600Hz for broadband signal. Colored noise was selected as a test signal because its power spectrum covered all frequencies in the range interest. The selection of impulse and colored noise signal sources helps in analyzing the performance of in terms of a signal that is spread out in time (colored noise) and that which exists only for a small time interval (impulse). And, the broadband and narrowband variations help analyze performance in terms of signals that have different spectral characteristics. All signals were generated at a sampling rate of 32 khz. They were later down sampled to 16 khz for analysis to reduce the size of the actual audio data file storage in computer hard drive. The downsampling to 16 khz did not affect the performance because the bandwidth of interest is in the range of 300 Hz to 6 khz. Table 3: Summary of signals used to drive the source Bandwidth Signal type Narrowband Broadband Impulse signal 400 Hz 600 Hz 400 Hz 5600 Hz Colored noise 400 Hz 600 Hz 400 Hz 5600 Hz 25
41 Amplitude Signal SNR For a better understanding of the effect of β for signals with at different SNR levels, each test signal sequence was constructed with 6 segments of different SNR levels, each separated by a time interval of 1 sec and with a 3dB drop from the previous level. The waveform is as shown in Figure 10 below st 2nd 3rd 4th 0.2 5th 6th Samples x 10 5 Figure 10: Input waveform 1.7 Algorithm implementation The implementation of the SRP-PHAT-β algorithm is described in the flowchart below in figure 11 below. 26
42 START 2 Get β, SNR level, room reverberation type & grid resolution in FOV Read processing parameters and corresponding sound file from experiment Stored sound files from experimental setup Downsample input signal to 16 khz Band pass filter the signal to the bandwidth of interest (300 Hz 7 khz) From the input signal, extract segment corresponding to SNR level required for analysis & room noise (first 0.5 seconds) SNR for the signal is determined as per details in section The tapering window is applied to the signal A tapering window of same length as signal segment is selected with a 20% Hann taper at the ends 1 27
43 1 4 Partial whitening (PHAT- β) is performed at the specified value of β for frequencies specified (all other frequencies are set to 0) SRP computed for the normalized signal at a particular point in FOV Get target peak magnitude and 8 highest noise peak magnitudes for the specified β Move to next grid point in FOV No SRP computation completed for all FOV points? 2 Yes Find noise and target peaks in SRP image based on criterion explained in Consider next value of β No Peak statistics obtained for all β? 4 3 Yes 28
44 3 Find ROC area as discussed in section and 95% confidence limit for the present levels of SNR, room reverb for the source type Plot ROC area vs β along with confidence limits Consider the next SNR / reverberation level / source type for analysis Yes Any more SNR / reverberation / source type to be analyzed? 2 No STOP Figure 11: Flowchart for implementation of the SRP-PHAT- β Analysis parameters a) Grid spacing The output of SRP is an array of values for each grid point inside the FOV. Selection of an appropriate grid resolution plays an important role in SSL accuracy by avoiding quantization errors [32]. For this thesis, the tolerance level for loss due to quantization error was set at 3dB. To ensure this limit will not exceed the 3dB limit for the frequencies of interest (300Hz 5.4kHz), the grid resolution ( grid ) inside the FOV was computed considering the worst case frequency: f (highest frequency in the signal) and a spacing bound grid of 0.02m was set according to equation(15) from [32]: 29
45 grid c d f (16) where, c is the velocity of sound measured and d = 2, is the number of coordinate dimensions where the source movement is considered. b) β values used The signals recorded using the microphone array was analyzed for β values between 0 & 1. Because the range of β values that showed significant improvement in performance of SRP were between 0.6 to 0.8, the analysis for this range included β increments of 0.05 in this range and at a 0.1 increment otherwise. Table 4: Step size for β Step size for β increment 0.6 to 0.8 otherwise Step size c) Band pass filtering The signal spectrum of interest is between 300 Hz to 5.6 khz. So, the acquired signal is band pass filtered between 300 Hz and 7 khz to remove high frequency components (>7 khz) and eliminate the low frequency noise (< 300Hz). The effect of this filtering operation is evident in Figure.12, which shows the filtered version of the raw signal from Figure.10 indicating significant reduction in levels of background (room) noise. As indicated in Figure 12, the statistics for room noise were computed based on signal segment from the first 0.5 seconds of the signal. This ensured that noise segment selected contains the steady state room noise. 30
46 Amplitude Noise segment Samples x Tapering window Figure 12: Band pass filtered signal With prior knowledge of the time frames where the signal of interest existed, the signal segment is selected to contain the source sound. For all analysis in this thesis, the segment is selected as a window that is centered on the occurrence of maximum absolute signal amplitude corresponding to a particular SNR of interest. The ends of the selected signal segment are tapered to remove abrupt discontinuities that could cause high frequency artifacts in the SRP image. The tapering is implemented by multiplying the signal segment x m,i t with a Hanning window t (t), of length equal to the signal segment but with a 20% tapering at the 2 edges. x t (t; r m, r i ) = x m,i (t; r m, r i ) * t (t) (17) The tapering effect on the signal is shown in Figure.14 and the un-tapered signal is in Figure.13. The reduction in pixilation due to tapering is clearly visible in SRP image of Figure.15 (right, compared to the one on left). 31
47 amplitude amplitude samples Figure 13: Selected segment before tapering samples Figure 14: Signal segment after tapering at the ends 32

) Then RMS value of the signal envelope is determined: 2 x rms = mean(x env t ) (18) (19) Using the statistics of room")
48 Pixilated SRP image before tapering Signal SNR calculation Figure 15: Effect of tapering on SRP Tapering results in smoother SRP image To calculate the signal SNR, the average power is computed for every signal segment before averaging over all channels. Consider x m,i (t) to be the signal from a source located at r i, received by a microphone located at r m. The signal envelope for the segment of interest is: x env t = ilbert(x m,i (t)) Then RMS value of the signal envelope is determined: 2 x rms = mean(x env t ) (18) (19) Using the statistics of room noise extracted from the first 0.5 seconds of the signal as shown in figure 12, the RMS value of noise is also estimated: n env t = ilbert(n(t)) Now, if n rms > 0, SNR = 2 n rms = mean(n env t ) ( x rms n rms ) 2, x rms < n rms ( x rms n rms ) 2, x n rms n rms rms else, if n rms 0, SNR = (20) (21) (22) 33
49 1.7.4 Pixel classification: target vs. noise Consider a case where the actual sound source was places inside the test environment as shown in the Figure 9. For analyzing the effect of β on are under ROC curves, the decision on classifying a peak detected as target or noise was made based on the decision criteria illustrated below and explained with example. Target peak: While computing the performance metrics, only positive peaks (local maxima) in the SRP image are considered as targets. So, pixels in SRP image either equal to or greater than their immediate neighborhood pixels, (strictly greater than at least one neighboring pixel) were considered as targets. A pixel closest to the actual target position is considered as the peak, and along the line connecting the peak to the original target position, none of the pixel values fell 6dB below the peak magnitude. Also, the pixels that lie on the gradient leading up to a local peak were not considered. If the above conditions were satisfied, the target peak height and location estimate error was recorded. Else, no target detection was considered and magnitude was set to zero [32]. In the Figure 16, the intensity values considered from the SRP image, are positive ( 0) as indicated by the colormap shown next to the SRP image. The pixel that was selected as target location is marked with a green circle on the bottom right part of Figure 15. For pixels marked as Case 1 in the image, though they are positive and closer to the actual source location, they are not considered as pixels corresponding to actual target peak because they lie on the slope of the gradient leading to the actual target peak. This ensures that perturbations along the gradient leading to a target peak are not considered. However, for local maxima (peaks) marked as Case 2, though they are not on the gradient leading to the actual peak, they are not considered as candidate for target peak because of their distance from actual source location. 34

50 Case1 1-1 Case Figure 16: Example for decision logic for a target pixel Noise peak: A pixel in the immediate neighborhood of the detected target is not considered for noise peak. Also, pixels along the line connecting the detected target peak to the potential noise peak consisted of a negative value or were 6dB less than the target peak value. This ensured that variations along the gradients associated with the target peaks are not considered as noise peaks [32]. Figure 17 shows the SRP intensity distribution in the FOV. The range of power values represented is indicated in the colormap shown in the sidebar next to the image. Pixels that lie in the immediate neighborhood of the detected target pixel are not considered as noise peaks (case1 in figure 17). For pixels that belong to case 2 (in figure 17), though they are not in the immediate target pixel neighborhood nor are on the gradient slope leading to a local maxima, their intensity level was not among the 8 highest peaks. 35

51 Case2 Case Figure 17: Example for decision logic for a noise pixel Computing the ROC values For all analysis in this thesis, the area under the ROC curve used to determine target detection performance. The ROC curve is a plot of probabilities of true (target peak) detection versus false-positive (noise peak) detection for all thresholds over the range of SRP values from the 2 classes (target & noise). Given n 1 pixels from H 1, and n 0 pixels from H 0,The ROC area is estimated directly from the pixel amplitudes using the Wilcoxon statistic from [32]: n 1 n 0 A z = 1 C(S n 0 n k H0, S i H1 ) 1 k=1 l=1 where, n 0 and n 1 are number of target and noise pixels & the value of: (23a) C(S k,l H0, S i,l H1 ) = 1 for S k,l H0 < S i,l H1 0.5 for S k,l H0 = S i,l H1 0 for S k,l H0 > S i,l H1 (23b) 36
52 To remove the dependency of A z estimates calculated, the number of target and noise peaks considered were according to the ratio 1:8 (i.e. for every target detected, the 8 highest noise peaks in the FOV were considered for ROC analysis). This also doubles up as the worst case scenario as the 8 noise peaks selected will be the 8 highest peaks for that SRP image. Else, if all noise peaks were used, the low level noise peaks would result in very low false-positive ratio. This would in-turn cause higher A z values, giving a false impression of a high ROC area. To compute the 95% confidence limits for the ROC area for each case, the standard error statistic was calculated from the A z estimate [36]. σ SE A z 1 A z + n 0 1 Q a A z 2 + n 1 1 (Q 2 A z 2 ) n 0 n 1 (24a) where, Q 1 = A z 2 A z and Q 2 = 2A 2 z 1+A z (24b) The results obtained and the discussions are explained in the following chapter. 37
53 2 CHAPTER 4 3 Results and Discussion This chapter presents the experimental results and discusses the effect of β on a microphone array based SSL system performance for different test signals in the experimental setup discussed in Chapter 3. The results of β on SRP-PHAT images are presented in 4.1. The performance comparison between the area under ROC curve performance between the experiment and the simulations is presented in 4.2 along with similarities differences in ROC performance. 3.1 Results Figure 18 shows the SRP imaging results for a FOV containing a narrowband ( (a), (b), (c)) and broadband signal source ((d), (e), (f)). The actual source location is at the center of black circle in the Figures. The microphone positions are indicated by small red triangles in the images. Each image shows the relative strengths of the target and noise peaks for β = 0, 0.6, and 1. The results presented in Figure 18 are for low room reverberation levels. Consider the narrowband signal case (Figure 18 (a), (b), (c) ), strong noise peaks are observed at non-target positions (due to partial coherences) at β = 0. As β increases to 0.6, there is significant reduction in noise peak amplitude in non-target locations as the partial coherence is reduced and the dominant noise peaks loose strength. At the same time, there is also an increase in the density of low level, fine-grained, noise peaks as β approaches 1. This confirms the results from simulation results in [32] that targets having a narrow signal spectrum degrade from the PHAT more than the broadband signals, due to enhancement of relative spectral components outside the narrowband signal range which contributes to noise peaks in SRP image and corrupts the target peak. 38


 β=0.6-2 -2-1.5-1 -0.5 0 0.")
 β=1 (f) β=1 Figure 18: SRP")

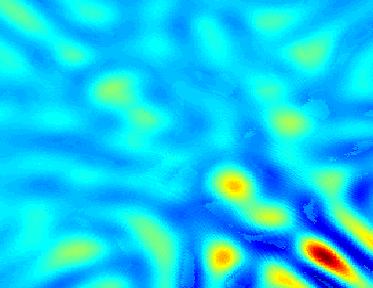
54 Meters Meters Meters Meters Meters Meters Narrowband Broadband Meters Meters (a) β=0 (d) β= Meters (b) β= Meters (e) β= Meters Meters (c) β=1 (f) β=1 Figure 18: SRP images for narrowband and broadband signals for β = 0, 0.6 & 1 39
arxiv: v1 [cs.sd] 4 Dec 2018
![arxiv: v1 [cs.sd] 4 Dec 2018](/thumbs/94/118561492.jpg "arxiv: v1 [cs.sd] 4 Dec 2018") LOCALIZATION AND TRACKING OF AN ACOUSTIC SOURCE USING A DIAGONAL UNLOADING BEAMFORMING AND A KALMAN FILTER Daniele Salvati, Carlo Drioli, Gian Luca Foresti Department of Mathematics, Computer Science and
LOCALIZATION AND TRACKING OF AN ACOUSTIC SOURCE USING A DIAGONAL UNLOADING BEAMFORMING AND A KALMAN FILTER Daniele Salvati, Carlo Drioli, Gian Luca Foresti Department of Mathematics, Computer Science and
EE 422G - Signals and Systems Laboratory
 EE 422G - Signals and Systems Laboratory Lab 3 FIR Filters Written by Kevin D. Donohue Department of Electrical and Computer Engineering University of Kentucky Lexington, KY 40506 September 19, 2015 Objectives:
Robust Low-Resource Sound Localization in Correlated Noise
 INTERSPEECH 2014 Robust Low-Resource Sound Localization in Correlated Noise Lorin Netsch, Jacek Stachurski Texas Instruments, Inc. netsch@ti.com, jacek@ti.com Abstract In this paper we address the problem
A MICROPHONE ARRAY INTERFACE FOR REAL-TIME INTERACTIVE MUSIC PERFORMANCE
 A MICROPHONE ARRA INTERFACE FOR REAL-TIME INTERACTIVE MUSIC PERFORMANCE Daniele Salvati AVIRES lab Dep. of Mathematics and Computer Science, University of Udine, Italy daniele.salvati@uniud.it Sergio Canazza
Automotive three-microphone voice activity detector and noise-canceller
 Res. Lett. Inf. Math. Sci., 005, Vol. 7, pp 47-55 47 Available online at http://iims.massey.ac.nz/research/letters/ Automotive three-microphone voice activity detector and noise-canceller Z. QI and T.J.MOIR
Airo Interantional Research Journal September, 2013 Volume II, ISSN:
 Airo Interantional Research Journal September, 2013 Volume II, ISSN: 2320-3714 Name of author- Navin Kumar Research scholar Department of Electronics BR Ambedkar Bihar University Muzaffarpur ABSTRACT Direction
Localization of underwater moving sound source based on time delay estimation using hydrophone array
 Journal of Physics: Conference Series PAPER OPEN ACCESS Localization of underwater moving sound source based on time delay estimation using hydrophone array To cite this article: S. A. Rahman et al 2016
Multiple Antenna Processing for WiMAX
 Multiple Antenna Processing for WiMAX Overview Wireless operators face a myriad of obstacles, but fundamental to the performance of any system are the propagation characteristics that restrict delivery
Chapter 4 Results. 4.1 Pattern recognition algorithm performance
 94 Chapter 4 Results 4.1 Pattern recognition algorithm performance The results of analyzing PERES data using the pattern recognition algorithm described in Chapter 3 are presented here in Chapter 4 to
FREQUENCY RESPONSE AND LATENCY OF MEMS MICROPHONES: THEORY AND PRACTICE
 APPLICATION NOTE AN22 FREQUENCY RESPONSE AND LATENCY OF MEMS MICROPHONES: THEORY AND PRACTICE This application note covers engineering details behind the latency of MEMS microphones. Major components of
MAKING TRANSIENT ANTENNA MEASUREMENTS
 MAKING TRANSIENT ANTENNA MEASUREMENTS Roger Dygert, Steven R. Nichols MI Technologies, 1125 Satellite Boulevard, Suite 100 Suwanee, GA 30024-4629 ABSTRACT In addition to steady state performance, antennas
Joint Position-Pitch Decomposition for Multi-Speaker Tracking
 Joint Position-Pitch Decomposition for Multi-Speaker Tracking SPSC Laboratory, TU Graz 1 Contents: 1. Microphone Arrays SPSC circular array Beamforming 2. Source Localization Direction of Arrival (DoA)
Study Of Sound Source Localization Using Music Method In Real Acoustic Environment
 International Journal of Electronics Engineering Research. ISSN 975-645 Volume 9, Number 4 (27) pp. 545-556 Research India Publications http://www.ripublication.com Study Of Sound Source Localization Using
Reducing comb filtering on different musical instruments using time delay estimation
 Reducing comb filtering on different musical instruments using time delay estimation Alice Clifford and Josh Reiss Queen Mary, University of London alice.clifford@eecs.qmul.ac.uk Abstract Comb filtering
Improving Meetings with Microphone Array Algorithms. Ivan Tashev Microsoft Research
 Improving Meetings with Microphone Array Algorithms Ivan Tashev Microsoft Research Why microphone arrays? They ensure better sound quality: less noises and reverberation Provide speaker position using
29th TONMEISTERTAGUNG VDT INTERNATIONAL CONVENTION, November 2016
 Measurement and Visualization of Room Impulse Responses with Spherical Microphone Arrays (Messung und Visualisierung von Raumimpulsantworten mit kugelförmigen Mikrofonarrays) Michael Kerscher 1, Benjamin
Reduction of Musical Residual Noise Using Harmonic- Adapted-Median Filter
 Reduction of Musical Residual Noise Using Harmonic- Adapted-Median Filter Ching-Ta Lu, Kun-Fu Tseng 2, Chih-Tsung Chen 2 Department of Information Communication, Asia University, Taichung, Taiwan, ROC
BEAMFORMING WITHIN THE MODAL SOUND FIELD OF A VEHICLE INTERIOR
 BeBeC-2016-S9 BEAMFORMING WITHIN THE MODAL SOUND FIELD OF A VEHICLE INTERIOR Clemens Nau Daimler AG Béla-Barényi-Straße 1, 71063 Sindelfingen, Germany ABSTRACT Physically the conventional beamforming method
Calibration of Microphone Arrays for Improved Speech Recognition
 MITSUBISHI ELECTRIC RESEARCH LABORATORIES http://www.merl.com Calibration of Microphone Arrays for Improved Speech Recognition Michael L. Seltzer, Bhiksha Raj TR-2001-43 December 2001 Abstract We present
Recent Advances in Acoustic Signal Extraction and Dereverberation
 Recent Advances in Acoustic Signal Extraction and Dereverberation Emanuël Habets Erlangen Colloquium 2016 Scenario Spatial Filtering Estimated Desired Signal Undesired sound components: Sensor noise Competing
ECE 476/ECE 501C/CS Wireless Communication Systems Winter Lecture 6: Fading
 ECE 476/ECE 501C/CS 513 - Wireless Communication Systems Winter 2005 Lecture 6: Fading Last lecture: Large scale propagation properties of wireless systems - slowly varying properties that depend primarily
ECE 476/ECE 501C/CS Wireless Communication Systems Winter Lecture 6: Fading
 ECE 476/ECE 501C/CS 513 - Wireless Communication Systems Winter 2004 Lecture 6: Fading Last lecture: Large scale propagation properties of wireless systems - slowly varying properties that depend primarily
VOL. 3, NO.11 Nov, 2012 ISSN Journal of Emerging Trends in Computing and Information Sciences CIS Journal. All rights reserved.
 Effect of Fading Correlation on the Performance of Spatial Multiplexed MIMO systems with circular antennas M. A. Mangoud Department of Electrical and Electronics Engineering, University of Bahrain P. O.
(i) Understanding the basic concepts of signal modeling, correlation, maximum likelihood estimation, least squares and iterative numerical methods
 Understanding the basic concepts of signal modeling, correlation, maximum likelihood estimation, least squares and iterative numerical methods") Tools and Applications Chapter Intended Learning Outcomes: (i) Understanding the basic concepts of signal modeling, correlation, maximum likelihood estimation, least squares and iterative numerical methods
Tools and Applications Chapter Intended Learning Outcomes: (i) Understanding the basic concepts of signal modeling, correlation, maximum likelihood estimation, least squares and iterative numerical methods
Auditory System For a Mobile Robot
 Auditory System For a Mobile Robot PhD Thesis Jean-Marc Valin Department of Electrical Engineering and Computer Engineering Université de Sherbrooke, Québec, Canada Jean-Marc.Valin@USherbrooke.ca Motivations
Speech and Audio Processing Recognition and Audio Effects Part 3: Beamforming
 Speech and Audio Processing Recognition and Audio Effects Part 3: Beamforming Gerhard Schmidt Christian-Albrechts-Universität zu Kiel Faculty of Engineering Electrical Engineering and Information Engineering
Sound Source Localization using HRTF database
 ICCAS June -, KINTEX, Gyeonggi-Do, Korea Sound Source Localization using HRTF database Sungmok Hwang*, Youngjin Park and Younsik Park * Center for Noise and Vibration Control, Dept. of Mech. Eng., KAIST,
Nonuniform multi level crossing for signal reconstruction
 6 Nonuniform multi level crossing for signal reconstruction 6.1 Introduction In recent years, there has been considerable interest in level crossing algorithms for sampling continuous time signals. Driven
Signal Processing for Digitizers
 Signal Processing for Digitizers Modular digitizers allow accurate, high resolution data acquisition that can be quickly transferred to a host computer. Signal processing functions, applied in the digitizer
ON WAVEFORM SELECTION IN A TIME VARYING SONAR ENVIRONMENT
 ON WAVEFORM SELECTION IN A TIME VARYING SONAR ENVIRONMENT Ashley I. Larsson 1* and Chris Gillard 1 (1) Maritime Operations Division, Defence Science and Technology Organisation, Edinburgh, Australia Abstract
Speech Enhancement in Presence of Noise using Spectral Subtraction and Wiener Filter
 Speech Enhancement in Presence of Noise using Spectral Subtraction and Wiener Filter 1 Gupteswar Sahu, 2 D. Arun Kumar, 3 M. Bala Krishna and 4 Jami Venkata Suman Assistant Professor, Department of ECE,
ADAPTIVE ANTENNAS. TYPES OF BEAMFORMING
 ADAPTIVE ANTENNAS TYPES OF BEAMFORMING 1 1- Outlines This chapter will introduce : Essential terminologies for beamforming; BF Demonstrating the function of the complex weights and how the phase and amplitude
ECE 476/ECE 501C/CS Wireless Communication Systems Winter Lecture 6: Fading
 ECE 476/ECE 501C/CS 513 - Wireless Communication Systems Winter 2003 Lecture 6: Fading Last lecture: Large scale propagation properties of wireless systems - slowly varying properties that depend primarily
Measurement System for Acoustic Absorption Using the Cepstrum Technique. Abstract. 1. Introduction
 The 00 International Congress and Exposition on Noise Control Engineering Dearborn, MI, USA. August 9-, 00 Measurement System for Acoustic Absorption Using the Cepstrum Technique E.R. Green Roush Industries
Sound Processing Technologies for Realistic Sensations in Teleworking
 Sound Processing Technologies for Realistic Sensations in Teleworking Takashi Yazu Makoto Morito In an office environment we usually acquire a large amount of information without any particular effort
VHF Radar Target Detection in the Presence of Clutter *
 BULGARIAN ACADEMY OF SCIENCES CYBERNETICS AND INFORMATION TECHNOLOGIES Volume 6, No 1 Sofia 2006 VHF Radar Target Detection in the Presence of Clutter * Boriana Vassileva Institute for Parallel Processing,
Module 1: Introduction to Experimental Techniques Lecture 2: Sources of error. The Lecture Contains: Sources of Error in Measurement
 The Lecture Contains: Sources of Error in Measurement Signal-To-Noise Ratio Analog-to-Digital Conversion of Measurement Data A/D Conversion Digitalization Errors due to A/D Conversion file:///g /optical_measurement/lecture2/2_1.htm[5/7/2012
Time and Frequency Domain Windowing of LFM Pulses Mark A. Richards
 Time and Frequency Domain Mark A. Richards September 29, 26 1 Frequency Domain Windowing of LFM Waveforms in Fundamentals of Radar Signal Processing Section 4.7.1 of [1] discusses the reduction of time
High-speed Noise Cancellation with Microphone Array
 Noise Cancellation a Posteriori Probability, Maximum Criteria Independent Component Analysis High-speed Noise Cancellation with Microphone Array We propose the use of a microphone array based on independent
EE 422G - Signals and Systems Laboratory
 EE 422G - Signals and Systems Laboratory Lab 5 Filter Applications Kevin D. Donohue Department of Electrical and Computer Engineering University of Kentucky Lexington, KY 40506 February 18, 2014 Objectives:
THOMAS PANY SOFTWARE RECEIVERS
 TECHNOLOGY AND APPLICATIONS SERIES THOMAS PANY SOFTWARE RECEIVERS Contents Preface Acknowledgments xiii xvii Chapter 1 Radio Navigation Signals 1 1.1 Signal Generation 1 1.2 Signal Propagation 2 1.3 Signal
Chapter 3. Source signals. 3.1 Full-range cross-correlation of time-domain signals
 Chapter 3 Source signals This chapter describes the time-domain cross-correlation used by the relative localisation system as well as the motivation behind the choice of maximum length sequences (MLS)
inter.noise 2000 The 29th International Congress and Exhibition on Noise Control Engineering August 2000, Nice, FRANCE
 Copyright SFA - InterNoise 2000 1 inter.noise 2000 The 29th International Congress and Exhibition on Noise Control Engineering 27-30 August 2000, Nice, FRANCE I-INCE Classification: 7.2 MICROPHONE ARRAY
SOUND FIELD MEASUREMENTS INSIDE A REVERBERANT ROOM BY MEANS OF A NEW 3D METHOD AND COMPARISON WITH FEM MODEL
 SOUND FIELD MEASUREMENTS INSIDE A REVERBERANT ROOM BY MEANS OF A NEW 3D METHOD AND COMPARISON WITH FEM MODEL P. Guidorzi a, F. Pompoli b, P. Bonfiglio b, M. Garai a a Department of Industrial Engineering
Structure of Speech. Physical acoustics Time-domain representation Frequency domain representation Sound shaping
 Structure of Speech Physical acoustics Time-domain representation Frequency domain representation Sound shaping Speech acoustics Source-Filter Theory Speech Source characteristics Speech Filter characteristics
EE390 Final Exam Fall Term 2002 Friday, December 13, 2002
 Name Page 1 of 11 EE390 Final Exam Fall Term 2002 Friday, December 13, 2002 Notes 1. This is a 2 hour exam, starting at 9:00 am and ending at 11:00 am. The exam is worth a total of 50 marks, broken down
A Soft-Limiting Receiver Structure for Time-Hopping UWB in Multiple Access Interference
 2006 IEEE Ninth International Symposium on Spread Spectrum Techniques and Applications A Soft-Limiting Receiver Structure for Time-Hopping UWB in Multiple Access Interference Norman C. Beaulieu, Fellow,
Advances in Direction-of-Arrival Estimation
 Advances in Direction-of-Arrival Estimation Sathish Chandran Editor ARTECH HOUSE BOSTON LONDON artechhouse.com Contents Preface xvii Acknowledgments xix Overview CHAPTER 1 Antenna Arrays for Direction-of-Arrival
Broadband Temporal Coherence Results From the June 2003 Panama City Coherence Experiments
 Broadband Temporal Coherence Results From the June 2003 Panama City Coherence Experiments H. Chandler*, E. Kennedy*, R. Meredith*, R. Goodman**, S. Stanic* *Code 7184, Naval Research Laboratory Stennis
Applying the Filtered Back-Projection Method to Extract Signal at Specific Position
 Applying the Filtered Back-Projection Method to Extract Signal at Specific Position 1 Chia-Ming Chang and Chun-Hao Peng Department of Computer Science and Engineering, Tatung University, Taipei, Taiwan
Acoustic Based Angle-Of-Arrival Estimation in the Presence of Interference
 Acoustic Based Angle-Of-Arrival Estimation in the Presence of Interference Abstract Before radar systems gained widespread use, passive sound-detection based systems were employed in Great Britain to detect
Long Range Acoustic Classification
 Approved for public release; distribution is unlimited. Long Range Acoustic Classification Authors: Ned B. Thammakhoune, Stephen W. Lang Sanders a Lockheed Martin Company P. O. Box 868 Nashua, New Hampshire
Broadband Microphone Arrays for Speech Acquisition
 Broadband Microphone Arrays for Speech Acquisition Darren B. Ward Acoustics and Speech Research Dept. Bell Labs, Lucent Technologies Murray Hill, NJ 07974, USA Robert C. Williamson Dept. of Engineering,
Lab 3.0. Pulse Shaping and Rayleigh Channel. Faculty of Information Engineering & Technology. The Communications Department
 Faculty of Information Engineering & Technology The Communications Department Course: Advanced Communication Lab [COMM 1005] Lab 3.0 Pulse Shaping and Rayleigh Channel 1 TABLE OF CONTENTS 2 Summary...
A Dissertation Presented for the Doctor of Philosophy Degree. The University of Memphis
 A NEW PROCEDURE FOR ESTIMATION OF SHEAR WAVE VELOCITY PROFILES USING MULTI STATION SPECTRAL ANALYSIS OF SURFACE WAVES, REGRESSION LINE SLOPE, AND GENETIC ALGORITHM METHODS A Dissertation Presented for
S.D.M COLLEGE OF ENGINEERING AND TECHNOLOGY
 VISHVESHWARAIAH TECHNOLOGICAL UNIVERSITY S.D.M COLLEGE OF ENGINEERING AND TECHNOLOGY A seminar report on Orthogonal Frequency Division Multiplexing (OFDM) Submitted by Sandeep Katakol 2SD06CS085 8th semester
Transfer Function (TRF)
") (TRF) Module of the KLIPPEL R&D SYSTEM S7 FEATURES Combines linear and nonlinear measurements Provides impulse response and energy-time curve (ETC) Measures linear transfer function and harmonic distortions
(TRF) Module of the KLIPPEL R&D SYSTEM S7 FEATURES Combines linear and nonlinear measurements Provides impulse response and energy-time curve (ETC) Measures linear transfer function and harmonic distortions
Antennas and Propagation. Chapter 6b: Path Models Rayleigh, Rician Fading, MIMO
 Antennas and Propagation b: Path Models Rayleigh, Rician Fading, MIMO Introduction From last lecture How do we model H p? Discrete path model (physical, plane waves) Random matrix models (forget H p and
Michael Brandstein Darren Ward (Eds.) Microphone Arrays. Signal Processing Techniques and Applications. With 149 Figures. Springer
 Microphone Arrays. Signal Processing Techniques and Applications. With 149 Figures. Springer") Michael Brandstein Darren Ward (Eds.) Microphone Arrays Signal Processing Techniques and Applications With 149 Figures Springer Contents Part I. Speech Enhancement 1 Constant Directivity Beamforming Darren
Michael Brandstein Darren Ward (Eds.) Microphone Arrays Signal Processing Techniques and Applications With 149 Figures Springer Contents Part I. Speech Enhancement 1 Constant Directivity Beamforming Darren
This tutorial describes the principles of 24-bit recording systems and clarifies some common mis-conceptions regarding these systems.
 This tutorial describes the principles of 24-bit recording systems and clarifies some common mis-conceptions regarding these systems. This is a general treatment of the subject and applies to I/O System
Improvement of signal to noise ratio by Group Array Stack of single sensor data
 P-113 Improvement of signal to noise ratio by Artatran Ojha *, K. Ramakrishna, G. Sarvesam Geophysical Services, ONGC, Chennai Summary Shot generated noise and the cultural noise is a major problem in
Characterization of a Very Shallow Water Acoustic Communication Channel MTS/IEEE OCEANS 09 Biloxi, MS
 Characterization of a Very Shallow Water Acoustic Communication Channel MTS/IEEE OCEANS 09 Biloxi, MS Brian Borowski Stevens Institute of Technology Departments of Computer Science and Electrical and Computer
REAL-TIME SRP-PHAT SOURCE LOCATION IMPLEMENTATIONS ON A LARGE-APERTURE MICROPHONE ARRAY
 REAL-TIME SRP-PHAT SOURCE LOCATION IMPLEMENTATIONS ON A LARGE-APERTURE MICROPHONE ARRAY by Hoang Tran Huy Do A THESIS SUBMITTED IN PARTIAL FULFILLMENT OF THE REQUIREMENTS FOR THE DEGREE OF MASTER OF SCIENCE
Analysis on Acoustic Attenuation by Periodic Array Structure EH KWEE DOE 1, WIN PA PA MYO 2
 www.semargroup.org, www.ijsetr.com ISSN 2319-8885 Vol.03,Issue.24 September-2014, Pages:4885-4889 Analysis on Acoustic Attenuation by Periodic Array Structure EH KWEE DOE 1, WIN PA PA MYO 2 1 Dept of Mechanical
Application Note 3PASS and its Application in Handset and Hands-Free Testing
 Application Note 3PASS and its Application in Handset and Hands-Free Testing HEAD acoustics Documentation This documentation is a copyrighted work by HEAD acoustics GmbH. The information and artwork in
3D Distortion Measurement (DIS)
") 3D Distortion Measurement (DIS) Module of the R&D SYSTEM S4 FEATURES Voltage and frequency sweep Steady-state measurement Single-tone or two-tone excitation signal DC-component, magnitude and phase of
3D Distortion Measurement (DIS) Module of the R&D SYSTEM S4 FEATURES Voltage and frequency sweep Steady-state measurement Single-tone or two-tone excitation signal DC-component, magnitude and phase of
Multiple Sound Sources Localization Using Energetic Analysis Method
 VOL.3, NO.4, DECEMBER 1 Multiple Sound Sources Localization Using Energetic Analysis Method Hasan Khaddour, Jiří Schimmel Department of Telecommunications FEEC, Brno University of Technology Purkyňova
DESIGN OF VOICE ALARM SYSTEMS FOR TRAFFIC TUNNELS: OPTIMISATION OF SPEECH INTELLIGIBILITY
 DESIGN OF VOICE ALARM SYSTEMS FOR TRAFFIC TUNNELS: OPTIMISATION OF SPEECH INTELLIGIBILITY Dr.ir. Evert Start Duran Audio BV, Zaltbommel, The Netherlands The design and optimisation of voice alarm (VA)
Speech Enhancement Based On Noise Reduction
 Speech Enhancement Based On Noise Reduction Kundan Kumar Singh Electrical Engineering Department University Of Rochester ksingh11@z.rochester.edu ABSTRACT This paper addresses the problem of signal distortion
Lab S-3: Beamforming with Phasors. N r k. is the time shift applied to r k
 DSP First, 2e Signal Processing First Lab S-3: Beamforming with Phasors Pre-Lab: Read the Pre-Lab and do all the exercises in the Pre-Lab section prior to attending lab. Verification: The Exercise section
6.555 Lab1: The Electrocardiogram
 6.555 Lab1: The Electrocardiogram Tony Hyun Kim Spring 11 1 Data acquisition Question 1: Draw a block diagram to illustrate how the data was acquired. The EKG signal discussed in this report was recorded
EE482: Digital Signal Processing Applications
 Professor Brendan Morris, SEB 3216, brendan.morris@unlv.edu EE482: Digital Signal Processing Applications Spring 2014 TTh 14:30-15:45 CBC C222 Lecture 12 Speech Signal Processing 14/03/25 http://www.ee.unlv.edu/~b1morris/ee482/
Exploitation of frequency information in Continuous Active Sonar
 PROCEEDINGS of the 22 nd International Congress on Acoustics Underwater Acoustics : ICA2016-446 Exploitation of frequency information in Continuous Active Sonar Lisa Zurk (a), Daniel Rouseff (b), Scott
Improving the Detection of Near Earth Objects for Ground Based Telescopes
 Improving the Detection of Near Earth Objects for Ground Based Telescopes Anthony O'Dell Captain, United States Air Force Air Force Research Laboratories ABSTRACT Congress has mandated the detection of
Encoding a Hidden Digital Signature onto an Audio Signal Using Psychoacoustic Masking
 The 7th International Conference on Signal Processing Applications & Technology, Boston MA, pp. 476-480, 7-10 October 1996. Encoding a Hidden Digital Signature onto an Audio Signal Using Psychoacoustic
Self Localization Using A Modulated Acoustic Chirp
 Self Localization Using A Modulated Acoustic Chirp Brian P. Flanagan The MITRE Corporation, 7515 Colshire Dr., McLean, VA 2212, USA; bflan@mitre.org ABSTRACT This paper describes a robust self localization
APPLICATION NOTE MAKING GOOD MEASUREMENTS LEARNING TO RECOGNIZE AND AVOID DISTORTION SOUNDSCAPES. by Langston Holland -
 SOUNDSCAPES AN-2 APPLICATION NOTE MAKING GOOD MEASUREMENTS LEARNING TO RECOGNIZE AND AVOID DISTORTION by Langston Holland - info@audiomatica.us INTRODUCTION The purpose of our measurements is to acquire
Department of Mechanical and Aerospace Engineering. MAE334 - Introduction to Instrumentation and Computers. Final Examination.
 Name: Number: Department of Mechanical and Aerospace Engineering MAE334 - Introduction to Instrumentation and Computers Final Examination December 12, 2002 Closed Book and Notes 1. Be sure to fill in your
EWGAE 2010 Vienna, 8th to 10th September
 EWGAE 2010 Vienna, 8th to 10th September Frequencies and Amplitudes of AE Signals in a Plate as a Function of Source Rise Time M. A. HAMSTAD University of Denver, Department of Mechanical and Materials
Mel Spectrum Analysis of Speech Recognition using Single Microphone
 International Journal of Engineering Research in Electronics and Communication Mel Spectrum Analysis of Speech Recognition using Single Microphone [1] Lakshmi S.A, [2] Cholavendan M [1] PG Scholar, Sree
Cooperative Sensing for Target Estimation and Target Localization
 Preliminary Exam May 09, 2011 Cooperative Sensing for Target Estimation and Target Localization Wenshu Zhang Advisor: Dr. Liuqing Yang Department of Electrical & Computer Engineering Colorado State University
ME scope Application Note 01 The FFT, Leakage, and Windowing
 INTRODUCTION ME scope Application Note 01 The FFT, Leakage, and Windowing NOTE: The steps in this Application Note can be duplicated using any Package that includes the VES-3600 Advanced Signal Processing
Low wavenumber reflectors
 Low wavenumber reflectors Low wavenumber reflectors John C. Bancroft ABSTRACT A numerical modelling environment was created to accurately evaluate reflections from a D interface that has a smooth transition
Chapter 5. Signal Analysis. 5.1 Denoising fiber optic sensor signal
 Chapter 5 Signal Analysis 5.1 Denoising fiber optic sensor signal We first perform wavelet-based denoising on fiber optic sensor signals. Examine the fiber optic signal data (see Appendix B). Across all
NSMRL Report JULY 2001
 Naval Submarine Medical Research Laboratory NSMRL Report 1221 02 JULY 2001 AN ALGORITHM FOR CALCULATING THE ESSENTIAL BANDWIDTH OF A DISCRETE SPECTRUM AND THE ESSENTIAL DURATION OF A DISCRETE TIME-SERIES
EFFECTS OF PHYSICAL CONFIGURATIONS ON ANC HEADPHONE PERFORMANCE
 EFFECTS OF PHYSICAL CONFIGURATIONS ON ANC HEADPHONE PERFORMANCE Lifu Wu Nanjing University of Information Science and Technology, School of Electronic & Information Engineering, CICAEET, Nanjing, 210044,
HIGH ORDER MODULATION SHAPED TO WORK WITH RADIO IMPERFECTIONS
 HIGH ORDER MODULATION SHAPED TO WORK WITH RADIO IMPERFECTIONS Karl Martin Gjertsen 1 Nera Networks AS, P.O. Box 79 N-52 Bergen, Norway ABSTRACT A novel layout of constellations has been conceived, promising
SEPTEMBER VOL. 38, NO. 9 ELECTRONIC DEFENSE SIMULTANEOUS SIGNAL ERRORS IN WIDEBAND IFM RECEIVERS WIDE, WIDER, WIDEST SYNTHETIC APERTURE ANTENNAS
 r SEPTEMBER VOL. 38, NO. 9 ELECTRONIC DEFENSE SIMULTANEOUS SIGNAL ERRORS IN WIDEBAND IFM RECEIVERS WIDE, WIDER, WIDEST SYNTHETIC APERTURE ANTENNAS CONTENTS, P. 10 TECHNICAL FEATURE SIMULTANEOUS SIGNAL
Different Approaches of Spectral Subtraction Method for Speech Enhancement
 ISSN 2249 5460 Available online at www.internationalejournals.com International ejournals International Journal of Mathematical Sciences, Technology and Humanities 95 (2013 1056 1062 Different Approaches
FIBER OPTICS. Prof. R.K. Shevgaonkar. Department of Electrical Engineering. Indian Institute of Technology, Bombay. Lecture: 37
 FIBER OPTICS Prof. R.K. Shevgaonkar Department of Electrical Engineering Indian Institute of Technology, Bombay Lecture: 37 Introduction to Raman Amplifiers Fiber Optics, Prof. R.K. Shevgaonkar, Dept.
Digitally controlled Active Noise Reduction with integrated Speech Communication
 Digitally controlled Active Noise Reduction with integrated Speech Communication Herman J.M. Steeneken and Jan Verhave TNO Human Factors, Soesterberg, The Netherlands herman@steeneken.com ABSTRACT Active
Downloaded 09/04/18 to Redistribution subject to SEG license or copyright; see Terms of Use at
 Processing of data with continuous source and receiver side wavefields - Real data examples Tilman Klüver* (PGS), Stian Hegna (PGS), and Jostein Lima (PGS) Summary In this paper, we describe the processing
Discrete-Time Signal Processing (DTSP) v14
 v14") EE 392 Laboratory 5-1 Discrete-Time Signal Processing (DTSP) v14 Safety - Voltages used here are less than 15 V and normally do not present a risk of shock. Objective: To study impulse response and the
EE 392 Laboratory 5-1 Discrete-Time Signal Processing (DTSP) v14 Safety - Voltages used here are less than 15 V and normally do not present a risk of shock. Objective: To study impulse response and the
Performance Evaluation of STBC-OFDM System for Wireless Communication
 Performance Evaluation of STBC-OFDM System for Wireless Communication Apeksha Deshmukh, Prof. Dr. M. D. Kokate Department of E&TC, K.K.W.I.E.R. College, Nasik, apeksha19may@gmail.com Abstract In this paper
Antennas and Propagation. Chapter 5c: Array Signal Processing and Parametric Estimation Techniques
 Antennas and Propagation : Array Signal Processing and Parametric Estimation Techniques Introduction Time-domain Signal Processing Fourier spectral analysis Identify important frequency-content of signal
Using Frequency Diversity to Improve Measurement Speed Roger Dygert MI Technologies, 1125 Satellite Blvd., Suite 100 Suwanee, GA 30024
 Using Frequency Diversity to Improve Measurement Speed Roger Dygert MI Technologies, 1125 Satellite Blvd., Suite 1 Suwanee, GA 324 ABSTRACT Conventional antenna measurement systems use a multiplexer or
Voice Activity Detection
 Voice Activity Detection Speech Processing Tom Bäckström Aalto University October 2015 Introduction Voice activity detection (VAD) (or speech activity detection, or speech detection) refers to a class
EET 223 RF COMMUNICATIONS LABORATORY EXPERIMENTS
 EET 223 RF COMMUNICATIONS LABORATORY EXPERIMENTS Experimental Goals A good technician needs to make accurate measurements, keep good records and know the proper usage and limitations of the instruments
ROOM SHAPE AND SIZE ESTIMATION USING DIRECTIONAL IMPULSE RESPONSE MEASUREMENTS
 ROOM SHAPE AND SIZE ESTIMATION USING DIRECTIONAL IMPULSE RESPONSE MEASUREMENTS PACS: 4.55 Br Gunel, Banu Sonic Arts Research Centre (SARC) School of Computer Science Queen s University Belfast Belfast,
Dr. Ali Muqaibel. Associate Professor. Electrical Engineering Department King Fahd University of Petroleum & Minerals Dhahran, Saudi Arabia
 By Associate Professor Electrical Engineering Department King Fahd University of Petroleum & Minerals Dhahran, Saudi Arabia Wednesday, December 1, 14 1 st Saudi Symposium for RADAR Technology 9 1 December