Data Acquisition (DAQ) Fundamentals
|
|
|
- Justin Powell
- 5 years ago
- Views:
Transcription
1 Flow Measurements Manometers Transducers Pitot tubes Thermocouples Hot wire systems a. Anemometers b. Probes - Simple - Slented - Cross-wire LDA (Laser Doppler Anemometry) PIV (Particle Image Velocimetry) Data Acquisition System

2 Data Acquisition (DAQ) Fundamentals Typical PC-Based DAQ System Personal computer Transducers Signal conditioning DAQ hardware Software
3 Data Acquisition (DAQ) Fundamentals Data acquisition involves gathering signals from measurement sources and digitizing the signal for storage, analysis, and presentation on a PC. Data acquisition (DAQ) systems come in many different PC technology forms for great flexibility when choosing your system. Scientists and engineers can choose from PCI (Peripheral Component Interconnect), PXI (PCI extensions for Instrumentation), PCI Express, PXI Express, PCMCIA, USB, Wireless and Ethernet data acquisition for test, measurement, and automation applications. PCI (Peripheral Component Interconnect) is an industry specification for connecting hardware devices to a computer's central processor There are five components to be considered when building a basic DAQ system : Transducers and sensors Signals Signal conditioning DAQ hardware Driver and application software (multiple programming environments, including NI LabVIEW, NI LabWindows /CVI, C/C++, Visual C#, and Visual Basic.NET)

4 PXI is the open, PC-based platform for test, measurement, and control PXI systems are composed of three basic components chassis, system controller, and peripheral modules Standard 8-Slot PXI Chassis Containing an Embedded System Controller and Seven Peripheral Modules


5 A typical DAQ system with National Instruments SCXI signal conditioning accessories An SCXI system consists of multichannel signal conditioning modules installed in one or more rugged chassis. You can choose from a wide selection of analog input, analog output, digital I/O, and switching modules to fit your application needs exactly
6 Transducers and sensors A transducer is a device that converts a physical phenomenon into a measurable electrical signal, such as voltage or current. The ability of a DAQ system to measure different phenomena depends on the transducers to convert the physical phenomena into signals measurable by the DAQ hardware. Phenomenon Temperature Light Sound Force and Pressure Position and Displacement Acceleration ph Transducer Thermocouple, RTD, Thermistor Photo Sensor Microphone Strain Gage Piezoelectric Transducer Potentiometer, LVDT, Optical Encoder Accelerometer ph Electrode
7 Signals The appropriate transducers convert physical phenomena into measurable signals. However, different signals need to be measured in different ways. For this reason, it is important to understand the different types of signals and their corresponding attributes. Signals can be categorized into two groups: Analog Digital

8 Analog Signals An analog signal can be at any value with respect to time. A few examples of analog signals include voltage, temperature, pressure, sound, and load. The three primary characteristics of an analog signal include level, shape, and frequency Because analog signals can take on any value, level gives vital information about the measured analog signal. The intensity of a light source, the temperature in a room, and the pressure inside a chamber are all examples that demonstrate the importance of the level of a signal. Primary Characteristics of an Analog Signal
.")
9 Digital Signals A digital signal cannot take on any value with respect to time. Instead, a digital signal has two possible levels: high and low. Digital signals generally conform to certain specifications that define characteristics of the signal. Digital signals are commonly referred to as transistor-to-transistor logic (TTL). TTL specifications indicate a digital signal to be low when the level falls within to.8 V, and the signal is high between 2 to 5 V. The useful information that can be measured from a digital signal includes the state (on or off, high or low ) and the rate of a digital how the digital signal changes state with respect to time
10
11 Signal Conditioning Sometimes transducers generate signals too difficult or too dangerous to measure directly with a DAQ device. For instance, when dealing with high voltages, noisy environments, extreme high and low signals, or simultaneous signal measurement, signal conditioning is essential for an effective DAQ system. Signal conditioning maximizes the accuracy of a system, allows sensors to operate properly, and guarantees safety. Signal conditioning accessories can be used in a variety of applications including: Amplification Attenuation Isolation (The system being monitored may contain high-voltage transients that could damage the computer without signal conditioning) Bridge completion Simultaneous sampling Sensor excitation Multiplexing (A common technique for measuring several signals with a single measuring device is multiplexing.)
12
13 Signal conditioning

14 Example for Need of Amplifiers Amplification The most common type of signal conditioning is amplification. Low-level thermocouple signals, for example, should be amplified to increase the resolution and reduce noise. For the highest possible accuracy, the signal should be amplified so that the maximum voltage range of the conditioned signal equals the maximum input range of the A/D Converter.

15 DAQ Hardware DAQ hardware acts as the interface between the computer and the outside world. It primarily functions as a device that digitizes incoming analog signals so that the computer can interpret them. Other data acquisition functionality includes: Analog Input/Output Digital Input/Output Counter/Timers Multifunction - a combination of analog, digital, and counter operations on a single device NI Wi-Fi Data Acquisition
16 Computer Address CPU Central Processing Unit Data Control Sampled Analog Input Signal A/D Converter 1111 Digital Output B bits/sample Input Device Keyboard Disk A/D Converter Buss Memory Digital Output Output Device Computer CRT monitors Printer Disk D/A Converter 1 Full Scale 1/2 LSB Analog Input Ref: LSB: least significant bit


17 =2 3 Full scale voltage range R=8V

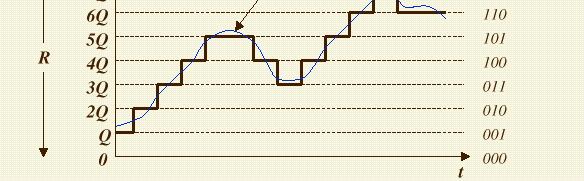
18 A/D converter
19 Dynamic Response of Measurement Systems
20 A static measurement of a physical quantity is performed when the quantity is not changing in time. The deflection of a beam under a constant load would be a static deflection. However, if the beam were set in vibration, the deflection would vary with time (dynamic measurement).
21 Zeroth-, First- and Second-Order Systems: A system may be described in terms of a general variable x(t) written in differential equation form as: where F(t) is some forcing function imposed on the system. The order of the system is designed by the order of the differential equation. A zeroth-order system would be governed by:
22 A first-order system is governed by: A second-order system is governed by:
23 The zeroth order system indicates that the system variable x(t) will follow the input forcing function F(t) instantly by some constant value: The constant 1/a is called the static sensitivity of the system.
24 The first order system may be expressed as: The τ= a 1 /a has the dimension of time and is usually called the time constant of the system.
25 For step input : F(t)= at t= F(t)=A for t> Along with the initial condition x=x at t= The solution to the first order system is: where Steady state response (call x ) Transient response of the system The same solution can be written in dimensionless forms as:
26 The rise time is the time required to achieve a response of 9 percent of the step input. This requires: or t= 2.33 τ
27
28 Input signal examples: x(t) x(t-t ) Unit step function (Heaviside function) Shifted unit step function
29 . Input signal examples: Impulse function (Dirac delta function)
30 Dynamic Response of Measurement Systems Zero Order System: y = Kx(t)
31 First Order System τ + y = Kx(t) Step response - First Order System Amplitude τ =.5 Dynamic Response of Measurement Systems τ = 1 τ = 2 dy dt t / τ y = Kx(1 e ) Impulse response y = Kx First Order System t /τ Amplitude τ =.5 τ = 1 τ = 2 e t /τ t /τ
32 Dynamic Response of Measurement Systems First Order System Sinusoidal Response x Input = x sin( ωt) y = Φ = ω τ tan Kx 1 Output ( ωτ ) sin( ωt + Φ) amplitude Amplitude Decrease and Phase Shift Sinusoidal Response - First Order System Input Output time Gain db Phase deg ωτ ωτ Bode Plot
33 Dynamic Response of Measurement Systems 2 d y dy 2 + 2ζω ω 2 n + n y = dt dt ω - natural frequency n Second Order System ζ - damping factor systems 2 Kω x( t) ζ = 1- critical damping - no oscillations ζ =.7 - for fastest response 5% overshoot System comes to 5% of static value n Amplit tude in half the time for critically damped Step response - Second Order System ω t n
34 Second Order System - Sinusoidal Response = + + = = tan ) sin( 2 1 ) sin( n n n n t KX y t X x ω ω ω ω ζ φ φ ω ω ω ζ ω ω ω Amplitude Dynamic Response of Measurement Systems ω /ω n Phase (deg) Amplitude (db)
35 Dynamic Response of Measurement Systems Second Order System - Impulse Response y = Kx e sin( 1 ζ + ζωn t 2 ωn φ t ) 1 Impulse response - Second Order System Amplitude time
36 Filters Amplitude Ratio Amplitude Ratio F re q ue nc y (H z) Low Pass Filter Removes High Frequency Noise F re q ue nc y (H z) High Pass Filter Removes DC and Low Frequency Noise (Such as 6, 12 Hz) Amplitude Ratio Amplitude Ratio F re q ue nc y (H z) Band Pass F re q ue nc y (H z) Band Stop
37

38 Example: MUSIC Basically, the equalizer in your stereo is nothing more than a set of band pass filters in parallel. Each filter has a different frequency band that it controls. The equalizer is used to balance the signal over different frequencies to shape the noise (music) amplitude frequency Dr. Peter Avitabile University of Massachusetts Lowell
39 The instrument that is used to make measurements will have some very definite frequency characteristics. This defines the usable frequency range of the instrument. As part of the lab and measurements taken, there was a different usable frequency range for the oscilloscope and the digital multimeter amplitude amplitude frequency frequency Dr. Peter Avitabile University of Massachusetts Lowell

40 amplitude amplitude frequency frequency Dr. Peter Avitabile University of Massachusetts Lowell
41 In addition to instruments, the actual transducers used to make measurements also have useful frequency ranges. For instance, a strain gage accelerometer and a peizoelectric accelerometer have different useful frequency ranges amplitude amplitude frequency frequency Dr. Peter Avitabile University of Massachusetts Lowell
42 Low Pass Filter Examples Magnitude.6.4 Magnitude.6.4 Magnitude Frequency Elliptic Filter Frequency Bessel Filter Frequency Butterworth Magnitude.6.4 Magnitude Frequency Chebyshev I Filter Frequency Chebyshev II
43 Example Signal Fs = 1; t = :1/Fs:1; x =.5+ sin(2*pi*t*5)+.25*sin(2*pi*t*4); % DC plus 5 Hz signal and 4 Hz signal sampled at 1 Hz for 1 sec DC Level Amplitude (volts) Total Signal Low Frequency Signal High Frequency Time (sec)
44 Amplitude Ratio Cheby2 Low Pass Recovers DC + 3Hz Amplitude (volts) Original Signal Filter Filtfilt Frequency (Hz) T i m e ( s e c ) Amplitude Ratio Cheby2 High Pass Recovers 4 Hz Amplitude (volts) Frequency (Hz) T i m e ( s e c ) 2 Amplitude Ratio Cheby2 Band Pass Recovers 3Hz Amplitude (volts) Frequency (Hz) T i m e ( s e c ) Amplitude Ratio Cheby2 Stop Band Recovers DC + 4Hz Amplitude (volts) Frequency (Hz) T i m e ( s e c )
45 Measurement Error The basis for the uncertainty model lies in the nature of measurement error. We view error as the difference between what we see and what is truth. Measured value True value (bias error) Measurement error
46 Measurement Error Accuracy Measure of how close the result of the experiment comes to the true value Precision Measure of how exactly the result is determined without reference to the true value
47 Measurement Error Bias Error To determine the magnitude of bias in a given measurement situation, we must define the true value of the quantity being measured. Sometimes this error is correctable by calibration. To determine the magnitude of bias in a given measurement situation, we must define the true value of the quantity being measured. This true value is usually unknown. Random Error Random error is seen in repeated measurements. The measurements do not agree exactly; we do not expect them to. There are always numerous small effects which cause disagreements. This random error between repeated measurements is called precision error. We use the standard deviation as a measure of precision error.
48 Measurement Error Bias Error Systematic Error Remains Constant During Test Estimated Based On Calibration or judgement Precision ( Random Error ) Precision Index - Estimate of Standard Deviation A statistic, s, is calculated from data to estimate the precision error and is called the precision index s = N 1 ( x i x) N 1 2 True Value Bias Error β Average of measured values Total Error δ i δ i = β + ε i x x i Measured Value Random Error ε = i x i x
49 We may categorize bias into five classes : o large known biases, o small known biases, o large unknown biases and o small unknown biases that may have unknown sign (±) or known sign. The large known biases are eliminated by comparing the instrument to a standard instrument and obtaining a correction. This process is called calibration. Small known biases may or may not be corrected depending on the difficulty of the correction and the magnitude of the bias. The unknown biases, are not correctable. That is, we know that they may exist but we do not know the sign or magnitude of the bias. Five types of bias errors
50 Every effort must be made to eliminate all large unknown biases. The introduction of such errors converts the controlled measurement process into an uncontrolled worthless effort. Large unknown biases usually come from human errors in data processing, incorrect handling and installation of instrumentation, and unexpected environmental disturbances such as shock and bad flow profiles. We must assume that in a well controlled measurement process there are no large unknown biases. To ensure that a controlled measurement process exists, all measurements should he monitored with statistical quality control charts.
51 True Value Measurement Error True Value Precise, Accurate (Unbiased) Precise, Inaccurate (Biased) Imprecise, Accurate (Unbiased) Imprecise, Inaccurate (Biased)
52 ACCURACY AND PRECISION Instrument Readings True Value Accurate & precise Inaccurate but precise Imprecise but accurate Inaccurate & imprecise
53 Normal Distribution ( Gaussian or Bell Curve ) The normal distribution is a two parameter family of curves. The first parameter, µ, is the mean. The second, σ, is the standard deviation. The usual justification for using the normal distribution for modeling is the Central Limit Theorem which states (roughly) that the sum of independent samples from any distribution with finite mean and variance converges to the normal distribution as the sample size goes to infinity. The normal pdf ( probability density function) is: y = σ ( x µ ) 1 2 2σ e 2π Normal Distribution normalized so that the area under the curve = 1. Y sigma, σ Mean, µ X
54 Parameter Estimation A desirable criterion in a statistical estimator is unbiasedness. A statistic is unbiased if the expected value of the statistic is equal to the parameter being estimated. Unbiased estimators of the parameters, µ, the mean, and σ, the standard deviation are: N xi Estimation of mean, µ x = 1 N [ mean(data) ] s = N 1 ( x i x) N 1 2 Estimation of standard deviation, σ [ std(data) ] N: number of data measured
55 Data Sample Signal from Hot Wire in a Turbulent Boundary Layer Output from an A/D Converter (in counts) at Equal Time Intervals Long Time Record Short Time Record Amplitude Time
56 Estimate of the Probability Density Function [ hist(data,# of bins) ] Similar to a Gaussian curve Amplitude (data measured)
57 COMMON SENSE ERROR ANALYSIS Examine the data for consistent. No matter how hard one tries, there will always be some data points that appear to be grossly in error. The data should follow common sense consistency, and points that do not appear "proper" should be eliminated. If very many data points fall in the category of "inconsistent" perhaps the entire experimental procedure should be investigated for gross mistakes or miscalculations. Perform a statistical analysis of data where appropriate. A statistical analysis is only appropriate when measurements are repeated several times. If this is the case, make estimates of such parameters as standard deviation, etc. Estimate the uncertainties in the results. These calculations must have been performed in advance so that the investigator will already know the influence of different variables by the time the final results are obtained. Anticipate the results from theory. Before trying to obtain correlations of the experimental data, the investigator should carefully review the theory appropriate to the subject and try to think some information that will indicate the trends the results may take. Important dimensionless groups, pertinent functional relations, and other information may lead to a fruitful interpretation of the data. Correlate the data. The experimental investigator should make sense of the data in terms of physical theories or on the basis of previous experimental work in the field. Certainly, the results of the experiments should be analyzed to show how they conform to or differ from previous investigations or standards that may be employed for such measurements. (Ref. Holman, J. P., Experimental Methods for Engineers")
Transducers Signal conditioning DAQ hardware Software
 Flow Measurements Manometers Transducers Pitot tubes Thermocouples Hot wire systems a. Anemometers b. Probes -Simple - Slented - Cross-wire LDA (Laser Doppler Anemometry) PIV (Particle Image Velocimetry)
ni.com Sensor Measurement Fundamentals Series
 Sensor Measurement Fundamentals Series Introduction to Data Acquisition Basics and Terminology Litkei Márton District Sales Manager National Instruments What Is Data Acquisition (DAQ)? 3 Why Measure? Engineers
Developer Techniques Sessions
 1 Developer Techniques Sessions Physical Measurements and Signal Processing Control Systems Logging and Networking 2 Abstract This session covers the technologies and configuration of a physical measurement
MAE334 - Introduction to Instrumentation and Computers. Final Exam. December 11, 2006
 MAE334 - Introduction to Instrumentation and Computers Final Exam December 11, 2006 o Closed Book and Notes o No Calculators 1. Fill in your name on side 2 of the scoring sheet (Last name first!) 2. Fill
Measurement & Control of energy systems. Teppo Myllys National Instruments
 Measurement & Control of energy systems Teppo Myllys National Instruments National Instruments Direct operations in over 50 Countries More than 1,000 products, 7000+ employees, and 700 Alliance Program
Department of Mechanical and Aerospace Engineering. MAE334 - Introduction to Instrumentation and Computers. Final Examination.
 Name: Number: Department of Mechanical and Aerospace Engineering MAE334 - Introduction to Instrumentation and Computers Final Examination December 12, 2002 Closed Book and Notes 1. Be sure to fill in your
Instrumentation (ch. 4 in Lecture notes)
") TMR7 Experimental methods in Marine Hydrodynamics week 35 Instrumentation (ch. 4 in Lecture notes) Measurement systems short introduction Measurement using strain gauges Calibration Data acquisition Different
TMR7 Experimental methods in Marine Hydrodynamics week 35 Instrumentation (ch. 4 in Lecture notes) Measurement systems short introduction Measurement using strain gauges Calibration Data acquisition Different
Department of Mechanical and Aerospace Engineering. MAE334 - Introduction to Instrumentation and Computers. Final Examination.
 Name: Number: Department of Mechanical and Aerospace Engineering MAE334 - Introduction to Instrumentation and Computers Final Examination December 12, 2003 Closed Book and Notes 1. Be sure to fill in your
CHAPTER 6 INTRODUCTION TO SYSTEM IDENTIFICATION
 CHAPTER 6 INTRODUCTION TO SYSTEM IDENTIFICATION Broadly speaking, system identification is the art and science of using measurements obtained from a system to characterize the system. The characterization
Introduction to NI LabVIEW and Computer-Based Measurements. Elias Nicolas Applications Engineer National Instruments
 Introduction to NI LabVIEW and Computer-Based Measurements Elias Nicolas Applications Engineer National Instruments Today, We ll Explore: The Challenges of Making Measurements Introduction to LabVIEW Fundamentals
PC Digital Data Acquisition
 ME 22.302 Mechanical Lab I PC Digital Data Acquisition Dr. Peter Avitabile University of Massachusetts Lowell Digital Data Acquisition 122601-1 Copyright 2001 A general computer data acquisition configuration
MEASUREMENT AND INSTRUMENTATION QUESTION BANK UNIT I INTRODUCTION. Part A
 MEASUREMENT AND INSTRUMENTATION QUESTION BANK UNIT I INTRODUCTION Part A 1. Define Standard deviation. 2. Why calibration of instrument is important? 3. What are the different calibration methodologies?
Module 1: Introduction to Experimental Techniques Lecture 2: Sources of error. The Lecture Contains: Sources of Error in Measurement
 The Lecture Contains: Sources of Error in Measurement Signal-To-Noise Ratio Analog-to-Digital Conversion of Measurement Data A/D Conversion Digitalization Errors due to A/D Conversion file:///g /optical_measurement/lecture2/2_1.htm[5/7/2012
MECE 3320 Measurements & Instrumentation. Data Acquisition
 MECE 3320 Measurements & Instrumentation Data Acquisition Dr. Isaac Choutapalli Department of Mechanical Engineering University of Texas Pan American Sampling Concepts 1 f s t Sampling Rate f s 2 f m or
Introduction to Measurement Systems
 MFE 3004 Mechatronics I Measurement Systems Dr Conrad Pace Page 4.1 Introduction to Measurement Systems Role of Measurement Systems Detection receive an external stimulus (ex. Displacement) Selection measurement
Signal Conditioning Fundamentals for PC-Based Data Acquisition Systems
 Application Note 048 Signal Conditioning Fundamentals for PC-Based Data Acquisition Systems Introduction PC-based data acquisition (DAQ) systems and plugin boards are used in a very wide range of applications
EKT 314/4 LABORATORIES SHEET
 EKT 314/4 LABORATORIES SHEET WEEK DAY HOUR 4 1 2 PREPARED BY: EN. MUHAMAD ASMI BIN ROMLI EN. MOHD FISOL BIN OSMAN JULY 2009 Creating a Typical Measurement Application 5 This chapter introduces you to common
USB Dynamic Signal Acquisition
 NI USB-9233 24-bit resolution 102 db dynamic range 50 ks/s max rate per channel 4 simultaneous analog inputs ±5 V input range AC coupled with IEPE power Hi-Speed USB 2.0 Recommended Software LabVIEW LabVIEW
Data acquisition and instrumentation. Data acquisition
 Data acquisition and instrumentation START Lecture Sam Sadeghi Data acquisition 1 Humanistic Intelligence Body as a transducer,, data acquisition and signal processing machine Analysis of physiological
Lab 12 Laboratory 12 Data Acquisition Required Special Equipment: 12.1 Objectives 12.2 Introduction 12.3 A/D basics
 Laboratory 12 Data Acquisition Required Special Equipment: Computer with LabView Software National Instruments USB 6009 Data Acquisition Card 12.1 Objectives This lab demonstrates the basic principals
Table of Contents...2. About the Tutorial...6. Audience...6. Prerequisites...6. Copyright & Disclaimer EMI INTRODUCTION Voltmeter...
 1 Table of Contents Table of Contents...2 About the Tutorial...6 Audience...6 Prerequisites...6 Copyright & Disclaimer...6 1. EMI INTRODUCTION... 7 Voltmeter...7 Ammeter...8 Ohmmeter...8 Multimeter...9
ME 365 FINAL EXAM. Monday, April 29, :30 pm-5:30 pm LILY Problem Score
 Name: SOLUTION Section: 8:30_Chang 11:30_Meckl ME 365 FINAL EXAM Monday, April 29, 2013 3:30 pm-5:30 pm LILY 1105 Problem Score Problem Score Problem Score Problem Score Problem Score 1 5 9 13 17 2 6 10
Strain Gauge Measurement A Tutorial
 Application Note 078 Strain Gauge Measurement A Tutorial What is Strain? Strain is the amount of deformation of a body due to an applied force. More specifically, strain (ε) is defined as the fractional
ELG3336 Design of Mechatronics System
 ELG3336 Design of Mechatronics System Elements of a Data Acquisition System 2 Analog Signal Data Acquisition Hardware Your Signal Data Acquisition DAQ Device System Computer Cable Terminal Block Data Acquisition
Electronic Instrumentation and Measurements
 Electronic Instrumentation and Measurements A fundamental part of many electromechanical systems is a measurement system that composed of four basic parts: Sensors Signal Conditioning Analog-to-Digital-Conversion
CHAPTER 7 HARDWARE IMPLEMENTATION
 168 CHAPTER 7 HARDWARE IMPLEMENTATION 7.1 OVERVIEW In the previous chapters discussed about the design and simulation of Discrete controller for ZVS Buck, Interleaved Boost, Buck-Boost, Double Frequency
Lab 2A: Introduction to Sensing and Data Acquisition
 Lab 2A: Introduction to Sensing and Data Acquisition Prof. R.G. Longoria Department of Mechanical Engineering The University of Texas at Austin June 12, 2014 1 Lab 2A 2 Sensors 3 DAQ 4 Experimentation
SCXI 8-Channel Isolated Analog Input Modules
 SCXI 8-Channel Isolated Analog Input NI, NI SCXI-1120, NI SCXI-1120D 8 channels 333 ks/s maximum sampling rate Gain and lowpass filter settings per channel Up to 300 V rms working isolation per channel
Question Paper Code : B.E./B.Tech. DEGREE EXAMINATION, NOVEMBER/DECEMBER Third Semester. Electrical and Electronics Engineering
 Question Paper Code : 31391 B.E./B.Tech. DEGREE EXAMINATION, NOVEMBER/DECEMBER 2013. Third Semester Electrical and Electronics Engineering EE 2201/EE 33/EI 1202/10133 EE 302/080280016 MEASUREMENTS AND
Notes on Noise Reduction
 Notes on Noise Reduction When setting out to make a measurement one often finds that the signal, the quantity we want to see, is masked by noise, which is anything that interferes with seeing the signal.
Correction for Synchronization Errors in Dynamic Measurements
 Correction for Synchronization Errors in Dynamic Measurements Vasishta Ganguly and Tony L. Schmitz Department of Mechanical Engineering and Engineering Science University of North Carolina at Charlotte
USE OF BASIC ELECTRONIC MEASURING INSTRUMENTS Part II, & ANALYSIS OF MEASUREMENT ERROR 1
 EE 241 Experiment #3: USE OF BASIC ELECTRONIC MEASURING INSTRUMENTS Part II, & ANALYSIS OF MEASUREMENT ERROR 1 PURPOSE: To become familiar with additional the instruments in the laboratory. To become aware
IMAC 27 - Orlando, FL Shaker Excitation
 IMAC 27 - Orlando, FL - 2009 Peter Avitabile UMASS Lowell Marco Peres The Modal Shop 1 Dr. Peter Avitabile Objectives of this lecture: Overview some shaker excitation techniques commonly employed in modal
Measurement, Sensors, and Data Acquisition in the Two-Can System
 Measurement, Sensors, and Data Acquisition in the Two-Can System Prof. R.G. Longoria Updated Fall 2010 Goal of this week s lab Gain familiarity with using sensors Gain familiarity with using DAQ hardware
Lab 11. Speed Control of a D.C. motor. Motor Characterization
 Lab 11. Speed Control of a D.C. motor Motor Characterization Motor Speed Control Project 1. Generate PWM waveform 2. Amplify the waveform to drive the motor 3. Measure motor speed 4. Estimate motor parameters
Applications area and advantages of the capillary waves method
 Applications area and advantages of the capillary waves method Surface waves at the liquid-gas interface (mainly capillary waves) provide a convenient probe of the bulk and surface properties of liquids.
Analog Signal Conditioning Accessories
 NI 64-channel multiplexer mv, V, current, and thermocouple inputs NI 8-channel simultaneous sample-and-hold mv, V inputs NI SC-2042-RTD 8-channel RTD/thermistor RTD, thermistor, mv, V inputs NI 8-channel
IN Branch GATE Paper 1999 SECTION A
 SECTION A 1. This question contains 30 sub-questions of multiple choice type. Each sub-question has only one correct answer. 1.1 is (A) 0 (B) 1.1 (C) 0.5 (D) 1 1.2. For the waveform V(t)=2+cos (ωt+ ) the
Module 3: Velocity Measurement Lecture 13: Two wire hotwire measurement. The Lecture Contains: Hotwire Anemometry. Electromagnetic Actuator
 The Lecture Contains: Hotwire Anemometry Hotwire Probes CTA Bridge and Accessories Data Acquisition System Electromagnetic Actuator Auxiliary Instruments Digital Micromanometer Digital Multimeter Spectrum
LabVIEW Based Instrumentation and Experimental Methods Course
 Session 2259 LabVIEW Based Instrumentation and Experimental Methods Course Chi-Wook Lee Department of Mechanical Engineering University of the Pacific Stockton, CA 95211 Abstract Instrumentation and Experimental
VCSO Mechanical Shock Compensation
 VCSO Mechanical Shock Compensation Who are we? Team members: Max Madore Joseph Hiltz-Maher Shaun Hew Shalin Shah Advisor: Helena Silva Phonon contact: Scott Kraft Project Overview VCSO and mechanical vibration
GATE 2019 ONLINE TEST SERIES
 GATE 29 ONLINE TEST SERIES Compete with the be... Our proficient faculties have done extensive research to prepare and shape these te series. An opportunity for udents to come across their rengths and
Measurement Techniques
 Measurement Techniques Anders Sjöström Juan Negreira Montero Department of Construction Sciences. Division of Engineering Acoustics. Lund University Disposition Introduction Errors in Measurements Signals
Analogue Interfacing. What is a signal? Continuous vs. Discrete Time. Continuous time signals
 Analogue Interfacing What is a signal? Signal: Function of one or more independent variable(s) such as space or time Examples include images and speech Continuous vs. Discrete Time Continuous time signals
Chapter 7. Introduction. Analog Signal and Discrete Time Series. Sampling, Digital Devices, and Data Acquisition
 Chapter 7 Sampling, Digital Devices, and Data Acquisition Material from Theory and Design for Mechanical Measurements; Figliola, Third Edition Introduction Integrating analog electrical transducers with
Chapter 2 Analog-to-Digital Conversion...
 Chapter... 5 This chapter examines general considerations for analog-to-digital converter (ADC) measurements. Discussed are the four basic ADC types, providing a general description of each while comparing
EKT 314/4 LABORATORIES SHEET
 EKT 314/4 LABORATORIES SHEET WEEK DAY HOUR 4 2 1 PREPARED BY: EN. MUHAMAD ASMI BIN ROMLI EN. MOHD FISOL BIN OSMAN JULY 2009 Measuring Strain 10 This chapter describes how to measure strain using DAQ devices
Measurement and Instrumentation
 Measurement and Instrumentation Theory and Application Alan S. Morris Reza Langari ELSEVIER AMSTERDAM BOSTON HEIDELBERG LONDON NEW YORK OXFORD PARIS SAN DIEGO SAN FRANCISCO SINGAPORE SYDNEY TOKYO Academic
Filters And Waveform Shaping
 Physics 3330 Experiment #3 Fall 2001 Purpose Filters And Waveform Shaping The aim of this experiment is to study the frequency filtering properties of passive (R, C, and L) circuits for sine waves, and
sin(wt) y(t) Exciter Vibrating armature ENME599 1
 y(t) Exciter Vibrating armature ENME599 1") ENME599 1 LAB #3: Kinematic Excitation (Forced Vibration) of a SDOF system Students must read the laboratory instruction manual prior to the lab session. The lab report must be submitted in the beginning
ENME599 1 LAB #3: Kinematic Excitation (Forced Vibration) of a SDOF system Students must read the laboratory instruction manual prior to the lab session. The lab report must be submitted in the beginning
PC-based controller for Mechatronics System
 Course Code: MDP 454, Course Name:, Second Semester 2014 PC-based controller for Mechatronics System Mechanical System PC Controller Controller in the Mechatronics System Configuration Actuators Power
Response spectrum Time history Power Spectral Density, PSD
 A description is given of one way to implement an earthquake test where the test severities are specified by time histories. The test is done by using a biaxial computer aided servohydraulic test rig.
Common-source Amplifiers
 Lab 1: Common-source Amplifiers Introduction The common-source amplifier is one of the basic amplifiers in CMOS analog circuits. Because of its very high input impedance, relatively high gain, low noise,
Mechatronics. Analog and Digital Electronics: Studio Exercises 1 & 2
 Mechatronics Analog and Digital Electronics: Studio Exercises 1 & 2 There is an electronics revolution taking place in the industrialized world. Electronics pervades all activities. Perhaps the most important
Let`s get SIRIUS! SIRIUS Overview. SIRIUS from Dewesoft. SIRIUS Overview. The new hardware generation makes your measurement more precise!
 SIRIUS Overview NEW dual ADC SIRIUS Overview Let`s get SIRIUS! The new hardware generation makes your measurement more precise! Dual core Input SIRIUS from Dewesoft This new technology solves the often
Common-Source Amplifiers
 Lab 2: Common-Source Amplifiers Introduction The common-source stage is the most basic amplifier stage encountered in CMOS analog circuits. Because of its very high input impedance, moderate-to-high gain,
AERO2705 Space Engineering 1 Week 7 The University of Sydney
 AERO2705 Space Engineering 1 Week 7 The University of Sydney Presenter Mr. Warwick Holmes Executive Director Space Engineering School of Aerospace, Mechanical and Mechatronic Engineering The University
B.E. Sem.VII [ETRX] Basics of VLSI
![B.E. Sem.VII [ETRX] Basics of VLSI](/thumbs/87/95047122.jpg "B.E. Sem.VII [ETRX] Basics of VLSI") B.E. Sem.VII [ETRX] Basics of VLSI 1. Physics of FET NMOS, PMOS, enhancement and depletion mode transistor, MOSFET, threshold voltage, flatband condition, threshold adjustment, linear and saturated operation,
B.E. Sem.VII [ETRX] Basics of VLSI 1. Physics of FET NMOS, PMOS, enhancement and depletion mode transistor, MOSFET, threshold voltage, flatband condition, threshold adjustment, linear and saturated operation,
5. Transducers Definition and General Concept of Transducer Classification of Transducers
 5.1. Definition and General Concept of Definition The transducer is a device which converts one form of energy into another form. Examples: Mechanical transducer and Electrical transducer Electrical A
UPSC Electrical Engineering Syllabus
 UPSC Electrical Engineering Syllabus UPSC Electrical Engineering Syllabus PAPER I 1. Circuit Theory: Circuit components; network graphs; KCL, KVL; circuit analysis methods: nodal analysis, mesh analysis;
Analog to Digital Converters
 Analog to Digital Converters By: Byron Johns, Danny Carpenter Stephanie Pohl, Harry Bo Marr http://ume.gatech.edu/mechatronics_course/fadc_f05.ppt (unless otherwise marked) Presentation Outline Introduction:
Data Acquisition Boards and USB-DAQ
 Data Acquisition Boards and USB-DAQ CHRISTIAN ANTFOLK Announcement Choose a project Project description deadline 26.11.2017 (you can start working on the project before that) Lab 2 will be Wednesday den
4 Things to Consider When Using a DAQ as a Data Logger
 4 Things to Consider When Using a DAQ as a Data Logger Introduction There is a growing trend across all industries to design feature-rich products. The more features added to a product, the more complex
Jitter in Digital Communication Systems, Part 1
 Application Note: HFAN-4.0.3 Rev.; 04/08 Jitter in Digital Communication Systems, Part [Some parts of this application note first appeared in Electronic Engineering Times on August 27, 200, Issue 8.] AVAILABLE
Electronic Measurements & Instrumentation UNIT What are the basic performance characteristics of a system?
 UNIT-1 1. What are the basic performance characteristics of a system? Ans: STATIC CHARACTE RISTICS The static characteristics of an instrument are, in general, considered for instruments which are used
SHOCK AND VIBRATION RESPONSE SPECTRA COURSE Unit 4. Random Vibration Characteristics. By Tom Irvine
 SHOCK AND VIBRATION RESPONSE SPECTRA COURSE Unit 4. Random Vibration Characteristics By Tom Irvine Introduction Random Forcing Function and Response Consider a turbulent airflow passing over an aircraft
Data Acquisition and Signal Conditioning
 Data Acquisition and Signal Conditioning Course Manual Course Software Version 7.0 August 2003 Edition Part Number 320733K-01 Data Acquisition and Signal Conditioning Copyright 1995 2003 National Instruments
Part 2: Second order systems: cantilever response
 - cantilever response slide 1 Part 2: Second order systems: cantilever response Goals: Understand the behavior and how to characterize second order measurement systems Learn how to operate: function generator,
Microprocessors & Interfacing
 Lecture overview Microprocessors & Interfacing /Output output PMW Digital-to- (D/A) Conversion input -to-digital (A/D) Conversion Lecturer : Dr. Annie Guo S2, 2008 COMP9032 Week9 1 S2, 2008 COMP9032 Week9
MEP 382: Design of Applied Measurement Systems Lecture 4: Digital Logic, Computer, Signals & Systems Basics
 Faculty of Engineering MEP 382: Design of Applied Measurement Systems Lecture 4: Digital Logic, Computer, Signals & Systems Basics Outline (1) Digital Logic Combinatorial Circuits Computer Basics definitions
UNIT III Data Acquisition & Microcontroller System. Mr. Manoj Rajale
 UNIT III Data Acquisition & Microcontroller System Mr. Manoj Rajale Syllabus Interfacing of Sensors / Actuators to DAQ system, Bit width, Sampling theorem, Sampling Frequency, Aliasing, Sample and hold
ACCURACY JUNGLE TRUE OR FALSE?
 1 ACCURACY JUNGLE TRUE OR FALSE? Steve Pellarin and Albert Berdugo Teletronics Technology Corporation Newtown, PA USA Abstract Today s advanced vehicles demand high performance data acquisition systems
Sensors and Actuators Introduction to sensors
 Sensors and Actuators Introduction to sensors Sander Stuijk (s.stuijk@tue.nl) Department of Electrical Engineering Electronic Systems INDUCTIVE SENSORS (Chapter 3.4, 7.3) 3 Inductive sensors 4 Inductive
Intermediate and Advanced Labs PHY3802L/PHY4822L
 Intermediate and Advanced Labs PHY3802L/PHY4822L Torsional Oscillator and Torque Magnetometry Lab manual and related literature The torsional oscillator and torque magnetometry 1. Purpose Study the torsional
Electronics II. Calibration and Curve Fitting
 Objective Find components on Digikey Electronics II Calibration and Curve Fitting Determine the parameters for a sensor from the data sheets Predict the voltage vs. temperature relationship for a thermistor
VT1419A Multifunctional Plus Measurement and Control Module
 VT1419A Multifunctional Plus Measurement and Control Module VXI Technology Comprehensive signal conditioning on board Wide choice of Input/Output signal types Powerful control capability On-board data
24-Bit, ks/s Dynamic Signal Acquisition and Generation
 NI 4461, NI 4462 2 or 4 simultaneously sampled analog inputs 2 simultaneously updated analog outputs (NI 4461 only) 118 db dynamic range, 24-bit resolution 204.8 ks/s maximum sampling rate 92 khz alias-free
Analog Input and Output. Lecturer: Sri Parameswaran Notes by: Annie Guo
 Analog Input and Output Lecturer: Sri Parameswaran Notes by: Annie Guo 1 Analog output Lecture overview PMW Digital-to-Analog (D/A) Conversion Analog input Analog-to-Digital (A/D) Conversion 2 PWM Analog
EDS-400A COMPACT RECORDER. New KYOWA ELECTRONIC INSTRUMENTS CO., LTD.
 KYOWA ELECTRONIC INSTRUMENTS CO., LTD. COMPACT RECORDER EDS-400A Compact Dynamic Strain Recorder Entering the scene in advanced measurement of strain, vibration, pressure, load, etc. New www.kyowa-ei.co.jp
Chapter 30: Principles of Active Vibration Control: Piezoelectric Accelerometers
 Chapter 30: Principles of Active Vibration Control: Piezoelectric Accelerometers Introduction: Active vibration control is defined as a technique in which the vibration of a structure is reduced or controlled
STRAIN, FORCE, PRESSURE, AND FLOW MEASUREMENTS
 SECTION 4 STRAIN,, PRESSURE, AND FLOW MEASUREMENTS Walt Kester STRAIN GAGES The most popular electrical elements used in force measurements include the resistance strain gage, the semiconductor strain
IT.MLD900 SENSORS AND TRANSDUCERS TRAINER. Signal Conditioning
 SENSORS AND TRANSDUCERS TRAINER IT.MLD900 The s and Instrumentation Trainer introduces students to input sensors, output actuators, signal conditioning circuits, and display devices through a wide range
EXPERIMENT 12 PHYSICS 250 TRANSDUCERS: TIME RESPONSE
 EXPERIMENT 12 PHYSICS 250 TRANSDUCERS: TIME RESPONSE Apparatus: Signal generator Oscilloscope Digital multimeter Microphone Photocell Hall Probe Force transducer Force generator Speaker Light sources Calibration
Downloaded from Downloaded from
 IV SEMESTER FINAL EXAMINATION- 2002 SUBJECT: BEG232EC, Instrumentation Candidates are required to give their answers in their own words as far as practicable. The figure in the margin indicates full marks.
1. Introduction. 2. Concept. reflector. transduce r. node. Kraftmessung an verschiedenen Fluiden in akustischen Feldern
 1. Introduction The aim of this Praktikum is to familiarize with the concept and the equipment of acoustic levitation and to measure the forces exerted by an acoustic field on small spherical objects.
ET 438B Sequential Digital Control and Data Acquisition Laboratory 4 Analog Measurement and Digital Control Integration Using LabVIEW
 ET 438B Sequential Digital Control and Data Acquisition Laboratory 4 Analog Measurement and Digital Control Integration Using LabVIEW Laboratory Learning Objectives 1. Identify the data acquisition card
Basic Electronics Learning by doing Prof. T.S. Natarajan Department of Physics Indian Institute of Technology, Madras
 Basic Electronics Learning by doing Prof. T.S. Natarajan Department of Physics Indian Institute of Technology, Madras Lecture 26 Mathematical operations Hello everybody! In our series of lectures on basic
Introduction. ELCT903, Sensor Technology Electronics and Electrical Engineering Department 1. Dr.-Eng. Hisham El-Sherif
 Introduction In automation industry every mechatronic system has some sensors to measure the status of the process variables. The analogy between the human controlled system and a computer controlled system
CS545 Contents XIV. Components of a Robotic System. Signal Processing. Reading Assignment for Next Class
 CS545 Contents XIV Components of a Robotic System Power Supplies and Power Amplifiers Actuators Transmission Sensors Signal Processing Linear filtering Simple filtering Optimal filtering Reading Assignment
Question Bank SENSORS AND INSTRUMENTATION [EE-305/405]
![Question Bank SENSORS AND INSTRUMENTATION [EE-305/405]](/thumbs/95/124646158.jpg "Question Bank SENSORS AND INSTRUMENTATION [EE-305/405]") UNIT-1 1. Discuss liquid in glass thermometers? 2. Write a short note on strain gauges. 3. Mention the various temperature scales and relation between them. 4. An experiment is conducted to calibrate a
UNIT-1 1. Discuss liquid in glass thermometers? 2. Write a short note on strain gauges. 3. Mention the various temperature scales and relation between them. 4. An experiment is conducted to calibrate a
2.5 GHz 75 Ω Multiplexer and SPDT Relay Switches
 2.5 GHz Multiplexer and SPDT Relay Switches NI PXI-255x NEW! 2.5 GHz bandwidth characteristic impedance 30 V max switching voltage 0.5 A max switching current 10 W max switching power Mini SMB direct connectivity
Experiment 8 Frequency Response
 Experiment 8 Frequency Response W.T. Yeung, R.A. Cortina, and R.T. Howe UC Berkeley EE 105 Spring 2005 1.0 Objective This lab will introduce the student to frequency response of circuits. The student will
MEMORY RECORDER/ANALYZER
 NEW MEMORY RECORDER/ANALYZER By the Specialist in Stress Measurement All-in-one All-purpose Instrument From Measurement to Monitoring, Recording and Processing The EDX-2000A is a general-purpose, expandable
GATE 2009 Instrumentation Engineering
 GATE 2009 Instrumentation Engineering Q. Q20 carry one mark each.. If z = x jy, where x and y are real, the value of e is (A) (C) e (B) e x y (D) e 2. The value of origin, is (A) 0 (B) 2πj dz, where the
Measuring Temperature with an RTD or Thermistor
 Application Note 046 Measuring Temperature with an RTD or Thermistor What Is Temperature? Qualitatively, the temperature of an object determines the sensation of warmth or coldness felt by touching it.
Chapter 1 Introduction
 Chapter 1 Introduction 1 Chapter 1. Introduction Basic Architecture for an Electronic/Optoelectronic Instrumentation Measurement System. Definitions. Sensors and Categories of Sensor by Input Mechanisms
RX1032 PRECISION TEMPERATURE MEASUREMENTS FOR RUGGED ENVIRONMENTS FEATURES. 32-Channel Thermocouple Measurement System
 WWW.VTIINSTRUMENTS.COM RX1032 PRECISION TEMPERATURE MEASUREMENTS FOR RUGGED ENVIRONMENTS FEATURES 32-Channel Thermocouple Measurement System Advanced CJC Implementation 1000 Sample/sec/channel Scan Rate
II Year (04 Semester) EE6403 Discrete Time Systems and Signal Processing
 EE6403 Discrete Time Systems and Signal Processing") Class Subject Code Subject II Year (04 Semester) EE6403 Discrete Time Systems and Signal Processing 1.CONTENT LIST: Introduction to Unit I - Signals and Systems 2. SKILLS ADDRESSED: Listening 3. OBJECTIVE
Class Subject Code Subject II Year (04 Semester) EE6403 Discrete Time Systems and Signal Processing 1.CONTENT LIST: Introduction to Unit I - Signals and Systems 2. SKILLS ADDRESSED: Listening 3. OBJECTIVE
Lab 9 AC FILTERS AND RESONANCE
 151 Name Date Partners ab 9 A FITES AND ESONANE OBJETIES OEIEW To understand the design of capacitive and inductive filters To understand resonance in circuits driven by A signals In a previous lab, you
Loop Design. Chapter Introduction
 Chapter 8 Loop Design 8.1 Introduction This is the first Chapter that deals with design and we will therefore start by some general aspects on design of engineering systems. Design is complicated because