Optimal Narrow Spectral Bands for Precision Weed Detection in Agricultural Fields using Hyperspectral Remote Sensing
|
|
|
- Clement Evans
- 5 years ago
- Views:
Transcription


1 Optimal Narrow Spectral Bands for Precision Weed Detection in Agricultural Fields using Hyperspectral Remote Sensing Sam Tittle Seminar Presentation 11/17/2016 Committee Rick Lawrence Kevin Repasky Bruce Maxwell
2 Outline Precision Weed spraying How it works Monitoring Current Technology Spectral Profiles Wide vs Narrow Bands Sensors Multi vs Hyperspectral Research Goals Methods Expected Results

3 Precision Weed Spraying Sensor activates solenoid Only Weeds are sprayed

4 Precision Weed Spraying Cost reduction to producers Environmental Benefits Less runoff of herbicides Built in weed monitoring

5 Monitoring Integration of GPS with sprayer can create a weed map. Allows year to year comparison Weed population dynamics Feedback on the management effectiveness

6 Current Technology Systems exist and are in use Examples WeedSeeker and WEEDit Most use active sensors


7 Issues System effective in fallow, preplant spraying, post-harvest weed control Hard to differentiate between crop and weed

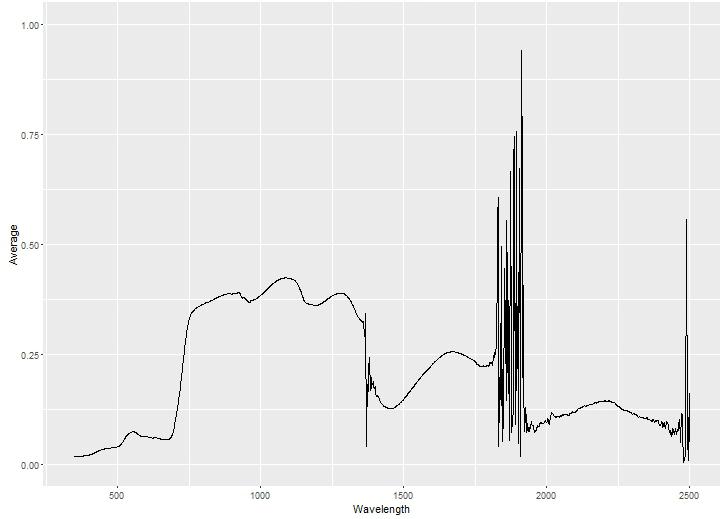
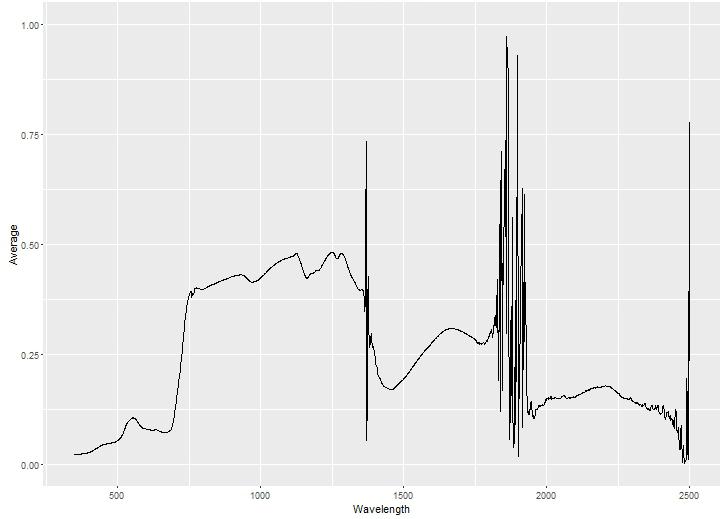
8 Spectral Profiles Wheat Profile SWIR Atmosheric H 2 O Red Edge Visible NIR Green Bump
9 Spectral Profiles Similar spectral Wheat profiles Distinct differences Green Weed IR Red Edge?


10 Narrow and Wide Bands Wide Bands Can limit differentiation of similar signatures Multispectral sensors Narrow Bands Gain high spectral resolution Hyperspectral sensors
11 Sensor Differences Multispectral Wide bands (20nm-100nm) Different regions of spectrum Hyperspectral Narrow bands (2nm-10nm) Continues across spectrum
12 MultiSpec Vs Hyperspectral ASD 2151 Channels Pika II 80 Bands Landsat 8 Multispectral Bands for comparison

13 MultiSpec Vs Hyperspectral Vegetation curve derived form Landsat 8 Multispectral Bands
14 Sensors Current hyperspectral sensors cannot feasibly be mounted to tractors Cost Large Data sets Sensor/computer pay load Solution Fly with current hyperspectral technology and apply findings to on-tractor designs Use hand held sensor for ancillary data


15 Sensors Pika II Arial platform ~0.5m pixels Hyperspectral 80 channels 424nm - 929nm ASD Back pack mounted FOV 2m Hyperspectral 2151 channels 350 nm nm


16 Optimal Band Selection Reduced data Wheat processing time Can apply it to future technology Weed
17 Distance Metrics in Spectral Separability Point a single point on the spectral curve Spectral response for a band on one axis Band 2 Measurable Distance
18 Distance Metrics in Spectral Separability Each band adds a dimension
 2")

19 Distance Metrics in Spectral Separability For multiple bands this can get very complicated Different metrics to quantify these distances Euclidean DD = nn (dd ee ) 2 ii=1 ii ii Divergence Based on means and covariance Transformed Divergence Scaled version of divergence Jefferies-Matusita Mean, covariance, and natural log

20 Goals Identify portions of the electromagnetic spectrum to identify weeds in dryland wheat. Analytical methods can be applied to other cropping/weed systems.
21 Questions Can narrow spectral band combinations identify weeds in situ, given the variability of plants? How many bands necessary? Compare band combinations across multiply classification techniques Can a set of narrow bands be widened and still accurately identify weeds? Wider bands can cut cost of sensors or filters.


22 Methods: Data Collection Tarps Solution to roll, pitch, yaw Used for Atmospheric correction Field Data Azimuth, weed type, patch size, etc. GPS Tarp and weed patch center


23 Methods: Processing Swaths Georectified Combined Using Tarps and Using GCP Mat Lab by To usable Cooper file format McCann for analysis Exported False color IR Hyperspectral Image of wheat field
24 Methods: Analysis Extracted and combined spectral data from infested and un-infested locations Used 4 spatial distance metrics Used 11 classification techniques Compared using kappa statistic and McNemar s test

25 Statistics Kappa z-test Kappa measures agreement taking into account random chance of correct classification Popular in the literature but though by some to be undesirable McNemar s Test Uses 2x2 matrix Null states same proportion of pixels will be correctly classified by method 1 and method 2 Found to work with smaller samples than kappa
26 Expected Outcomes Answer to, does it work? Wider bands, cost efficient work Method that can be applied to other crop/weed systems Commercial collaborators can apply findings and methods to adapt sensors regionally Dead weeds
27 Special Thanks Rick Lawrence Kevin Repasky Bruce Maxwell Cooper McCann Joe Shaw - MREDI Optics & Photonics PI Tax payers of Montana State legislators Questions??
Lecture Notes Prepared by Prof. J. Francis Spring Remote Sensing Instruments
 Lecture Notes Prepared by Prof. J. Francis Spring 2005 Remote Sensing Instruments Material from Remote Sensing Instrumentation in Weather Satellites: Systems, Data, and Environmental Applications by Rao,
Valuable New Information for Precision Agriculture. Mike Ritter Founder & CEO - SLANTRANGE, Inc.
 Valuable New Information for Precision Agriculture Mike Ritter Founder & CEO - SLANTRANGE, Inc. SENSORS Accurate, Platform- Agnostic ANALYTICS On-Board, On-Location SLANTRANGE Delivering Valuable New Information
Photonic-based spectral reflectance sensor for ground-based plant detection and weed discrimination
 Research Online ECU Publications Pre. 211 28 Photonic-based spectral reflectance sensor for ground-based plant detection and weed discrimination Arie Paap Sreten Askraba Kamal Alameh John Rowe 1.1364/OE.16.151
Textbook, Chapter 15 Textbook, Chapter 10 (only 10.6)
") AGOG 484/584/ APLN 551 Fall 2018 Concept definition Applications Instruments and platforms Techniques to process hyperspectral data A problem of mixed pixels and spectral unmixing Reading Textbook, Chapter
AGOG 484/584/ APLN 551 Fall 2018 Concept definition Applications Instruments and platforms Techniques to process hyperspectral data A problem of mixed pixels and spectral unmixing Reading Textbook, Chapter
An NDVI image provides critical crop information that is not visible in an RGB or NIR image of the same scene. For example, plants may appear green
 Normalized Difference Vegetation Index (NDVI) Spectral Band calculation that uses the visible (RGB) and near-infrared (NIR) bands of the electromagnetic spectrum NDVI= + An NDVI image provides critical
REMOTE SENSING. Topic 10 Fundamentals of Digital Multispectral Remote Sensing MULTISPECTRAL SCANNERS MULTISPECTRAL SCANNERS
 REMOTE SENSING Topic 10 Fundamentals of Digital Multispectral Remote Sensing Chapter 5: Lillesand and Keifer Chapter 6: Avery and Berlin MULTISPECTRAL SCANNERS Record EMR in a number of discrete portions
Ground Truth for Calibrating Optical Imagery to Reflectance
 Visual Information Solutions Ground Truth for Calibrating Optical Imagery to Reflectance The by: Thomas Harris Whitepaper Introduction: Atmospheric Effects on Optical Imagery Remote sensing of the Earth
Evaluation of Sentinel-2 bands over the spectrum
 Evaluation of Sentinel-2 bands over the spectrum S.E. Hosseini Aria, M. Menenti, Geoscience and Remote sensing Department Delft University of Technology, Netherlands 1 outline ointroduction - Concept odata
Spatially Resolved Backscatter Ceilometer
 Spatially Resolved Backscatter Ceilometer Design Team Hiba Fareed, Nicholas Paradiso, Evan Perillo, Michael Tahan Design Advisor Prof. Gregory Kowalski Sponsor, Spectral Sciences Inc. Steve Richstmeier,
This week we will work with your Landsat images and classify them using supervised classification.
 GEPL 4500/5500 Lab 4: Supervised Classification: Part I: Selecting Training Sets Due: 4/6/04 This week we will work with your Landsat images and classify them using supervised classification. There are
Enhancement of Multispectral Images and Vegetation Indices
 Enhancement of Multispectral Images and Vegetation Indices ERDAS Imagine 2016 Description: We will use ERDAS Imagine with multispectral images to learn how an image can be enhanced for better interpretation.
746A27 Remote Sensing and GIS. Multi spectral, thermal and hyper spectral sensing and usage
 746A27 Remote Sensing and GIS Lecture 3 Multi spectral, thermal and hyper spectral sensing and usage Chandan Roy Guest Lecturer Department of Computer and Information Science Linköping University Multi
Remote Sensing. The following figure is grey scale display of SPOT Panchromatic without stretching.
 Remote Sensing Objectives This unit will briefly explain display of remote sensing image, geometric correction, spatial enhancement, spectral enhancement and classification of remote sensing image. At
Remote Sensing. in Agriculture. Dr. Baqer Ramadhan CRP 514 Geographic Information System. Adel M. Al-Rebh G Term Paper.
 Remote Sensing in Agriculture Term Paper to Dr. Baqer Ramadhan CRP 514 Geographic Information System By Adel M. Al-Rebh G199325390 May 2012 Table of Contents 1.0 Introduction... 4 2.0 Objective... 4 3.0
Land Cover Analysis to Determine Areas of Clear-cut and Forest Cover in Olney, Montana. Geob 373 Remote Sensing. Dr Andreas Varhola, Kathry De Rego
 1 Land Cover Analysis to Determine Areas of Clear-cut and Forest Cover in Olney, Montana Geob 373 Remote Sensing Dr Andreas Varhola, Kathry De Rego Zhu an Lim (14292149) L2B 17 Apr 2016 2 Abstract Montana
Hyperspectral image processing and analysis
 Hyperspectral image processing and analysis Lecture 12 www.utsa.edu/lrsg/teaching/ees5083/l12-hyper.ppt Multi- vs. Hyper- Hyper-: Narrow bands ( 20 nm in resolution or FWHM) and continuous measurements.
APCAS/10/21 April 2010 ASIA AND PACIFIC COMMISSION ON AGRICULTURAL STATISTICS TWENTY-THIRD SESSION. Siem Reap, Cambodia, April 2010
 APCAS/10/21 April 2010 Agenda Item 8 ASIA AND PACIFIC COMMISSION ON AGRICULTURAL STATISTICS TWENTY-THIRD SESSION Siem Reap, Cambodia, 26-30 April 2010 The Use of Remote Sensing for Area Estimation by Robert
Introduction to Remote Sensing Fundamentals of Satellite Remote Sensing. Mads Olander Rasmussen
 Introduction to Remote Sensing Fundamentals of Satellite Remote Sensing Mads Olander Rasmussen (mora@dhi-gras.com) 01. Introduction to Remote Sensing DHI What is remote sensing? the art, science, and technology
CORN BEST MANAGEMENT PRACTICES CHAPTER 22. Matching Remote Sensing to Problems
 CORN BEST MANAGEMENT PRACTICES CHAPTER 22 USDA photo by Regis Lefebure Matching Remote Sensing to Problems Jiyul Chang (Jiyul.Chang@sdstate.edu) and David Clay (David.Clay@sdstate.edu) Remote sensing can
Introduction to Remote Sensing
 Introduction to Remote Sensing Dr. Mathias (Mat) Disney UCL Geography Office: 301, 3rd Floor, Chandler House Tel: 7670 4290 Email: mdisney@ucl.geog.ac.uk www.geog.ucl.ac.uk/~mdisney 1 Course outline Format
Image transformations
 Image transformations Digital Numbers may be composed of three elements: Atmospheric interference (e.g. haze) ATCOR Illumination (angle of reflection) - transforms Albedo (surface cover) Image transformations
Interpreting land surface features. SWAC module 3
 Interpreting land surface features SWAC module 3 Interpreting land surface features SWAC module 3 Different kinds of image Panchromatic image True-color image False-color image EMR : NASA Echo the bat
The Hyperspectral UAV (HyUAV) a novel UAV-based spectroscopy tool for environmental monitoring
 a novel UAV-based spectroscopy tool for environmental monitoring") The Hyperspectral UAV (HyUAV) a novel UAV-based spectroscopy tool for environmental monitoring R. Garzonio 1, S. Cogliati 1, B. Di Mauro 1, A. Zanin 2, B. Tattarletti 2, F. Zacchello 2, P. Marras 2 and
The Hyperspectral UAV (HyUAV) a novel UAV-based spectroscopy tool for environmental monitoring R. Garzonio 1, S. Cogliati 1, B. Di Mauro 1, A. Zanin 2, B. Tattarletti 2, F. Zacchello 2, P. Marras 2 and
Satellite Imagery and Remote Sensing. DeeDee Whitaker SW Guilford High EES & Chemistry
 Satellite Imagery and Remote Sensing DeeDee Whitaker SW Guilford High EES & Chemistry whitakd@gcsnc.com Outline What is remote sensing? How does remote sensing work? What role does the electromagnetic
Basic Hyperspectral Analysis Tutorial
 Basic Hyperspectral Analysis Tutorial This tutorial introduces you to visualization and interactive analysis tools for working with hyperspectral data. In this tutorial, you will: Analyze spectral profiles
Background Adaptive Band Selection in a Fixed Filter System
 Background Adaptive Band Selection in a Fixed Filter System Frank J. Crosby, Harold Suiter Naval Surface Warfare Center, Coastal Systems Station, Panama City, FL 32407 ABSTRACT An automated band selection
An Introduction to Geomatics. Prepared by: Dr. Maher A. El-Hallaq خاص بطلبة مساق مقدمة في علم. Associate Professor of Surveying IUG
 An Introduction to Geomatics خاص بطلبة مساق مقدمة في علم الجيوماتكس Prepared by: Dr. Maher A. El-Hallaq Associate Professor of Surveying IUG 1 Airborne Imagery Dr. Maher A. El-Hallaq Associate Professor
Remote Sensing. Odyssey 7 Jun 2012 Benjamin Post
 Remote Sensing Odyssey 7 Jun 2012 Benjamin Post Definitions Applications Physics Image Processing Classifiers Ancillary Data Data Sources Related Concepts Outline Big Picture Definitions Remote Sensing
An Introduction to Remote Sensing & GIS. Introduction
 An Introduction to Remote Sensing & GIS Introduction Remote sensing is the measurement of object properties on Earth s surface using data acquired from aircraft and satellites. It attempts to measure something
EnMAP Environmental Mapping and Analysis Program
 EnMAP Environmental Mapping and Analysis Program www.enmap.org Mathias Schneider Mission Objectives Regular provision of high-quality calibrated hyperspectral data Precise measurement of ecosystem parameters
Plant Health Monitoring System Using Raspberry Pi
 Volume 119 No. 15 2018, 955-959 ISSN: 1314-3395 (on-line version) url: http://www.acadpubl.eu/hub/ http://www.acadpubl.eu/hub/ 1 Plant Health Monitoring System Using Raspberry Pi Jyotirmayee Dashᵃ *, Shubhangi
IMPROVEMENT IN THE DETECTION OF LAND COVER CLASSES USING THE WORLDVIEW-2 IMAGERY
 IMPROVEMENT IN THE DETECTION OF LAND COVER CLASSES USING THE WORLDVIEW-2 IMAGERY Ahmed Elsharkawy 1,2, Mohamed Elhabiby 1,3 & Naser El-Sheimy 1,4 1 Dept. of Geomatics Engineering, University of Calgary
Module 3 Introduction to GIS. Lecture 8 GIS data acquisition
 Module 3 Introduction to GIS Lecture 8 GIS data acquisition GIS workflow Data acquisition (geospatial data input) GPS Remote sensing (satellites, UAV s) LiDAR Digitized maps Attribute Data Management Data
CHARACTERISTICS OF REMOTELY SENSED IMAGERY. Radiometric Resolution
 CHARACTERISTICS OF REMOTELY SENSED IMAGERY Radiometric Resolution There are a number of ways in which images can differ. One set of important differences relate to the various resolutions that images express.
What is Remote Sensing? Contents. Image Fusion in Remote Sensing. 1. Optical imagery in remote sensing. Electromagnetic Spectrum
 Contents Image Fusion in Remote Sensing Optical imagery in remote sensing Image fusion in remote sensing New development on image fusion Linhai Jing Applications Feb. 17, 2011 2 1. Optical imagery in remote
Introduction to Remote Sensing
 Introduction to Remote Sensing Daniel McInerney Urban Institute Ireland, University College Dublin, Richview Campus, Clonskeagh Drive, Dublin 14. 16th June 2009 Presentation Outline 1 2 Spaceborne Sensors
High Resolution Multi-spectral Imagery
 High Resolution Multi-spectral Imagery Jim Baily, AirAgronomics AIRAGRONOMICS Having been involved in broadacre agriculture until 2000 I perceived a need for a high resolution remote sensing service to
NEC s EO Sensors and Data Applications
 NEC s EO Sensors and Data Applications Second Singapore Space Symposium 30 September, 2015 Nanyang Technological University, Singapore Shimpei Kondo Space Technologies Department, Space System Division,
Not just another high resolution satellite sensor
 Global Forest Change Published by Hansen, Potapov, Moore, Hancher et al. http://earthenginepartners.appspot.com/science-2013-global-forest Rapideye Not just another high resolution satellite sensor 5 satellites
IKONOS High Resolution Multispectral Scanner Sensor Characteristics
 High Spatial Resolution and Hyperspectral Scanners IKONOS High Resolution Multispectral Scanner Sensor Characteristics Launch Date View Angle Orbit 24 September 1999 Vandenberg Air Force Base, California,
Preparing Remote Sensing Data for Natural Resources Mapping (image enhancement, rectifications )
") Preparing Remote Sensing Data for Natural Resources Mapping (image enhancement, rectifications ) Why is this important What are the major approaches Examples of digital image enhancement Follow up exercises
Preparing Remote Sensing Data for Natural Resources Mapping (image enhancement, rectifications ) Why is this important What are the major approaches Examples of digital image enhancement Follow up exercises
Introduction to Remote Sensing
 Introduction to Remote Sensing Spatial, spectral, temporal resolutions Image display alternatives Vegetation Indices Image classifications Image change detections Accuracy assessment Satellites & Air-Photos
DETECTION AND CLASSIFICATION OF PLANT SPECIES THROUGH SPECTIR AIRBORNE HYPERSPECTRAL IMAGERY IN CLARK COUNTY, NEVADA BACKGROUND AND INTRODUCTION
 DETECTION AND CLASSIFICATION OF PLANT SPECIES THROUGH SPECTIR AIRBORNE HYPERSPECTRAL IMAGERY IN CLARK COUNTY, NEVADA Rohit Patil, Remote Sensing/ Image Analyst Xin Miao, Postdoctoral Fellow Jill Heaton,
remote sensing? What are the remote sensing principles behind these Definition
 Introduction to remote sensing: Content (1/2) Definition: photogrammetry and remote sensing (PRS) Radiation sources: solar radiation (passive optical RS) earth emission (passive microwave or thermal infrared
Monitoring the vegetation success of a rehabilitated mine site using multispectral UAV imagery. Tim Whiteside & Renée Bartolo, eriss
 Monitoring the vegetation success of a rehabilitated mine site using multispectral UAV imagery Tim Whiteside & Renée Bartolo, eriss About the Supervising Scientist Main roles Working to protect the environment
Spectral Signatures. Vegetation. 40 Soil. Water WAVELENGTH (microns)
") Spectral Signatures % REFLECTANCE VISIBLE NEAR INFRARED Vegetation Soil Water.5. WAVELENGTH (microns). Spectral Reflectance of Urban Materials 5 Parking Lot 5 (5=5%) Reflectance 5 5 5 5 5 Wavelength (nm)
Spectral Signatures % REFLECTANCE VISIBLE NEAR INFRARED Vegetation Soil Water.5. WAVELENGTH (microns). Spectral Reflectance of Urban Materials 5 Parking Lot 5 (5=5%) Reflectance 5 5 5 5 5 Wavelength (nm)
SEMI-SUPERVISED CLASSIFICATION OF LAND COVER BASED ON SPECTRAL REFLECTANCE DATA EXTRACTED FROM LISS IV IMAGE
 SEMI-SUPERVISED CLASSIFICATION OF LAND COVER BASED ON SPECTRAL REFLECTANCE DATA EXTRACTED FROM LISS IV IMAGE B. RayChaudhuri a *, A. Sarkar b, S. Bhattacharyya (nee Bhaumik) c a Department of Physics,
1. Theory of remote sensing and spectrum
 1. Theory of remote sensing and spectrum 7 August 2014 ONUMA Takumi Outline of Presentation Electromagnetic wave and wavelength Sensor type Spectrum Spatial resolution Spectral resolution Mineral mapping
366 Glossary. Popular method for scale drawings in a computer similar to GIS but without the necessity for spatial referencing CEP
 366 Glossary GISci Glossary ASCII ASTER American Standard Code for Information Interchange Advanced Spaceborne Thermal Emission and Reflection Radiometer Computer Aided Design Circular Error Probability
Application of GIS to Fast Track Planning and Monitoring of Development Agenda
 Application of GIS to Fast Track Planning and Monitoring of Development Agenda Radiometric, Atmospheric & Geometric Preprocessing of Optical Remote Sensing 13 17 June 2018 Outline 1. Why pre-process remotely
DIGITALGLOBE SATELLITE IMAGERY AND CLOUD SERVICES FOR SUGARCANE MAPPING
 DIGITALGLOBE SATELLITE IMAGERY AND CLOUD SERVICES FOR SUGARCANE MAPPING PRESENTER: DILLON PANIZZOLO (TECHNICAL MANAGER) COMPANY: GEO DATA DESIGN DATE: 18 TH AUGUST 2015 SASTA Congress Sugar Cane Mapping
1. What values did you use for bands 2, 3 & 4? Populate the table below. Compile the relevant data for the additional bands in the data below:
 Graham Emde GEOG3200: Remote Sensing Lab # 3: Atmospheric Correction Introduction: This lab teachs how to use INDRISI to correct for atmospheric haze in remotely sensed imagery. There are three models
QGIS LAB SERIES GST 101: Introduction to Geospatial Technology Lab 6: Understanding Remote Sensing and Analysis
 QGIS LAB SERIES GST 101: Introduction to Geospatial Technology Lab 6: Understanding Remote Sensing and Analysis Objective Explore and Understand How to Display and Analyze Remotely Sensed Imagery Document
NORMALIZING ASTER DATA USING MODIS PRODUCTS FOR LAND COVER CLASSIFICATION
 NORMALIZING ASTER DATA USING MODIS PRODUCTS FOR LAND COVER CLASSIFICATION F. Gao a, b, *, J. G. Masek a a Biospheric Sciences Branch, NASA Goddard Space Flight Center, Greenbelt, MD 20771, USA b Earth
Crop Scouting with Drones Identifying Crop Variability with UAVs
 DroneDeploy Crop Scouting with Drones Identifying Crop Variability with UAVs A Guide to Evaluating Plant Health and Detecting Crop Stress with Drone Data Table of Contents 01 Introduction Crop Scouting
Remote Sensing Part 3 Examples & Applications
 Remote Sensing Part 3 Examples & Applications Review: Spectral Signatures Review: Spectral Resolution Review: Computer Display of Remote Sensing Images Individual bands of satellite data are mapped to
University of Texas at San Antonio EES 5053 Term Project CORRELATION BETWEEN NDVI AND SURFACE TEMPERATURES USING LANDSAT ETM + IMAGERY NEWFEL MAZARI
 University of Texas at San Antonio EES 5053 Term Project CORRELATION BETWEEN NDVI AND SURFACE TEMPERATURES USING LANDSAT ETM + IMAGERY NEWFEL MAZARI Introduction and Objectives The present study is a correlation
GIS Data Collection. Remote Sensing
 GIS Data Collection Remote Sensing Data Collection Remote sensing Introduction Concepts Spectral signatures Resolutions: spectral, spatial, temporal Digital image processing (classification) Other systems
Relationship Between Landsat 8 Spectral Reflectance and Chlorophyll-a in Grand Lake, Oklahoma
 Relationship Between Landsat 8 Spectral Reflectance and Chlorophyll-a in Grand Lake, Oklahoma Presented by: Abu Mansaray Research Team Dr. Andrew Dzialowski (PI), Oklahoma State University Dr. Scott Stoodley
746A27 Remote Sensing and GIS
 746A27 Remote Sensing and GIS Lecture 1 Concepts of remote sensing and Basic principle of Photogrammetry Chandan Roy Guest Lecturer Department of Computer and Information Science Linköping University What
GUIDE TO SELECTING HYPERSPECTRAL INSTRUMENTS
 GUIDE TO SELECTING HYPERSPECTRAL INSTRUMENTS Safe Non-contact Non-destructive Applicable to many biological, chemical and physical problems Hyperspectral imaging (HSI) is finally gaining the momentum that
Sensors and Data Interpretation II. Michael Horswell
 Sensors and Data Interpretation II Michael Horswell Defining remote sensing 1. When was the last time you did any remote sensing? acquiring information about something without direct contact 2. What are
The studies began when the Tiros satellites (1960) provided man s first synoptic view of the Earth s weather systems.
 provided man s first synoptic view of the Earth s weather systems.") Remote sensing of the Earth from orbital altitudes was recognized in the mid-1960 s as a potential technique for obtaining information important for the effective use and conservation of natural resources.
Remote sensing of the Earth from orbital altitudes was recognized in the mid-1960 s as a potential technique for obtaining information important for the effective use and conservation of natural resources.
Lecture 2. Electromagnetic radiation principles. Units, image resolutions.
 NRMT 2270, Photogrammetry/Remote Sensing Lecture 2 Electromagnetic radiation principles. Units, image resolutions. Tomislav Sapic GIS Technologist Faculty of Natural Resources Management Lakehead University
2017 REMOTE SENSING EVENT TRAINING STRATEGIES 2016 SCIENCE OLYMPIAD COACHING ACADEMY CENTERVILLE, OH
 2017 REMOTE SENSING EVENT TRAINING STRATEGIES 2016 SCIENCE OLYMPIAD COACHING ACADEMY CENTERVILLE, OH This presentation was prepared using draft rules. There may be some changes in the final copy of the
Introduction to Remote Sensing. Electromagnetic Energy. Data From Wave Phenomena. Electromagnetic Radiation (EMR) Electromagnetic Energy
 Electromagnetic Energy") A Basic Introduction to Remote Sensing (RS) ~~~~~~~~~~ Rev. Ronald J. Wasowski, C.S.C. Associate Professor of Environmental Science University of Portland Portland, Oregon 1 September 2015 Introduction
A Basic Introduction to Remote Sensing (RS) ~~~~~~~~~~ Rev. Ronald J. Wasowski, C.S.C. Associate Professor of Environmental Science University of Portland Portland, Oregon 1 September 2015 Introduction
Aral Sea profile Selection of area 24 February April May 1998
 250 km Aral Sea profile 1960 1960 1985 1986 1987 1988 1989 1990 1991 1992 1993 1994 1995 1996 1997 1998 2010? Selection of area Area of interest Kzyl-Orda Dried seabed 185 km Syrdarya river Aral Sea Salt
Bringing Hyperspectral Imaging Into the Mainstream
 Bringing Hyperspectral Imaging Into the Mainstream Rich Zacaroli Product Line Manager, Commercial Hyperspectral Products Corning August 2018 Founded: 1851 Headquarters: Corning, New York Employees: ~46,000
Remote sensing image correction
 Remote sensing image correction Introductory readings remote sensing http://www.microimages.com/documentation/tutorials/introrse.pdf 1 Preprocessing Digital Image Processing of satellite images can be
Multispectral Data Analysis: A Moderate Dimension Example
 Multispectral Data Analysis: A Moderate Dimension Example David Landgrebe School of Electrical Engineering Purdue University West Lafayette IN 47907-1285 landgreb@ecn.purdue.edu In this monograph we illustrate
SOAR Integral Field Spectrograph (SIFS): Call for Science Verification Proposals
: Call for Science Verification Proposals") Published on SOAR (http://www.ctio.noao.edu/soar) Home > SOAR Integral Field Spectrograph (SIFS): Call for Science Verification Proposals SOAR Integral Field Spectrograph (SIFS): Call for Science Verification
Published on SOAR (http://www.ctio.noao.edu/soar) Home > SOAR Integral Field Spectrograph (SIFS): Call for Science Verification Proposals SOAR Integral Field Spectrograph (SIFS): Call for Science Verification
Lesson 3: Working with Landsat Data
 Lesson 3: Working with Landsat Data Lesson Description The Landsat Program is the longest-running and most extensive collection of satellite imagery for Earth. These datasets are global in scale, continuously
CORE SITE GILCHING (GERMANY) - PI ACTIVITIES IN 2003 AND AIMS FOR 2004
 - PI ACTIVITIES IN 2003 AND AIMS FOR 2004") CORE SITE GILCHING (GERMANY) - PI ACTIVITIES IN 3 AND AIMS FOR 4 Natascha Oppelt (1), Wolfram Mauser (1), Rainer Efinger (2), Peter Klotz (2) (1) University of Munich, Dept. for Earth and Environmental
CORE SITE GILCHING (GERMANY) - PI ACTIVITIES IN 3 AND AIMS FOR 4 Natascha Oppelt (1), Wolfram Mauser (1), Rainer Efinger (2), Peter Klotz (2) (1) University of Munich, Dept. for Earth and Environmental
Rapideye (2008 -> ) Not just another high resolution satellite sensor. 5 satellites RapidEye constellation. 5 million km² daily collection capacity
 Not just another high resolution satellite sensor. 5 satellites RapidEye constellation. 5 million km² daily collection capacity") Rapideye (2008 -> ) Not just another high resolution satellite sensor 5 satellites RapidEye constellation 5 million km² daily collection capacity Price: $1.40 / sq km ($2.50 rectified) Orbit: http://www.youtube.com/watch?feature=player_embedded&v=ovpulctoqgs
Rapideye (2008 -> ) Not just another high resolution satellite sensor 5 satellites RapidEye constellation 5 million km² daily collection capacity Price: $1.40 / sq km ($2.50 rectified) Orbit: http://www.youtube.com/watch?feature=player_embedded&v=ovpulctoqgs
Managing and Monitoring Intertidal Oyster Reefs with Remote Sensing in Coastal South Carolina
 Managing and Monitoring Intertidal Oyster Reefs with Remote Sensing in Coastal South Carolina A cooperative effort between: Coastal Services Center South Carolina Department of Natural Resources City of
Introduction to Remote Sensing
 Introduction to Remote Sensing Outline Remote Sensing Defined Resolution Electromagnetic Energy (EMR) Types Interpretation Applications Remote Sensing Defined Remote Sensing is: The art and science of
MOVING FROM PIXELS TO PRODUCTS
 TRUE COLOR RGB MOSAIC, OSAKA, JAPAN MOVING FROM PIXELS TO PRODUCTS and data to insight AUTOMATED STRUCTURE IDENTIFICATION, OSAKA, JAPAN Table of Contents Moving from Pixels to Products 3 Doubling the Spectral
Signal-to-Noise Ratio (SNR) discussion
 discussion") Signal-to-Noise Ratio (SNR) discussion The signal-to-noise ratio (SNR) is a commonly requested parameter for hyperspectral imagers. This note is written to provide a description of the factors that affect
Signal-to-Noise Ratio (SNR) discussion The signal-to-noise ratio (SNR) is a commonly requested parameter for hyperspectral imagers. This note is written to provide a description of the factors that affect
Capture the invisible
 Capture the invisible A Capture the invisible The Sequoia multispectral sensor captures both visible and invisible images, providing calibrated data to optimally monitor the health and vigor of your crops.
EXPLORING THE POTENTIAL FOR A FUSED LANDSAT-MODIS SNOW COVERED AREA PRODUCT. David Selkowitz 1 ABSTRACT INTRODUCTION
 EXPLORING THE POTENTIAL FOR A FUSED LANDSAT-MODIS SNOW COVERED AREA PRODUCT David Selkowitz 1 ABSTRACT Results from nine 3 x 3 km study areas in the Rocky Mountains of Colorado, USA demonstrate there is
NON-PHOTOGRAPHIC SYSTEMS: Multispectral Scanners Medium and coarse resolution sensor comparisons: Landsat, SPOT, AVHRR and MODIS
 NON-PHOTOGRAPHIC SYSTEMS: Multispectral Scanners Medium and coarse resolution sensor comparisons: Landsat, SPOT, AVHRR and MODIS CLASSIFICATION OF NONPHOTOGRAPHIC REMOTE SENSORS PASSIVE ACTIVE DIGITAL
Using Freely Available. Remote Sensing to Create a More Powerful GIS
 Using Freely Available Government Data and Remote Sensing to Create a More Powerful GIS All rights reserved. ENVI, E3De, IAS, and IDL are trademarks of Exelis, Inc. All other marks are the property of
Software requirements * : Part I: 1 hr. Part III: 2 hrs.
 Title: Product Type: Developer: Target audience: Format: Software requirements * : Data: Estimated time to complete: Using MODIS to Analyze the Seasonal Growing Cycle of Crops Part I: Understand and locate
Lecture 13: Remotely Sensed Geospatial Data
 Lecture 13: Remotely Sensed Geospatial Data A. The Electromagnetic Spectrum: The electromagnetic spectrum (Figure 1) indicates the different forms of radiation (or simply stated light) emitted by nature.
Geo-localization and Mosaicing System (GEMS): Enabling Precision Image Feature Location and Rapid Mosaicing General:
: Enabling Precision Image Feature Location and Rapid Mosaicing General:") Geo-localization and Mosaicing System (GEMS): Enabling Precision Image Feature Location and Rapid Mosaicing General: info@senteksystems.com www.senteksystems.com 12/6/2014 Precision Agriculture Multi-Spectral
Geo-localization and Mosaicing System (GEMS): Enabling Precision Image Feature Location and Rapid Mosaicing General: info@senteksystems.com www.senteksystems.com 12/6/2014 Precision Agriculture Multi-Spectral
earthobservation.wordpress.com
 Dirty REMOTE SENSING earthobservation.wordpress.com Stuart Green Teagasc Stuart.Green@Teagasc.ie 1 Purpose Give you a very basic skill set and software training so you can: find free satellite image data.
On the use of water color missions for lakes in 2021
 Lakes and Climate: The Role of Remote Sensing June 01-02, 2017 On the use of water color missions for lakes in 2021 Cédric G. Fichot Department of Earth and Environment 1 Overview 1. Past and still-ongoing
Monitoring agricultural plantations with remote sensing imagery
 MPRA Munich Personal RePEc Archive Monitoring agricultural plantations with remote sensing imagery Camelia Slave and Anca Rotman University of Agronomic Sciences and Veterinary Medicine - Bucharest Romania,
Satellite data processing and analysis: Examples and practical considerations
 Satellite data processing and analysis: Examples and practical considerations Dániel Kristóf Ottó Petrik, Róbert Pataki, András Kolesár International LCLUC Regional Science Meeting in Central Europe Sopron,
Spotlight on Hyperspectral
 Spotlight on Hyperspectral From analyzing eelgrass beds in the Pacific Northwest to identifying pathfinder minerals for geological exploration, hyperspectral imagery and analysis is proving its worth for
Remote Sensing 1 Principles of visible and radar remote sensing & sensors
 Remote Sensing 1 Principles of visible and radar remote sensing & sensors Nick Barrand School of Geography, Earth & Environmental Sciences University of Birmingham, UK Field glaciologist collecting data
Remote Sensing Instruction Laboratory
 Laboratory Session 217513 Geographic Information System and Remote Sensing - 1 - Remote Sensing Instruction Laboratory Assist.Prof.Dr. Weerakaset Suanpaga Department of Civil Engineering, Faculty of Engineering
FOR 353: Air Photo Interpretation and Photogrammetry. Lecture 2. Electromagnetic Energy/Camera and Film characteristics
 FOR 353: Air Photo Interpretation and Photogrammetry Lecture 2 Electromagnetic Energy/Camera and Film characteristics Lecture Outline Electromagnetic Radiation Theory Digital vs. Analog (i.e. film ) Systems
Satellite/Aircraft Imaging Systems Imaging Sensors Standard scanner designs Image data formats
 CEE 6150: Digital Image Processing 1 Satellite/Aircraft Imaging Systems Imaging Sensors Standard scanner designs Image data formats CEE 6150: Digital Image Processing 2 CEE 6150: Digital Image Processing
Airborne hyperspectral data over Chikusei
 SPACE APPLICATION LABORATORY, THE UNIVERSITY OF TOKYO Airborne hyperspectral data over Chikusei Naoto Yokoya and Akira Iwasaki E-mail: {yokoya, aiwasaki}@sal.rcast.u-tokyo.ac.jp May 27, 2016 ABSTRACT Airborne
HYPERSPECTRAL IMAGERY FOR SAFEGUARDS APPLICATIONS. International Atomic Energy Agency, Vienna, Austria
 HYPERSPECTRAL IMAGERY FOR SAFEGUARDS APPLICATIONS G. A. Borstad 1, Leslie N. Brown 1, Q.S. Bob Truong 2, R. Kelley, 3 G. Healey, 3 J.-P. Paquette, 3 K. Staenz 4, and R. Neville 4 1 Borstad Associates Ltd.,
GE 113 REMOTE SENSING
 GE 113 REMOTE SENSING Topic 8. Image Classification and Accuracy Assessment Lecturer: Engr. Jojene R. Santillan jrsantillan@carsu.edu.ph Division of Geodetic Engineering College of Engineering and Information
Vegetation Indexing made easier!
 Remote Sensing Vegetation Indexing made easier! TETRACAM MCA & ADC Multispectral Camera Systems TETRACAM MCA and ADC are multispectral cameras for critical narrow band digital photography. Based on the
MULTISPECTRAL IMAGE PROCESSING I
 TM1 TM2 337 TM3 TM4 TM5 TM6 Dr. Robert A. Schowengerdt TM7 Landsat Thematic Mapper (TM) multispectral images of desert and agriculture near Yuma, Arizona MULTISPECTRAL IMAGE PROCESSING I SENSORS Multispectral
COUPLING LIDAR DATA AND LANDSAT 8 OLI IN DELINEATING CORN PLANTATIONS IN BUTUAN CITY, PHILIPPINES
 COUPLING LIDAR DATA AND LANDSAT 8 OLI IN DELINEATING CORN PLANTATIONS IN BUTUAN CITY, PHILIPPINES Michelle V. Japitana, James Earl D. Cubillas and Arnold G. Apdohan Phil-LiDAR 2.B.14 Project, College of