Measurement of Visual Resolution of Display Screens
|
|
|
- Jonathan Gregory
- 6 years ago
- Views:
Transcription
1
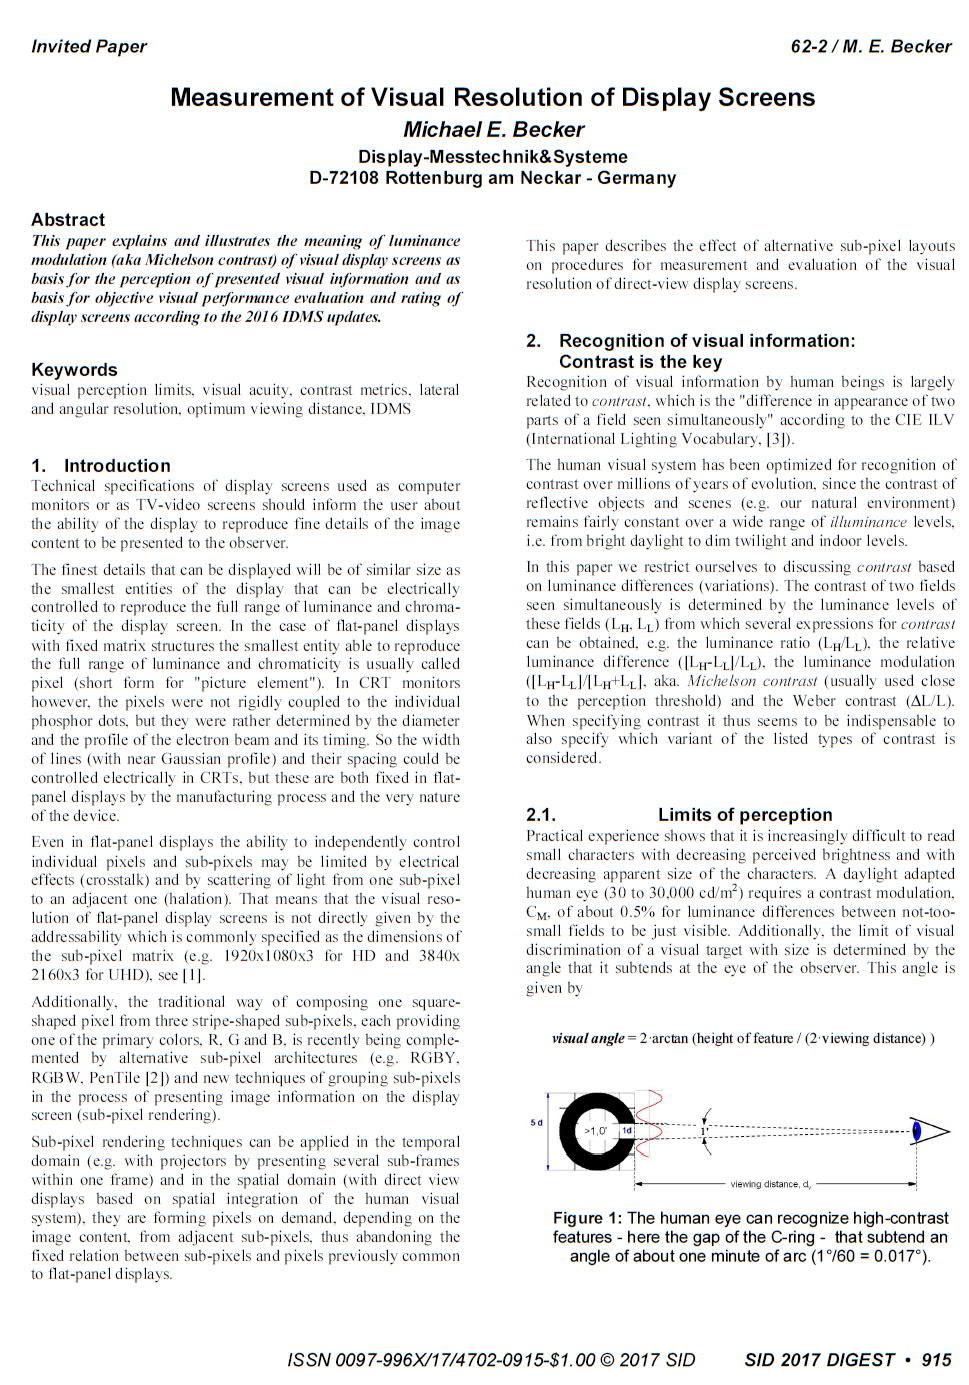
2 Measurement of Visual Resolution of Display Screens Michael E. Becker Display-Messtechnik&Systeme D Rottenburg am Neckar - Germany Abstract This paper explains and illustrates the meaning of luminance modulation (aka Michelson contrast) of visual display screens as basis for the perception of presented visual information and as basis for objective visual performance evaluation and rating of display screens according to the 2016 IDMS updates. Keywords visual perception limits, visual acuity, contrast metrics, lateral and angular resolution, optimum viewing distance, IDMS 1. Introduction Technical specifications of display screens used as computer monitors or as TV-video screens should inform the user about the ability of the display to reproduce fine details of the image content to be presented to the observer. The finest details that can be displayed will be of similar size as the smallest entities of the display that can be electrically controlled to reproduce the full range of luminance and chromaticity of the display screen. In the case of flat-panel displays with fixed matrix structures the smallest entity able to reproduce the full range of luminance and chromaticity is usually called pixel (short form for "picture element"). In CRT monitors however, the pixels were not rigidly coupled to the individual phosphor dots, but they were rather determined by the diameter and the profile of the electron beam and its timing. So the width of lines (with near Gaussian profile) and their spacing could be controlled electrically in CRTs, but these are both fixed in flatpanel displays by the manufacturing process and the very nature of the device. Even in flat-panel displays the ability to independently control individual pixels and sub-pixels may be limited by electrical effects (crosstalk) and by scattering of light from one sub-pixel to an adjacent one (halation). That means that the visual resolution of flat-panel display screens is not directly given by the addressability which is commonly specified as the dimensions of the sub-pixel matrix (e.g. 1920x1080x3 for HD and 3840x 2160x3 for UHD), see [1]. Additionally, the traditional way of composing one squareshaped pixel from three stripe-shaped sub-pixels, each providing one of the primary colors, R, G and B, is recently being complemented by alternative sub-pixel architectures (e.g. RGBY, RGBW, PenTile [2]) and new techniques of grouping sub-pixels in the process of presenting image information on the display screen (sub-pixel rendering). Sub-pixel rendering techniques can be applied in the temporal domain (e.g. with projectors by presenting several sub-frames within one frame) and in the spatial domain (with direct view displays based on spatial integration of the human visual system), they are forming pixels on demand, depending on the image content, from adjacent sub-pixels, thus abandoning the fixed relation between sub-pixels and pixels previously common to flat-panel displays. This paper describes the effect of alternative sub-pixel layouts on procedures for measurement and evaluation of the visual resolution of direct-view display screens. 2. Recognition of visual information: Contrast is the key Recognition of visual information by human beings is largely related to contrast, which is the "difference in appearance of two parts of a field seen simultaneously" according to the CIE ILV (International Lighting Vocabulary, [3]). The human visual system has been optimized for recognition of contrast over millions of years of evolution, since the contrast of reflective objects and scenes (e.g. our natural environment) remains fairly constant over a wide range of illuminance levels, i.e. from bright daylight to dim twilight and indoor levels. In this paper we restrict ourselves to discussing contrast based on luminance differences (variations). The contrast of two fields seen simultaneously is determined by the luminance levels of these fields (L H, L L ) from which several expressions for contrast can be obtained, e.g. the luminance ratio (L H /L L ), the relative luminance difference ([L H -L L ]/L L ), the luminance modulation ([L H -L L ]/[L H +L L ], aka. Michelson contrast (usually used close to the perception threshold) and the Weber contrast ( L/L). When specifying contrast it thus seems to be indispensable to also specify which variant of the listed types of contrast is considered Limits of perception Practical experience shows that it is increasingly difficult to read small characters with decreasing perceived brightness and with decreasing apparent size of the characters. A daylight adapted human eye (30 to 30,000 cd/m 2 ) requires a contrast modulation, C M, of about 0.5% for luminance differences between not-toosmall fields to be just visible. Additionally, the limit of visual discrimination of a visual target with size is determined by the angle that it subtends at the eye of the observer. This angle is given by visual angle = 2 arctan (height of feature / (2 viewing distance) ) Figure 1: The human eye can recognize high-contrast features - here the gap of the C-ring - that subtend an angle of about one minute of arc (1 /60 = ).
 and averaged luminance profile (red curve) for a phase-1 achromatic grille pattern 0 0 50 100 150 200 250 300 350 400 450 Luminance profile (blue curve) and averaged luminance")
. The period corresponding to the lowest spatial frequency, p 0, is the same for both phases of the grille pattern.")
3 Sub-pixel pattern of RGBW display - phase 1 Sub-pixel pattern of RGBW display - phase p 0 p Luminance profile (blue curve) and averaged luminance profile (red curve) for a phase-1 achromatic grille pattern Luminance profile (blue curve) and averaged luminance profile (red curve) for a phase-2 achromatic grille pattern Figure 2: Grille-patterns of achromatic vertical lines (top) displayed on an RGBW-screen and the corresponding luminance profiles (bottom, blue curve). The period corresponding to the lowest spatial frequency, p 0, is the same for both phases of the grille pattern. The red curve is obtained by application of a moving window average with a window dimension of p 0 /2. It represents what the eye of an observer perceives from the optimum viewing distance according to section 2.1. The visual angle of one minute of arc (1' = 1 /60) is the accepted average value for normal visual acuity under the conditions of good target contrast and photopic adaptation of the eye (daylight vision). That means that the human eye performs an integration over an angle of about one minute of arc if no hyperacuity is involved (e.g. perception of the displacement of two parallel lines, called vernier acuity). A visus of 1 means that a visual target feature with high contrast subtending an angle of 1 minute of arc (1' = 1 /60) can just be recognized [4]. This value does significantly vary with age and from individual to individual. It is practical to select the viewing distance to a display screen in such a way that we see a uniform white area when all sub-pixels are activated and thus do not perceive details of the sub-pixel structure. A display screen with a pixel pitch of 0.3 mm should thus be watched ideally from a distance of (only slightly) more than 1031 mm in order to fulfill that condition. This is also the optimum viewing distance since any further increase reduces the visibility of fine image details. If the same display screen is observed from double the viewing distance (2062 mm) three out of four pixels do not contribute to forming fine image details because the eye of the observer now integrates over four pixels (two horizontally, two vertically) which cannot be resolved individually. In other words, a UHD screen visually becomes an HD-screen when viewed from two times the ideal viewing distance because the visual angle now subtends four pixels instead of one How well does a display screen reproduce input signals? Resolution is often incorrectly specified in display data sheets as the "number of individually addressable and controllable pixels", e.g x 1080 or 3840 x This however only specifies the dimensions of the display pixel array or the addressability of the display. Resolution however should specify how well the smallest details presented on the display appear separate and distinct, i.e. how well the screen can actually display fine details of images. This ability may be limited by electrical interactions between sub-pixels and pixels (electrical crosstalk) and by scattering of light from one sub-pixel to an adjacent one (halation or optical crosstalk). The visual resolution of display screens, i.e. the ability to render fine image details is usually evaluated with achromatic grille test-patterns, i.e. parallel lines of black and white (or shades of grey) in the vertical and horizontal direction. In order for the pixels, arranged in columns or rows, to be distinctly visible, the contrast of a grille pattern must be above the threshold of perception. The higher the contrast of the grille pattern the better is the visual performance of the display. However, other sub-pixels layouts than just RGB are possible and realized in commercially available display products. A yellow sub-pixel may be added, for example, in an attempt to increase color gamut or white sub-pixels may be added (RGBW) for improving the maximum luminance (and thus the perceived brightness) of the display screen, respectively, according to the claims of the manufacturers.
 describes a widely accepted method for evaluation of display resolution in section 7, clause 7.2 and 7.")
4 Visual resolution in case of standard sub-pixel layouts The IDMS (International Display Measurement Standard V1.03, issued by the International Committee for Display Measurement, ICDM, in 2012) describes a widely accepted method for evaluation of display resolution in section 7, clause 7.2 and 7.8 ("resolution from contrast modulation"). The method is based on the variation of luminance in horizontal and vertical direction, i.e. parallel to the display rows and columns. Great care has to be exercised in order to measure these luminance distributions with imaging light measurement devices (ILMDs) accurately without errors and artefacts. The ICDM describes procedures, methods and precautions on how to carry out these measurements. A display screen with a visual resolution of 3840 x 2160 must be able to simultaneously present 1920 black and 1920 white lines with a luminance modulation (Michelson contrast) that is at least sufficient for the intended application case (i.e. 25% for TV and video and 50% for computer monitor use). The updated section 7.2 requires reporting of the Michelson contrast for maximum number of grille lines to avoid obfuscation of the actual display performance by application of a threshold (binary decision) Visual resolution in case of non-standard sub-pixel layouts An alternative sub-pixel layout that is available on the market makes use of RGBW sub-pixels with a horizontal shift of two sub-pixels with respect to the adjacent lines. Achromatic black and white vertical lines of minimum width can be rendered on such displays e.g. as shown in Fig. 2. In 2015 some display metrology laboratories started to notice conceptual conflicts when trying to apply the procedures of the IDMSv1p03b, June 2012, to display screens with non-standard sub-pixel arrangements (e.g. RGBW). That version of the IDMS had been written for computer monitors with a distinct fixed relation between sub-pixels and pixels of the display. For that class of devices a pixel is defined as the smallest unit that can display the full range of luminance and chromaticity. That definition would require 4 sub-pixels for a pixel in the case of RGBW Luminance modulation vs. grille line-width If a display screen features a luminance modulation for the smallest grille line width that is above a threshold value (e.g. above 50% for the yellow and red curves in Fig. 3), application of the threshold hides the difference in luminance modulation that is obvious in Fig. 3, because with increasing contrast (i.e. luminance modulation), also the quality of rendering fine image details is increasing. For a display that did not reach the required threshold contrast a linear interpolation was used for determination of a hypothetical resolution which however can not be displayed on the screen (see IDMS 2012, 7.8, Fig. 1). 3. The 2016 updates of the IDMS After a period of discussions, the ICDM on May 24, 2016 finally accepted a series of editorial comments and explanations (7p pdf, 7p pdf and 7p pdf) that are meant to provide a safe basis for those who have to perform visual resolution measurements during the time period until the next version of the IDMS will be completed and released. The updated procedures are based on evaluation of the luminance modulation of achromatic grille test-patterns (both phases) with focus on the smallest grille line width (i.e. highest number of line pairs). The width of the averaging window is unambiguously obtained from the measured luminance profile (fundamental spatial frequency), not from biased or unjustified and not applicable "pixel" definitions). In case of different modulations for both phases of the grille pattern (as illustrated in Fig. 2), the average modulation value has to be calculated and reported. The updated section 7.2 requires reporting of the Michelson contrast for the smallest grille line width to avoid obfuscation by application of thresholds for pass/fail decisions. The updates also suggest that version 2 of the IDMS will comprise the following details for even more complete specification of the visual resolution of display screens: 1 Replacement of the modulation thresholds by specification of the luminance modulation (e.g m=75% ) as a function of achromatic grille line width specified in units of sub-pixels (as illustrated in Fig. 3) or as number of lines/line-pairs per display width/height. 2 Extension to grille patters of primary colors in combination with black. Figure 3: Illustrative example for the variation of achromatic grille luminance modulation with line width (specified by the number of sub-pixels) for different display screens. 4. Light measurement devices Evaluation of the luminance profiles of the achromatic grille patterns addressed throughout this paper requires spatial oversampling of the sub-pixel matrix of the display under test in order to avoid sampling artefacts that can severely affect the measurements. High magnification usually also means a reduced working distance. So reflections from the objective lens back to the DUT and stray light within the optics of the LMD (lens flare, veiling glare) may introduce considerable errors. The Appendix A2 of the IDMS describes the problems related to the measurement of luminance profiles on the sub-pixel level and provides diagnostics, precautions and approaches to minimize errors. Such measurements are often carried out with consumer RGBcameras in combination with a high magnification objective-
5 lens. In that case a calibration is required in order to obtain approximate luminance values from the RGB-channels of the camera (RAW-data processing is required to assure linearity). Such calibrations become too inaccurate and may even fail in the case of RGBW displays. In order to keep measurement uncertainties as low as possible, simple imaging LMDs with a filter added to achieve the required overall spectral sensitivity according to the spectral luminous efficiency, V(λ), for photopic vision should be used instead of RGB-cameras. 5. The updated measurement procedure The measurement procedure for visual resolution according to the editorial comments and explanations documented in the IDMS updates 7p pdf, 7p pdf and 7p pdf is summarized here as follows. 1 Apply an achromatic grille test-pattern to the display screen starting with e.g. the highest number of lines that can be displayed according to the specified dimensions of the display matrix (addressability). For an UHD screen this is 3840 lines in the vertical direction (1920 black and 1920 white lines) and 1080 line-pairs (2160 lines) in the horizontal direction. Make sure that no coloration effects occur. Apply one grille pattern for each phase (odd and even). 2 Record the 2D luminance distribution of the grille patterns with an imaging LMD taking into account the precautions described in IDMS-V1.03 in section A2. 3 Apply averaging along the direction of the grille lines over an integer number of rows or columns (min. 2, better 4) in order to include the effect of sub-pixel shifting between successive columns and rows as illustrated in Fig From the luminance profiles obtained according to (3) determine the widest modulation period, p 0, which is corresponding to the lowest modulation frequency, as illustrated in Fig. 2. Detailed suggestions on how to achieve this are given in the addendum to IDMS section 7.2 (provided in 7p pdf). 5 Perform a moving window averaging with a window width of p 0 /2 according to the procedure described in 7p pdf. Detailed suggestions on how to achieve this with e.g. standard spreadsheet software are given in the addendum to IDMS section 7.2 (provided in 7p pdf). Check the correctness of the window width, p 0 /2, by performing the averaging with a window of width p 0 which must result in a perfectly flat luminance profile. 6 Determine the complete set of local luminance modulation levels from local maxima of the averaged luminance profiles and the adjacent minima (or the other way around) to obtain an average value of luminance modulation for the screen area included in the measurement. 7 Determine the luminance modulation for both phases of the grille pattern (even, odd) and calculate their average value. 8 Report the average luminance modulation together with the width of the grille lines of the test-pattern used, specified e.g. in terms of sub-pixels (or as number of lines/line-pairs per display width/height) even if the threshold level required for the respective application case (25% for TV, 50% for computer monitor) is exceeded. A typical UHD performance specification would read like this: 1920 vertical e.g. 75% modulation 1080 horizontal e.g. 85% modulation This measurement procedure may be repeated for grille patterns with wider lines in order to evaluate the luminance modulation vs. grille line width as shown in Fig. 3. The most important evaluation however, is done with the maximum number of lines that can be rendered by the display screen with specified contrast). The contrast level required for a specific application may be negotiated between supplier and customer. 6. Discussion The width of the window used for averaging as introduced here is based on perceptional arguments, it can however as well be understood as a means to get rid of modulations at and below the sub-pixel scale by averaging. The grille test-patterns used in the procedures described here are applicable to screens that are supposed and able to display characters and line-graphics (i.e. non band-limited content). An alternative approach to evaluation of ("effective") display resolution based on the slanted edge method according to ISO is described in section 7.7 of the IDMS-V1.03. The resulting luminance modulation vs. cycles/(display sub-pixel) should be directly comparable to the results obtained with the method described above, but it is much less clear and intuitive. The author of this paper proposes to replace specification of hypothetical resolutions obtained by linear interpolation by specification of luminance modulation (contrast) obtained for a specific display format (e.g. UHD, 1920 vertical e.g. 75% modulation, 1080 horizontal e.g. 85% modulation). 7. Conclusion The new procedure for determination of the averaging window width for non-standard RGB sub-pixel layouts is independent from any forced pixel definition and thus provides a solid basis for all luminance modulation-based evaluations. Inclusion of the suggestions made here and in the 2016 IDMS updates into the IDMS V2 will make evaluation of display resolution more comprehensive. 8. Acknowledgements The author would like to thank his colleagues in the display measurement community, especially in the ICDM "spatial subcommittee", for their cooperation, ideas and contributions and their patience during extended and sometimes controversial discussions in 2015/16. Without the due mutual respect and benevolent manners the results described above (i.e. the 2016 updates) would not have been possible. 9. References [1] IDMS (International Display Measurement Standard V1.03(2012), issued by the SID International Committee for Display Measurement, ICDM [2] PenTile sub-pixel layouts [3] CIE S17/E:2011 ILV: International Lighting Vocabulary &ievref= [4]
Measurement of Visual Resolution of Display Screens
 SID Display Week 2017 Measurement of Visual Resolution of Display Screens Michael E. Becker - Display-Messtechnik&Systeme D-72108 Rottenburg am Neckar - Germany Resolution Campbell-Robson Contrast Sensitivity
Measurement of Visual Resolution of Display Screens
 SID Display Week 17 Measurement of Visual Resolution of Display Screens Michael E. Becker - Display-Messtechnik&Systeme D-7218 Rottenburg am Neckar - Germany Resolution ampbell-robson ontrast Sensitivity
DISPLAY metrology measurement
 Curved Displays Challenge Display Metrology Non-planar displays require a close look at the components involved in taking their measurements. by Michael E. Becker, Jürgen Neumeier, and Martin Wolf DISPLAY
EC-433 Digital Image Processing
 EC-433 Digital Image Processing Lecture 2 Digital Image Fundamentals Dr. Arslan Shaukat 1 Fundamental Steps in DIP Image Acquisition An image is captured by a sensor (such as a monochrome or color TV camera)
Digital Image Processing
 Digital Image Processing Digital Imaging Fundamentals Christophoros Nikou cnikou@cs.uoi.gr Images taken from: R. Gonzalez and R. Woods. Digital Image Processing, Prentice Hall, 2008. Digital Image Processing
4K Resolution, Demystified!
 4K Resolution, Demystified! Presented by: Alan C. Brawn & Jonathan Brawn CTS, ISF, ISF-C, DSCE, DSDE, DSNE Principals of Brawn Consulting alan@brawnconsulting.com jonathan@brawnconsulting.com Sponsored
Digital Image Fundamentals. Digital Image Processing. Human Visual System. Contents. Structure Of The Human Eye (cont.) Structure Of The Human Eye
 Structure Of The Human Eye") Digital Image Processing 2 Digital Image Fundamentals Digital Imaging Fundamentals Christophoros Nikou cnikou@cs.uoi.gr Those who wish to succeed must ask the right preliminary questions Aristotle Images
Digital Image Processing 2 Digital Image Fundamentals Digital Imaging Fundamentals Christophoros Nikou cnikou@cs.uoi.gr Those who wish to succeed must ask the right preliminary questions Aristotle Images
Digital Image Fundamentals. Digital Image Processing. Human Visual System. Contents. Structure Of The Human Eye (cont.) Structure Of The Human Eye
 Structure Of The Human Eye") Digital Image Processing 2 Digital Image Fundamentals Digital Imaging Fundamentals Christophoros Nikou cnikou@cs.uoi.gr Images taken from: R. Gonzalez and R. Woods. Digital Image Processing, Prentice Hall,
Digital Image Processing 2 Digital Image Fundamentals Digital Imaging Fundamentals Christophoros Nikou cnikou@cs.uoi.gr Images taken from: R. Gonzalez and R. Woods. Digital Image Processing, Prentice Hall,
DRAFT Direct View Display D-Cinema Addendum
 DRAFT Direct View Display D-Cinema Addendum DRAFT Version 0.9 Approved for Distribution for Comments 16 November 2018 Digital Cinema Initiatives, LLC, Member Representatives Committee This document is
Digital Image Processing
 Digital Image Processing Digital Imaging Fundamentals Christophoros Nikou cnikou@cs.uoi.gr Images taken from: R. Gonzalez and R. Woods. Digital Image Processing, Prentice Hall, 2008. Digital Image Processing
Image and video processing (EBU723U) Colour Images. Dr. Yi-Zhe Song
 Colour Images. Dr. Yi-Zhe Song") Image and video processing () Colour Images Dr. Yi-Zhe Song yizhe.song@qmul.ac.uk Today s agenda Colour spaces Colour images PGM/PPM images Today s agenda Colour spaces Colour images PGM/PPM images History
Image and video processing () Colour Images Dr. Yi-Zhe Song yizhe.song@qmul.ac.uk Today s agenda Colour spaces Colour images PGM/PPM images Today s agenda Colour spaces Colour images PGM/PPM images History
Recommendation ITU-R BT (03/2010)
") Recommendation ITU-R BT.1845-1 (03/2010) Guidelines on metrics to be used when tailoring television programmes to broadcasting applications at various image quality levels, display sizes and aspect ratios
Recommendation ITU-R BT.1845-1 (03/2010) Guidelines on metrics to be used when tailoring television programmes to broadcasting applications at various image quality levels, display sizes and aspect ratios
Human Vision and Human-Computer Interaction. Much content from Jeff Johnson, UI Wizards, Inc.
 Human Vision and Human-Computer Interaction Much content from Jeff Johnson, UI Wizards, Inc. are these guidelines grounded in perceptual psychology and how can we apply them intelligently? Mach bands:
CS 548: Computer Vision REVIEW: Digital Image Basics. Spring 2016 Dr. Michael J. Reale
 CS 548: Computer Vision REVIEW: Digital Image Basics Spring 2016 Dr. Michael J. Reale Human Vision System: Cones and Rods Two types of receptors in eye: Cones Brightness and color Photopic vision = bright-light
Color & Graphics. Color & Vision. The complete display system is: We'll talk about: Model Frame Buffer Screen Eye Brain
 Color & Graphics The complete display system is: Model Frame Buffer Screen Eye Brain Color & Vision We'll talk about: Light Visions Psychophysics, Colorimetry Color Perceptually based models Hardware models
The Science Seeing of process Digital Media. The Science of Digital Media Introduction
 The Human Science eye of and Digital Displays Media Human Visual System Eye Perception of colour types terminology Human Visual System Eye Brains Camera and HVS HVS and displays Introduction 2 The Science
MEASUREMENT CAMERA USER GUIDE
 How to use your Aven camera s imaging and measurement tools Part 1 of this guide identifies software icons for on-screen functions, camera settings and measurement tools. Part 2 provides step-by-step operating
Understand brightness, intensity, eye characteristics, and gamma correction, halftone technology, Understand general usage of color
 Understand brightness, intensity, eye characteristics, and gamma correction, halftone technology, Understand general usage of color 1 ACHROMATIC LIGHT (Grayscale) Quantity of light physics sense of energy
For a long time I limited myself to one color as a form of discipline. Pablo Picasso. Color Image Processing
 For a long time I limited myself to one color as a form of discipline. Pablo Picasso Color Image Processing 1 Preview Motive - Color is a powerful descriptor that often simplifies object identification
DIGITAL IMAGE PROCESSING (COM-3371) Week 2 - January 14, 2002
 Week 2 - January 14, 2002") DIGITAL IMAGE PROCESSING (COM-3371) Week 2 - January 14, 22 Topics: Human eye Visual phenomena Simple image model Image enhancement Point processes Histogram Lookup tables Contrast compression and stretching
DIGITAL IMAGE PROCESSING (COM-3371) Week 2 - January 14, 22 Topics: Human eye Visual phenomena Simple image model Image enhancement Point processes Histogram Lookup tables Contrast compression and stretching
Chapter 2: Digital Image Fundamentals. Digital image processing is based on. Mathematical and probabilistic models Human intuition and analysis
 Chapter 2: Digital Image Fundamentals Digital image processing is based on Mathematical and probabilistic models Human intuition and analysis 2.1 Visual Perception How images are formed in the eye? Eye
APPLICATION OF VIDEOPHOTOMETER IN THE EVALUATION OF DGI IN SCHOLASTIC ENVIRONMENT
 , Volume 6, Number 2, p.82-88, 2005 APPLICATION OF VIDEOPHOTOMETER IN THE EVALUATION OF DGI IN SCHOLASTIC ENVIRONMENT L. Bellia, A. Cesarano and G. Spada DETEC, Università degli Studi di Napoli FEDERICO
Visibility, Performance and Perception. Cooper Lighting
 Visibility, Performance and Perception Kenneth Siderius BSc, MIES, LC, LG Cooper Lighting 1 Vision It has been found that the ability to recognize detail varies with respect to four physical factors: 1.Contrast
Image Processing. Michael Kazhdan ( /657) HB Ch FvDFH Ch. 13.1
 HB Ch FvDFH Ch. 13.1") Image Processing Michael Kazhdan (600.457/657) HB Ch. 14.4 FvDFH Ch. 13.1 Outline Human Vision Image Representation Reducing Color Quantization Artifacts Basic Image Processing Human Vision Model of Human
Image Processing Michael Kazhdan (600.457/657) HB Ch. 14.4 FvDFH Ch. 13.1 Outline Human Vision Image Representation Reducing Color Quantization Artifacts Basic Image Processing Human Vision Model of Human
WP640 Imaging Colorimeter. Backlit Graphics Panel Analysis
 Westboro Photonics 1505 Carling Ave, Suite 301 Ottawa, ON K1V 3L7 Wphotonics.com WP640 Imaging Colorimeter Backlit Graphics Panel Analysis Issued: May 5, 2014 Table of Contents 1.0 WP600 SERIES IMAGING
The User Experience: Proper Image Size and Contrast
 The User Experience: Proper Image Size and Contrast Presented by: Alan C. Brawn & Jonathan Brawn CTS, ISF, ISF-C, DSCE, DSDE, DSNE Principals Brawn Consulting alan@brawnconsulting.com, jonathan@brawnconsulting.com
H34: Putting Numbers to Colour: srgb
 page 1 of 5 H34: Putting Numbers to Colour: srgb James H Nobbs Colour4Free.org Introduction The challenge of publishing multicoloured images is to capture a scene and then to display or to print the image
Introduction to Visual Perception & the EM Spectrum
 , Winter 2005 Digital Image Fundamentals: Visual Perception & the EM Spectrum, Image Acquisition, Sampling & Quantization Monday, September 19 2004 Overview (1): Review Some questions to consider Elements
Review. Introduction to Visual Perception & the EM Spectrum. Overview (1):
:") Overview (1): Review Some questions to consider Winter 2005 Digital Image Fundamentals: Visual Perception & the EM Spectrum, Image Acquisition, Sampling & Quantization Tuesday, January 17 2006 Elements
Overview (1): Review Some questions to consider Winter 2005 Digital Image Fundamentals: Visual Perception & the EM Spectrum, Image Acquisition, Sampling & Quantization Tuesday, January 17 2006 Elements
Introduction. Prof. Lina Karam School of Electrical, Computer, & Energy Engineering Arizona State University
 EEE 508 - Digital Image & Video Processing and Compression http://lina.faculty.asu.edu/eee508/ Introduction Prof. Lina Karam School of Electrical, Computer, & Energy Engineering Arizona State University
DECISION NUMBER FOURTEEN TO THE TREATY ON OPEN SKIES
 DECISION NUMBER FOURTEEN TO THE TREATY ON OPEN SKIES OSCC.DEC 14 12 October 1994 METHODOLOGY FOR CALCULATING THE MINIMUM HEIGHT ABOVE GROUND LEVEL AT WHICH EACH VIDEO CAMERA WITH REAL TIME DISPLAY INSTALLED
What is Color Gamut? Public Information Display. How do we see color and why it matters for your PID options?
 What is Color Gamut? How do we see color and why it matters for your PID options? One of the buzzwords at CES 2017 was broader color gamut. In this whitepaper, our experts unwrap this term to help you
Digital Image Processing (DIP)
") University of Kurdistan Digital Image Processing (DIP) Lecture 6: Color Image Processing Instructor: Kaveh Mollazade, Ph.D. Department of Biosystems Engineering, Faculty of Agriculture, University of Kurdistan,
University of Kurdistan Digital Image Processing (DIP) Lecture 6: Color Image Processing Instructor: Kaveh Mollazade, Ph.D. Department of Biosystems Engineering, Faculty of Agriculture, University of Kurdistan,
Digital Image Processing
 Digital Image Processing Lecture # 3 Digital Image Fundamentals ALI JAVED Lecturer SOFTWARE ENGINEERING DEPARTMENT U.E.T TAXILA Email:: ali.javed@uettaxila.edu.pk Office Room #:: 7 Presentation Outline
Digital Image Processing. Lecture # 6 Corner Detection & Color Processing
 Digital Image Processing Lecture # 6 Corner Detection & Color Processing 1 Corners Corners (interest points) Unlike edges, corners (patches of pixels surrounding the corner) do not necessarily correspond
TCO Development 3DTV study. Report April Active vs passive. Börje Andrén, Kun Wang, Kjell Brunnström Acreo AB
 Acreo Research and development in electronics, optics and communication technology. TCO Development 3DTV study Report April 2011 Active vs passive Börje Andrén, Kun Wang, Kjell Brunnström Acreo AB Niclas
A Handheld Image Analysis System for Portable and Objective Print Quality Analysis
 A Handheld Image Analysis System for Portable and Objective Print Quality Analysis Ming-Kai Tse Quality Engineering Associates (QEA), Inc. Contact information as of 2010: 755 Middlesex Turnpike, Unit 3
A Study of Slanted-Edge MTF Stability and Repeatability
 A Study of Slanted-Edge MTF Stability and Repeatability Jackson K.M. Roland Imatest LLC, 2995 Wilderness Place Suite 103, Boulder, CO, USA ABSTRACT The slanted-edge method of measuring the spatial frequency
Digital Image Processing. Lecture # 8 Color Processing
 Digital Image Processing Lecture # 8 Color Processing 1 COLOR IMAGE PROCESSING COLOR IMAGE PROCESSING Color Importance Color is an excellent descriptor Suitable for object Identification and Extraction
Human Visual System. Digital Image Processing. Digital Image Fundamentals. Structure Of The Human Eye. Blind-Spot Experiment.
 Digital Image Processing Digital Imaging Fundamentals Christophoros Nikou cnikou@cs.uoi.gr 4 Human Visual System The best vision model we have! Knowledge of how images form in the eye can help us with
Optical design of a high resolution vision lens
 Optical design of a high resolution vision lens Paul Claassen, optical designer, paul.claassen@sioux.eu Marnix Tas, optical specialist, marnix.tas@sioux.eu Prof L.Beckmann, l.beckmann@hccnet.nl Summary:
Imaging Photometer and Colorimeter
 W E B R I N G Q U A L I T Y T O L I G H T. /XPL&DP Imaging Photometer and Colorimeter Two models available (photometer and colorimetry camera) 1280 x 1000 pixels resolution Measuring range 0.02 to 200,000
Visual Perception. Overview. The Eye. Information Processing by Human Observer
 Visual Perception Spring 06 Instructor: K. J. Ray Liu ECE Department, Univ. of Maryland, College Park Overview Last Class Introduction to DIP/DVP applications and examples Image as a function Concepts
Digital Image Processing
 Digital Image Processing Digital Imaging Fundamentals Christophoros Nikou cnikou@cs.uoi.gr Images taken from: R. Gonzalez and R. Woods. Digital Image Processing, Prentice Hall, 2008. Digital Image Processing
Human Visual System. Prof. George Wolberg Dept. of Computer Science City College of New York
 Human Visual System Prof. George Wolberg Dept. of Computer Science City College of New York Objectives In this lecture we discuss: - Structure of human eye - Mechanics of human visual system (HVS) - Brightness
WHITE PAPER. Methods for Measuring Flat Panel Display Defects and Mura as Correlated to Human Visual Perception
 Methods for Measuring Flat Panel Display Defects and Mura as Correlated to Human Visual Perception Methods for Measuring Flat Panel Display Defects and Mura as Correlated to Human Visual Perception Abstract
Computers and Imaging
 Computers and Imaging Telecommunications 1 P. Mathys Two Different Methods Vector or object-oriented graphics. Images are generated by mathematical descriptions of line (vector) segments. Bitmap or raster
Solution Set #2
 05-78-0 Solution Set #. For the sampling function shown, analyze to determine its characteristics, e.g., the associated Nyquist sampling frequency (if any), whether a function sampled with s [x; x] may
Multiscale model of Adaptation, Spatial Vision and Color Appearance
 Multiscale model of Adaptation, Spatial Vision and Color Appearance Sumanta N. Pattanaik 1 Mark D. Fairchild 2 James A. Ferwerda 1 Donald P. Greenberg 1 1 Program of Computer Graphics, Cornell University,
INTRODUCTION THIN LENSES. Introduction. given by the paraxial refraction equation derived last lecture: Thin lenses (19.1) = 1. Double-lens systems
 = 1. Double-lens systems") Chapter 9 OPTICAL INSTRUMENTS Introduction Thin lenses Double-lens systems Aberrations Camera Human eye Compound microscope Summary INTRODUCTION Knowledge of geometrical optics, diffraction and interference,
Chapter 9 OPTICAL INSTRUMENTS Introduction Thin lenses Double-lens systems Aberrations Camera Human eye Compound microscope Summary INTRODUCTION Knowledge of geometrical optics, diffraction and interference,
Image and Multidimensional Signal Processing
 Image and Multidimensional Signal Processing Professor William Hoff Dept of Electrical Engineering &Computer Science http://inside.mines.edu/~whoff/ Digital Image Fundamentals 2 Digital Image Fundamentals
CSE 332/564: Visualization. Fundamentals of Color. Perception of Light Intensity. Computer Science Department Stony Brook University
 Perception of Light Intensity CSE 332/564: Visualization Fundamentals of Color Klaus Mueller Computer Science Department Stony Brook University How Many Intensity Levels Do We Need? Dynamic Intensity Range
E X P E R I M E N T 12
 E X P E R I M E N T 12 Mirrors and Lenses Produced by the Physics Staff at Collin College Copyright Collin College Physics Department. All Rights Reserved. University Physics II, Exp 12: Mirrors and Lenses
Output Model. Coordinate Systems. A picture is worth a thousand words (and let s not forget about sound) Device coordinates Physical coordinates
 Device coordinates Physical coordinates") Output Model A picture is worth a thousand words (and let s not forget about sound) Coordinate Systems Device coordinates Physical coordinates 1 Device Coordinates Most natural units for the output device
Output Model A picture is worth a thousand words (and let s not forget about sound) Coordinate Systems Device coordinates Physical coordinates 1 Device Coordinates Most natural units for the output device
ICC Votable Proposal Submission Colorimetric Intent Image State Tag Proposal
 ICC Votable Proposal Submission Colorimetric Intent Image State Tag Proposal Proposers: Jack Holm, Eric Walowit & Ann McCarthy Date: 16 June 2006 Proposal Version 1.2 1. Introduction: The ICC v4 specification
Digital Image Processing Color Models &Processing
 Digital Image Processing Color Models &Processing Dr. Hatem Elaydi Electrical Engineering Department Islamic University of Gaza Fall 2015 Nov 16, 2015 Color interpretation Color spectrum vs. electromagnetic
Color , , Computational Photography Fall 2017, Lecture 11
 Color http://graphics.cs.cmu.edu/courses/15-463 15-463, 15-663, 15-862 Computational Photography Fall 2017, Lecture 11 Course announcements Homework 2 grades have been posted on Canvas. - Mean: 81.6% (HW1:
Vision Science I Exam 2 31 October 2016
 Vision Science I Exam 2 31 October 2016 1) Mr. Jack O Lantern, pictured here, had an unfortunate accident that has caused brain damage, resulting in unequal pupil sizes. Specifically, the right eye is
Exercise NMCGJ: Image Processing
 Exercise NMCGJ: Image Processing A digital picture (or image) is internally stored as an array or a matrix of pixels (= picture elements), each of them containing a specific color. This exercise is devoted
Digital Imaging Alliance
 Digital Imaging Alliance 1 2 Camera Calibration & Profiling Little Things Matter! Minor improvements can contribute! toward our quest for perfection! 3 Camera Calibration & Profiling What"s the problem?!
PLazeR. a planar laser rangefinder. Robert Ying (ry2242) Derek Xingzhou He (xh2187) Peiqian Li (pl2521) Minh Trang Nguyen (mnn2108)
 Derek Xingzhou He (xh2187) Peiqian Li (pl2521) Minh Trang Nguyen (mnn2108)") PLazeR a planar laser rangefinder Robert Ying (ry2242) Derek Xingzhou He (xh2187) Peiqian Li (pl2521) Minh Trang Nguyen (mnn2108) Overview & Motivation Detecting the distance between a sensor and objects
PLazeR a planar laser rangefinder Robert Ying (ry2242) Derek Xingzhou He (xh2187) Peiqian Li (pl2521) Minh Trang Nguyen (mnn2108) Overview & Motivation Detecting the distance between a sensor and objects
Color Mixer Kit. (Order Code CM-OEK)
") (Order Code CM-OEK) Color Mixer Kit Experiments in additive and subtractive color mixing can be easily and conveniently carried out using a simple accessory set with parts from the Vernier Optics Expansion
(Order Code CM-OEK) Color Mixer Kit Experiments in additive and subtractive color mixing can be easily and conveniently carried out using a simple accessory set with parts from the Vernier Optics Expansion
Colour. Why/How do we perceive colours? Electromagnetic Spectrum (1: visible is very small part 2: not all colours are present in the rainbow!
 Colour What is colour? Human-centric view of colour Computer-centric view of colour Colour models Monitor production of colour Accurate colour reproduction Colour Lecture (2 lectures)! Richardson, Chapter
CPSC 4040/6040 Computer Graphics Images. Joshua Levine
 CPSC 4040/6040 Computer Graphics Images Joshua Levine levinej@clemson.edu Lecture 04 Displays and Optics Sept. 1, 2015 Slide Credits: Kenny A. Hunt Don House Torsten Möller Hanspeter Pfister Agenda Open
IMPROVING AUTOMOTIVE INSPECTION WITH LIGHT & COLOR MEASUREMENT SYSTEMS
 IMPROVING AUTOMOTIVE INSPECTION WITH LIGHT & COLOR MEASUREMENT SYSTEMS Matt Scholz, Radiant Vision Systems February 21, 2017 Matt.Scholz@RadiantVS.com 1 TODAY S SPEAKER Matt Scholz Business Leader, Automotive
Colors in Images & Video
 LECTURE 8 Colors in Images & Video CS 5513 Multimedia Systems Spring 2009 Imran Ihsan Principal Design Consultant OPUSVII www.opuseven.com Faculty of Engineering & Applied Sciences 1. Light and Spectra
Imaging Optics Fundamentals
 Imaging Optics Fundamentals Gregory Hollows Director, Machine Vision Solutions Edmund Optics Why Are We Here? Topics for Discussion Fundamental Parameters of your system Field of View Working Distance
Unit 8: Color Image Processing
 Unit 8: Color Image Processing Colour Fundamentals In 666 Sir Isaac Newton discovered that when a beam of sunlight passes through a glass prism, the emerging beam is split into a spectrum of colours The
A High-Speed Imaging Colorimeter LumiCol 1900 for Display Measurements
 A High-Speed Imaging Colorimeter LumiCol 19 for Display Measurements Shigeto OMORI, Yutaka MAEDA, Takehiro YASHIRO, Jürgen NEUMEIER, Christof THALHAMMER, Martin WOLF Abstract We present a novel high-speed
Images. CS 4620 Lecture Kavita Bala w/ prior instructor Steve Marschner. Cornell CS4620 Fall 2015 Lecture 38
 Images CS 4620 Lecture 38 w/ prior instructor Steve Marschner 1 Announcements A7 extended by 24 hours w/ prior instructor Steve Marschner 2 Color displays Operating principle: humans are trichromatic match
Multimedia Systems Color Space Mahdi Amiri March 2012 Sharif University of Technology
 Course Presentation Multimedia Systems Color Space Mahdi Amiri March 2012 Sharif University of Technology Physics of Color Light Light or visible light is the portion of electromagnetic radiation that
QUANTITATIVE IMAGE TREATMENT FOR PDI-TYPE QUALIFICATION OF VT INSPECTIONS
 QUANTITATIVE IMAGE TREATMENT FOR PDI-TYPE QUALIFICATION OF VT INSPECTIONS Matthieu TAGLIONE, Yannick CAULIER AREVA NDE-Solutions France, Intercontrôle Televisual inspections (VT) lie within a technological
Images and Displays. Lecture Steve Marschner 1
 Images and Displays Lecture 2 2008 Steve Marschner 1 Introduction Computer graphics: The study of creating, manipulating, and using visual images in the computer. What is an image? A photographic print?
Human Vision, Color and Basic Image Processing
 Human Vision, Color and Basic Image Processing Connelly Barnes CS4810 University of Virginia Acknowledgement: slides by Jason Lawrence, Misha Kazhdan, Allison Klein, Tom Funkhouser, Adam Finkelstein and
Tech Paper. Anti-Sparkle Film Distinctness of Image Characterization
 Tech Paper Anti-Sparkle Film Distinctness of Image Characterization Anti-Sparkle Film Distinctness of Image Characterization Brian Hayden, Paul Weindorf Visteon Corporation, Michigan, USA Abstract: The
LECTURE 07 COLORS IN IMAGES & VIDEO
 MULTIMEDIA TECHNOLOGIES LECTURE 07 COLORS IN IMAGES & VIDEO IMRAN IHSAN ASSISTANT PROFESSOR LIGHT AND SPECTRA Visible light is an electromagnetic wave in the 400nm 700 nm range. The eye is basically similar
Colour. Electromagnetic Spectrum (1: visible is very small part 2: not all colours are present in the rainbow!) Colour Lecture!
 Colour Lecture!") Colour Lecture! ITNP80: Multimedia 1 Colour What is colour? Human-centric view of colour Computer-centric view of colour Colour models Monitor production of colour Accurate colour reproduction Richardson,
Colour Lecture! ITNP80: Multimedia 1 Colour What is colour? Human-centric view of colour Computer-centric view of colour Colour models Monitor production of colour Accurate colour reproduction Richardson,
SIM University Projector Specifications. Stuart Nicholson System Architect. May 9, 2012
 2012 2012 Projector Specifications 2 Stuart Nicholson System Architect System Specification Space Constraints System Contrast Screen Parameters System Configuration Many interactions Projector Count Resolution
Viewing conditions - Graphic technology and photography
 Viewing conditions - Graphic technology and photography (Revision of ISO 3664-1975, Photography - Illumination conditions for viewing colour transparencies and their reproductions) i Contents Page Foreword...
Light. intensity wavelength. Light is electromagnetic waves Laser is light that contains only a narrow spectrum of frequencies
 Image formation World, image, eye Light Light is electromagnetic waves Laser is light that contains only a narrow spectrum of frequencies intensity wavelength Visible light is light with wavelength from
Vision. The eye. Image formation. Eye defects & corrective lenses. Visual acuity. Colour vision. Lecture 3.5
 Lecture 3.5 Vision The eye Image formation Eye defects & corrective lenses Visual acuity Colour vision Vision http://www.wired.com/wiredscience/2009/04/schizoillusion/ Perception of light--- eye-brain
Color & Compression. Robin Strand Centre for Image analysis Swedish University of Agricultural Sciences Uppsala University
 Color & Compression Robin Strand Centre for Image analysis Swedish University of Agricultural Sciences Uppsala University Outline Color Color spaces Multispectral images Pseudocoloring Color image processing
Color Science. What light is. Measuring light. CS 4620 Lecture 15. Salient property is the spectral power distribution (SPD)
") Color Science CS 4620 Lecture 15 1 2 What light is Measuring light Light is electromagnetic radiation Salient property is the spectral power distribution (SPD) [Lawrence Berkeley Lab / MicroWorlds] exists
Color Science CS 4620 Lecture 15 1 2 What light is Measuring light Light is electromagnetic radiation Salient property is the spectral power distribution (SPD) [Lawrence Berkeley Lab / MicroWorlds] exists
Exercise questions for Machine vision
 Exercise questions for Machine vision This is a collection of exercise questions. These questions are all examination alike which means that similar questions may appear at the written exam. I ve divided
12 Color Models and Color Applications. Chapter 12. Color Models and Color Applications. Department of Computer Science and Engineering 12-1
 Chapter 12 Color Models and Color Applications 12-1 12.1 Overview Color plays a significant role in achieving realistic computer graphic renderings. This chapter describes the quantitative aspects of color,
Digital Image Processing
 Part 1: Course Introduction Achim J. Lilienthal AASS Learning Systems Lab, Dep. Teknik Room T1209 (Fr, 11-12 o'clock) achim.lilienthal@oru.se Course Book Chapters 1 & 2 2011-04-05 Contents 1. Introduction
Photography and graphic technology Extended colour encodings for digital image storage, manipulation and interchange. Part 4:
 Provläsningsexemplar / Preview TECHNICAL SPECIFICATION ISO/TS 22028-4 First edition 2012-11-01 Photography and graphic technology Extended colour encodings for digital image storage, manipulation and interchange
Evaluating Commercial Scanners for Astronomical Images. The underlying technology of the scanners: Pixel sizes:
 Evaluating Commercial Scanners for Astronomical Images Robert J. Simcoe Associate Harvard College Observatory rjsimcoe@cfa.harvard.edu Introduction: Many organizations have expressed interest in using
Thomas G. Cleary Building and Fire Research Laboratory National Institute of Standards and Technology Gaithersburg, MD U.S.A.
 Thomas G. Cleary Building and Fire Research Laboratory National Institute of Standards and Technology Gaithersburg, MD 20899 U.S.A. Video Detection and Monitoring of Smoke Conditions Abstract Initial tests
Colour Management Workflow
 Colour Management Workflow The Eye as a Sensor The eye has three types of receptor called 'cones' that can pick up blue (S), green (M) and red (L) wavelengths. The sensitivity overlaps slightly enabling
Determining MTF with a Slant Edge Target ABSTRACT AND INTRODUCTION
 Determining MTF with a Slant Edge Target Douglas A. Kerr Issue 2 October 13, 2010 ABSTRACT AND INTRODUCTION The modulation transfer function (MTF) of a photographic lens tells us how effectively the lens
Color Image Processing
 Color Image Processing Selim Aksoy Department of Computer Engineering Bilkent University saksoy@cs.bilkent.edu.tr Color Used heavily in human vision. Visible spectrum for humans is 400 nm (blue) to 700
Introduction to Lighting
 Introduction to Lighting IES Virtual Environment Copyright 2015 Integrated Environmental Solutions Limited. All rights reserved. No part of the manual is to be copied or reproduced in any form without
Bias errors in PIV: the pixel locking effect revisited.
 Bias errors in PIV: the pixel locking effect revisited. E.F.J. Overmars 1, N.G.W. Warncke, C. Poelma and J. Westerweel 1: Laboratory for Aero & Hydrodynamics, University of Technology, Delft, The Netherlands,
technology meets pathology Institute of Pathology, Charité Universitätsmedizin Berlin, Berlin, Germany 3 Overview
 ASSESSMENT OF TECHNICAL PARAMETERS A. Alekseychuk 1, N. Zerbe 2, Y. Yagi 3 1 Computer Vision and Remote Sensing, TU Berlin, Berlin, Germany 2 Institute of Pathology, Charité Universitätsmedizin Berlin,
Lecture 2 Digital Image Fundamentals. Lin ZHANG, PhD School of Software Engineering Tongji University Fall 2016
 Lecture 2 Digital Image Fundamentals Lin ZHANG, PhD School of Software Engineering Tongji University Fall 2016 Contents Elements of visual perception Light and the electromagnetic spectrum Image sensing
Acquisition and representation of images
 Acquisition and representation of images Stefano Ferrari Università degli Studi di Milano stefano.ferrari@unimi.it Elaborazione delle immagini (Image processing I) academic year 2011 2012 Electromagnetic
Cvision 2. António J. R. Neves João Paulo Silva Cunha. Bernardo Cunha. IEETA / Universidade de Aveiro
 Cvision 2 Digital Imaging António J. R. Neves (an@ua.pt) & João Paulo Silva Cunha & Bernardo Cunha IEETA / Universidade de Aveiro Outline Image sensors Camera calibration Sampling and quantization Data
CS6640 Computational Photography. 6. Color science for digital photography Steve Marschner
 CS6640 Computational Photography 6. Color science for digital photography 2012 Steve Marschner 1 What visible light is One octave of the electromagnetic spectrum (380-760nm) NASA/Wikimedia Commons 2 What
VU Rendering SS Unit 8: Tone Reproduction
 VU Rendering SS 2012 Unit 8: Tone Reproduction Overview 1. The Problem Image Synthesis Pipeline Different Image Types Human visual system Tone mapping Chromatic Adaptation 2. Tone Reproduction Linear methods