DISC QC/QA Program for Digital Imaging Systems using the DR Radchex Plus Meter
|
|
|
- Juliana Montgomery
- 6 years ago
- Views:
Transcription


1 DISC QC/QA Program for Digital Imaging Systems using the DR Radchex Plus Meter Revision Date: January 5th,
2 Table of Contents Section A: Preliminary Setup Requirements... 4 Tools Required:... 4 Procedure:... 4 Step 1:... 4 Step 2:... 4 Step 3:... 4 Step 4:... 4 Step 5:... 5 Section B: DISC Image Optimizer Auto Analysis Software... 7 Abstract:... 7 Theory of operation:... 7 Using the DISC Image Optimizer Software:... 8 Description of the Optimized Image and standardized metrics:... 9 Using the DISC Image Optimizer Software for regular QA: Section C: In-house Image Analysis Program Abstract Sample Report Description of values produced by the Report Study Description: Exposure Description: DR Radchex Measurements: Original Dicom image metrics: Optimized Image Homogeneous Area metrics: High Contrast Resolution: Dynamic Step Wedge: Low Contrast Test Objects: Step Wedge MPV Graph: Step Wedge CNR Graph Low Contrast CNR Graph: Section D: DR Plate System QC Abstract Using the reports to characterize the performance of the DR plate system
3 Determining Maximum suggested plate dose Determining Minimum suggested plate dose Calculating metrics relating to plate system sensitivity Section E: Regular QA for DR Radiographic Systems Abstract Setting up benchmark technique for in-bucky AEC driven exposures Setting up benchmark technique for manual tabletop exposures Using the recorded metrics to do regular QA on DR systems Application Note
4 Section A: Preliminary Setup Requirements Tools Required: - DR Radchex Plus Meter - Laptop computer with DISC Image Optimizer Software installed Procedure: Step 1: Establish a practical, reliable means of retrieving test images from various DR imaging systems and storing them at a location where they can be easily retrieved for image analysis and scoring using the DISC Image Optimizer Software. Step 2: Ensure that every DR station and/or plate is uniquely identifiable in the Dicom header section to ensure that the reports can be reliably traced back to origin system/plate. Step 3: Come up with a way to include the Entrance and Exit Dose in the Dicom header section for automatic inclusion in the reports. Step 4: Set up a custom QC/QA Exam button for the DR Radchex Plus Meter Purpose: Setting up a custom exam button offers a practical means of retrieving the digital information from the DR Plate system without any interference from digital enhancements. Method: The user selectable parameters for this custom QC/QA exam button should be set up as follows: - Set Contrast (tone) Curve selection to Linear. This eliminates digital enhancements created by using non-linear Contrast (tone) Curve selections. - Turn off or disable all other digital enhancements. - Set up the appropriate window level and window width using the instructions below. Note: Steps a) to g) are different for fixed plates and moveable plates but the rest of the steps are the same for both. Fixed In-Bucky DR Plate Instructions: a) Center x-ray tube to bucky b) Set SID appropriate for bucky c) Position DR Radchex on bucky with DR Radchex head end towards head end of bucky d) Center DR Radchex (DISC Plus Phantom) to bucky e) Collimate x-ray beam to 30 x 30 cm (size of DISC Plus Phantom) f) Set 80 kvp. If your x-ray generator doesn t have 80 kvp selection, choose the next higher kvp 4
5 g) Use manual technique and set 10 mas Skip to step h) Moveable DR plates (tabletop technique) Instructions: a) Position DR plate on tabletop b) Center x-ray tube over DR plate c) Set SID to 100 cm d) Position DR Radchex on top of DR Plate with head end of DR Radchex towards anode of x-ray tube and center DR Radchex (DISC Plus Phantom) to DR Plate e) Collimate x-ray beam to 30 x 30 cm (size of DISC Plus Phantom) f) Set 80 kvp. If your x-ray generator doesn t have 80 kvp selection, choose the next higher kvp g) Use manual technique and set 4 mas Fixed In-Bucky and Moveable DR Plate Instructions continued: h) Select custom QC/QA Exam button. (Described in Section A step 4) i) Reset the DR Radchex Meter and take test exposure j) Observe calculated HVL value on DR Radchex Plus. If the HVL value is within 2.5 to 4.5 then continue to step k). If HVL value is not within the 2.5 to 4.5 range, then the KV calibration of the x- ray generator may have to be verified or the tube head filtration may have to be adjusted. Once corrective action has been taken proceed to step k) k) Reset the DR Radchex meter and take a test exposure. Observe the resultant test image at acquisition station and adjust window level for optimal viewing brightness and set window width wide enough to visualize all seventeen steps of the dynamic range step wedge. l) Save test image and analyze test image with DISC Image Optimizer Software (see detailed instructions on using DISC Image Optimizer Software in Section B). Once analysis is complete, several metrics will be shown. m) Observe the contrast factor metric. If the contrast factor is greater than 1.0 then you will have to increase the window width at the acquisition station and repeat Step l. You can now use this custom QA/QC Exam button for all subsequent QC and QA tests. Now any changes to our optimized reference image and/or standardized objective metrics directly reflect changes in the information produced by the digital detector system itself. Step 5: Establish DR Plate orientation. Purpose: Because of geometry and x-ray tube anode heal effect, consistent DR plate orientation with respect to the x-ray tube anode is important in order to eliminate variability due to inconsistent DR plate orientation. 5
6 Method: Devise a means of identifying which end of the DR Plate should point towards the x-ray tube anode. This is especially important for DR plates that can be removed from the bucky for tabletop work. We recommend that you use the fixed SNR metric from the DISC Image Optimizer Software to determine the DR plate orientation. Please follow instructions below to determine plate orientation (removable plates only). a) Position DR Plate on tabletop b) Center x-ray tube over DR Plate c) Set SID to 100 cm d) Position DR Radchex on top of DR plate and center DR Radchex (DISC Plus Phantom) to DR Plate (Head end of the DR Radchex toward X-ray tube anode) e) Collimate x-ray beam to 30 x 30 cm (size of DISC Plus Phantom) f) Set ~80 kvp (as close as possible) g) Use manual technique and set 4 mas h) Select custom QA/QC Exam button i) Take test exposure and analyze with DISC Image Optimizer Software j) Document the Fixed SNR Value (plate uniformity) k) Temporarily remove the DR Radchex Plus l) Rotate the DR plate 180 Degrees and center to x-ray beam m) Position DR Radchex on top of DR plate and center DR Radchex (DISC Plus Phantom) to DR Plate (Head end of the DR Radchex toward X-ray tube anode) n) Take test exposure and analyze with DISC Image Optimizer Software o) Document the Fixed SNR value p) Select the plate orientation that yielded the highest fixed SNR value (best uniformity) q) Identify the end of the plate that should point towards the x-ray tubes anode. Note: This is likely the plate orientation used by service engineers when they initialized the DR plate system (flat field correction). Now that your plate orientation is identified, you will be able to ensure that both the plate orientation as well as the DR Radchex orientation will be consistent over time. 6
7 Section B: DISC Image Optimizer Auto Analysis Software Abstract: The appearance of Dicom images are highly influenced by brightness and contrast levels (simple post processing). Attempting to visually compare the performance of various DR plate systems (subjective analysis) is virtually impossible unless the same levels of brightness and contrast are applied to the various Dicom images. The appearance of Dicom images are also highly influenced by digital enhancement post processing. When attempting to compare the performance of DR plate systems, the influence of various digital enhancements can be eliminated by simply turning those digital enhancements off or disabling them. The DISC auto analysis software packages are designed such that when the user analyzes the simple unenhanced Dicom images, the optimized image produced as well as the objective data are both standardized and reflect the image information produced by the DR plate system itself without interference from any digital enhancements. The subjective scoring as well as the objective scoring can now both be used to compare the performance of various DR plate systems. Theory of operation: When processing simple Dicom images, the DISC Image Optimizer Software will standardize the orientation of the test image. Subsequently the software will standardize the formatting of the pixel values within the Dicom image (the higher the x-ray dose to the plate, the higher the pixel value). The DISC Image Optimizer Software will then retrieve the log pixel values from the Dicom image and apply a standardizing formula to the pixel values as shown below: Pixel value x (scaling factor) + (offset constant) The scaling factor standardizes contrast while the offset constant standardizes the image brightness. The Image Optimizer Software will then use the standardized pixel values to construct an optimized reference image that can be used for subjective analysis. Since the brightness and contrast of the optimized reference images are standardized, any visual differences in and amongst the reference images can be directly attributed to the DR plate system without any interference from digital enhancements. The software will also use the standardized pixel values from various locations in the optimized image to calculate standardized objective image metrics. The objective image metrics directly reflect the data produced by the DR plate itself without interference from the digital enhancements. 7


8 Using the DISC Image Optimizer Software: 1. Install the DISC Image Optimizer Software using the supplied USB stick. 2. Once installation has completed, initiate the software from the desktop shortcut or from the programs menu. 3. There are 2 methods to view/open Dicom files in the DISC Image Optimizer Software. Drag and drop the Dicom image file into the window, or click on the Open a file button and navigate to where the image is saved and click on it. 4. There is a preview option available in the bottom right hand corner of the screen. This option is mainly used if the Image Optimizer Software is encountering issues when analyzing the Dicom images. The current version of the DISC Image Optimizer Software will compensate for rotated images, but it will not correct for mirrored images (where writing is backwards). When the preview option is selected, there are check boxes that allow the user to manually mirror the image before analyzing if it is necessary. NOTE: Mirroring will be automatically corrected in an upcoming release of the software. 8

9 5. If the preview option is not checked, the image will be automatically processed when it s dragged into the window or opened using the open file button. If the preview option is selected, ensure that the image is not mirrored, and then click on the Process button to analyze image. After several seconds the optimizer will display the results of the analysis. Note: At any time the user can abort the current file and load a new file by clicking on the Load New File button on the bottom left corner of the screen. Description of the Optimized Image and standardized metrics: Once a test Dicom image has been processed / analyzed, the Image Optimizer Software package displays two images. The image on the left is the original Dicom test image (rotated and cropped), and the image on the right is the optimized/standardized image. The optimized image is always a positive image. The brightness and contrast of the optimized reference image are standardized such that step 9 of the DISC Plus Phantom s dynamic range step wedge falls on the viewing monitors gray scale value of 128 (mid brightness) and step 12 of the dynamic step wedge falls on gray scale step 90 of the viewing monitor. The Image Optimizer Software also displays several standardized objective metrics, which are described below. Fixed SNR value: This value reflects the level of low spatial frequency fixed noise (image uniformity). The higher this value, the more uniform the image is within the measuring area. For tabletop test images typical values should be > 50. This value does not change substantially with changing plate dose levels, but because of geometry and x-ray tube anode heal effect, this value may change significantly with changes in SID and DR plate orientation. Additionally for in bucky test images, this value is also affected by the x-ray absorption characteristics of the tabletop, grid, and AEC pickup. 9
10 Random SNR values (Random SNR and Random SNR2): These values reflect the level of high spatial frequency image noise within the image measuring area. Since a significant portion of high spatial frequency noise is random noise, these values will change with plate dose levels. With appropriate tabletop protocols, these values can be used as a guideline to determine appropriate plate dose for individual DR plate systems. Based on our experience, the Random SNR2 value should be within a range of approximately 30 to 42. If the value is higher than 42, the plate dose may be too high and the area of the DR plate under Step #1 of DISC Plus Phantom dynamic step wedge may be saturated. If the Random SNR2 value is substantially below 30, the dose to the DR plate may be too low and excessive image noise may deteriorate the quality of the image. Note: This suggested Random SNR2 value range is only valid for tabletop techniques while analyzing unenhanced Dicom images. With in-bucky techniques, the grid can change these Random SNR values. Contrast Factor: Since the optimized image and the standardized metrics provided do not change with changes in the original Dicom test images contrast, a contrast factor is displayed which allows the user to monitor changes in the original Dicom images contrast over time (QA). If the contrast factor is 1.00 then this means that the contrast of the original test image is the same as the DISC Optimized image. If the contrast factor is less than 1.00, this means that the contrast of the original test image is lower than that of the DISC optimized image and vice versa. Brightness Factor: Since the optimized image and the standardized metrics provided do not change with changes in the original Dicom test images brightness, a brightness factor is displayed which allows users to monitor changes in the original Dicom test images brightness over time (QA). If the brightness factor is 1.00, then this means that the brightness of the original Dicom test image is the same as the DISC optimized image. If the brightness factor is lower than 1.00, this means that the brightness of the original test image is lower than the brightness of the DISC optimized image. Using the DISC Image Optimizer Software for regular QA: Taking test images and analyzing them with the DISC Image Optimizer Software will allow the user to track several variables over time as shown below. Ø Detecting any image artifacts (subjective) Ø High contrast resolution (subjective) Ø Low spatial frequency noise (objective) Ø High spatial frequency noise (objective) Ø Changes in contrast (objective) Ø Changes in brightness (objective) 10
11 Entering the mas as well as the entrance and exit dose values produced by the DR Radchex Plus in to the provided Excel templates will allow the user to also track several variables relating to the x-ray tube over time. Ø Changes in kvp Ø Changes in tube head filtration Ø Changes in AEC techniques Ø Changes in manual techniques Ø Changes in tube output Ø Changes in SID 11

12 Section C: In-house Image Analysis Program Abstract For the DR Radchex Plus users that require a more in depth analysis of their Dicom test images, DISC offers a service where the customer can send their test Dicom images to DISC. DISC would then analyze the Dicom test images and provide a detailed report to the user. The DISC In-house Image Analysis Program works in the same manner as the DISC Image Optimizer Software (refer to Section B Abstract and Theory of Operation), however the in-house software calculates many more objective image scoring metrics and it produces a detailed report which is then sent back to the user. Sample Report 12
13 13
14 Description of values produced by the Report Study Description: Retrieved form the Dicom header. There is enough information contained to easily differentiate individual plates and locations. Exposure Description: Values Retrieved from Dicom header. DR Radchex Measurements: Values retrieved from Dicom header. The entrance and exit dose values have to be entered in the Dicom header before storing the test image. This should have been established on page 1 in procedure 3. 14
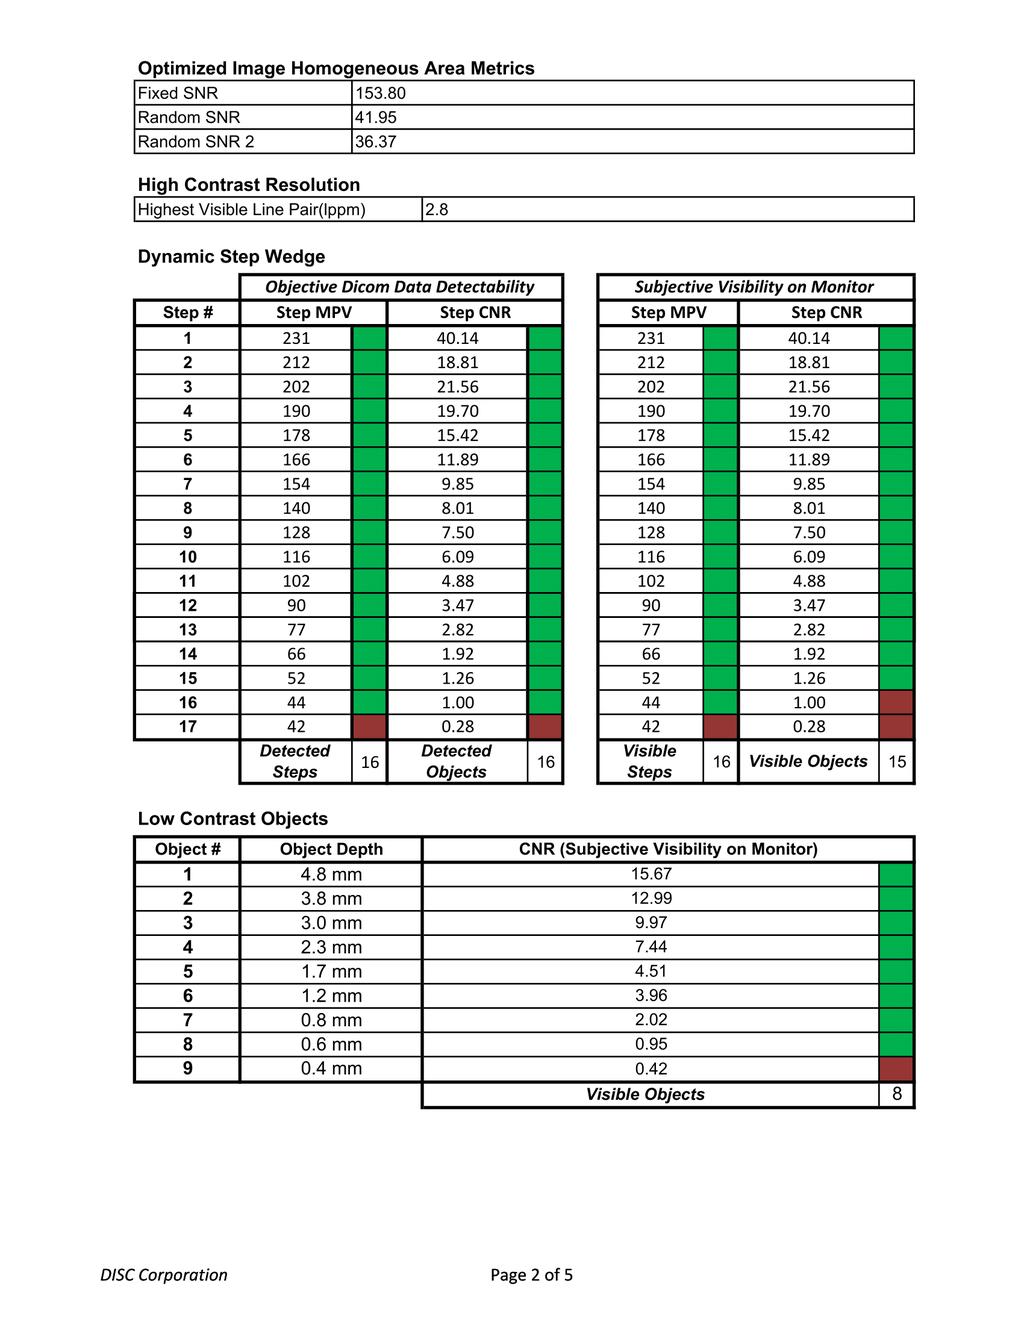
15 Original Dicom image metrics: Scale Factor: This value describes the magnification of the test image. A scale factor of ~ 1.03 indicates that the DR Radchex is positioned directly on top of the DR plate. Scale factors of greater than 1.05 typically indicate in-bucky techniques. Brightness Factor: Since the optimized image and the standardized metrics provided do not change with changes in the original Dicom test images brightness, a brightness factor is displayed which allows users to monitor changes in the original Dicom test images brightness over time (QA). If the brightness factor is 1.00, then this means that the brightness of the original Dicom test image is the same as the DISC optimized image. If the brightness factor is lower than 1.00, this means that the brightness of the original test image is lower than the brightness of the DISC optimized image. Contrast Factor: Since the optimized image and the standardized metrics provided do not change with changes in the original Dicom test images contrast, a contrast factor is displayed which allows the user to monitor changes in the original Dicom images contrast over time (QA). If the contrast factor is 1.00 then this means that the contrast of the original test image is the same as the DISC Optimized image. If the contrast factor is less than 1.00, this means that the contrast of the original test image is lower than that of the DISC optimized image. Optimized Image Homogeneous Area metrics: Fixed SNR: This value reflects the level of low spatial frequency fixed noise (image uniformity). The higher this value, the more uniform the image is within the measuring area. For tabletop test images typical values should be > 50. This value does not change substantially with changing plate dose levels, but because of geometry and x-ray tube anode heal effect, this value may change significantly with changes in SID and DR plate orientation. Additionally for in bucky test images, this value is also affected by the x-ray absorption characteristics of the tabletop, grid, and AEC pickup. Random SNR Values (Random SNR and SNR2): These values reflect the level of high spatial frequency image noise within the image measuring area. Since a significant portion of high spatial frequency noise is random noise, these values will change with plate dose levels. With appropriate tabletop protocols, these values can be used as a guideline to determine appropriate plate dose for individual DR plate systems. Based on our experience, the Random SNR2 value should be within a range of approximately 30 to 42. If the value is higher than 42, the plate dose may be too high and the area of the DR plate under Step #1 of DISC Plus Phantom dynamic step wedge may be saturated. If the Random SNR2 value is substantially below 30, the dose to the DR plate may be too low and excessive image noise may deteriorate the quality of the image. 15
16 Note: This suggested Random SNR2 value range is only valid for tabletop techniques while analyzing unenhanced Dicom images. With in-bucky techniques, the grid can change these Random SNR values. High Contrast Resolution: This value describes the highest visible line pair of the line pair test object. Dynamic Step Wedge: Objective Step MPV: These MPV values have the same scaling as a viewing monitors gray scale. A step is detected if the difference between it and the next step is 3 or greater. Objective Step CNR: These CNR values are used to determine the detectability of the test objects located within each step of the dynamic step wedge. A test object is detected if the CNR value is 0.95 or higher. Subjective Step MPV: These MPV values have the same scaling as a viewing monitor s gray scale with a range of 1 to 256. Any step, which has an objective MPV value of greater than 256, will appear on the subjective MPV as 256 (maximum gray scale step of viewing monitor). Subjective Step CNR: These CNR values are used to determine the visibility of the test objects located within each step of the dynamic step wedge. A test object is visible if the CNR value is 1.2 or higher. Low Contrast Test Objects: These CNR values describe the relative visibility of the 9 low contrast test objects. A test object is visible if the CNR value is 0.95 or higher. Step Wedge MPV Graph: This graph describes the relative shape of the dynamic step wedge contrast curve. Step Wedge CNR Graph This graph describes the relative detectability / visibility of the test objects located within the seventeen steps of the dynamic step wedge. With appropriate protocols, these step CNR values can be used as a guideline to determine appropriate plate dose range for various DR plate systems. If the plate dose is too high, the test object within step 1 will drop in CNR value due to that area of the plate saturated. If the plate dose is too low, you start losing object detectability in the higher steps due to excessive high spatial frequency noise (random noise). Low Contrast CNR Graph: This graph describes the relative visibility of the 9 low contrast test objects. Note: The higher the dose, the higher the CNR values. 16
17 Section D: DR Plate System QC Abstract Here we present a method of characterizing DR plate systems without interference from digital post processing or interference due to changes in x-ray test image contrast. The protocol, in Steps 1 to 10, is designed to ensure that the DISC Plus Phantom will be exposed to an x-ray beam that always has the same x-ray beam hardness over time. This will ensure that the subject contrast of the x-ray image remains constant over time. 1. Position DR plate on tabletop with appropriate orientation (described in number 5 of section A) 2. Center x-ray tube over DR plate 3. Set SID to 100 cm 4. Position DR Radchex Plus on top of DR plate with head end of DR Radchex towards anode of x-ray tube and center DR Radchex (DISC Plus Phantom) to DR plate 5. Collimate x-ray beam to 30 x 30 cm (size of visible portion of DISC Plus Phantom) 6. Set kvp to ~ 80 kvp 7. Use manual technique and set ~ 4 mas 8. Select custom QA/QC exam button (described in number 4 of Section A) 9. Reset DR Radchex meter, take a test exposure and observe calculate HVL metric on DR Radchex display. Note: By default the display shows entrance and exit dose. To view HVL and Dose Ratio you must quickly press and release the reset button 10. If the HVL value is not within recommended range of 3.00 to 4.00, readjust kvp and repeat step 9. The recommended kv range is 78kVp to 84kVp. Increasing the kvp increases the HVL value. If the HVL value cannot be achieved within the recommended kv range, the kv calibration of the x-ray generator may have to be verified or the tube head filtration may have to be adjusted. Once HVL value is within recommended range, proceed to step You will now be taking a series of 10 test images where the only difference in these images is dose level. The recommended approximate mas values for 10 images are: 2.0, 2.4, 3.0, 3.5, 4.2, 5.0, 6.0, 7.2, 8.6, and 10.0 Note: These recommended approximate mas values are scaled such that the dose difference from one test to the next is about 20%. Note: We will refer to these images as Image 1 to Image 10. Image 1 being the lowest dose to Image 10 being the highest. 17
18 12. For each target mas, follow the procedure below: a) Set target mas b) Reset DR Radchex meter and take a test image. c) Observe the entrance and exit dose on the DR Radchex Plus meter display and enter them into the images Dicom header (method determined on page 1 procedure step 3). d) Save the image. Repeat step 12 for each target mas. 13. Send Dicom test images to DISC for analysis. Once the images have been analyzed, we will the reports back to the user. Using the reports to characterize the performance of the DR plate system Determining Maximum suggested plate dose 1. Starting with Image 1, observe the CNR values for step 1 and step 2 of the dynamic step wedge 2. If the CNR value for step 1 is significantly higher than that of step 2, move on to Image Continue this procedure until you find the image where the CNR value of step1 is either equal to or less than the CNR value of step The dose applied to this image represents the maximum plate dose. Any further increase in plate dose would deteriorate image quality because of plate saturation under step 1 of the dynamic step wedge. Once the image that best represents maximum plate dose level has been determined, document the following objective metrics from the images associated report: EI value: Exit Dose (plate dose): Step Wedge Detected Objects: Low Contrast Visible Objects: Fixed SNR: Random SNR: Random SNR2: Highest visible line pair: Note: It would be a good idea to observe the image in the DISC Image Optimizer Software to ensure that there are no image artifacts. Determining Minimum suggested plate dose Typical DR systems can produce high quality image data at a much lower dose than the maximum suggested plate dose determined on the previous page. For this reason we believe that a minimum suggested plate dose should be determined. This can be accomplished using the Random SNR2 value from the reports. Based on our experience if an image produces a Random SNR 2 value of 30 or greater, the image quality is sufficient (high spatial frequency noise is sufficiently low). Observe the Random SNR 2 value from each of the test image reports. Find the image that produces a Random SNR 2 value closest to 30. Document the following values from that report: 18
19 EI value: Exit Dose: Random SNR 2 value: Calculating metrics relating to plate system sensitivity You can now use the values documented from maximum and minimum suggested plate dose determination to calculate metrics relating to plate system sensitivity. Plate EI Value range = EI value (min suggested plate dose) to EI value (max suggested plate dose) Plate Dose range = Exit Dose (min suggested plate dose) to Exit Dose (max suggested plate dose) Plate Sensitivity = Random SNR2 value (min suggested plate dose) / Exit Dose (min suggested plate dose) EI gain balance = EI value (max suggested plate dose) / Exit Dose (max suggested plate dose) We would suggest that if the above method is used on various DR plate systems, the resultant metrics will be standardized and mean the same thing on all various DR plate systems. If you do not have a regular QA program to monitor changes to the plate over time, we recommend that DR plate QC should be performed on a yearly basis. This will allow the user to track any long-term gradual changes to the DR plate system over time. Section E: Regular QA for DR Radiographic Systems 19
20 Abstract Here we present a method of tracking changes in the DR plate system, changes in brightness and contrast (Simple post processing) of the test images, as well as changes in the x-ray beam over time. This can be accomplished by taking a single exposure at regular intervals in time (i.e. weekly, monthly etc ) Setting up benchmark technique for in-bucky AEC driven exposures Before starting, ensure that the x-ray machine, as well as the AEC system, is well calibrated. 1. Center x-ray tube to bucky 2. Set SID appropriate for grid 3. If grid is interchangeable, document which grid you are using and ensure that this is the grid that will be used for all subsequent QA tests 4. Position DR Radchex on bucky with DR Radchex head end towards head end of bucky 5. Center DR Radchex (DISC plus phantom) to bucky 6. Collimate x-ray beam to 30 x 30 cm (size of DISC Plus Phantom) 7. Set ~ 80 kvp. If your x-ray machine does not have an 80 kvp selection, choose the next higher kvp selection 8. Turn AEC on and select center chamber and 0 density selector setting 9. Reset the DR Radchex Plus meter and take a test exposure. Observe the calculated HVL value on the DR Radchex display (quickly press and release reset button to display HVL and Dose Ratio). The HVL value should be within the range dictated by your local regulations. If the HVL value is not within this range, then the kv calibration of the x-ray generator may have to be verified or the tube head filtration may have to be adjusted. Once corrective measures have been taken, proceed to step Select custom QA/QC exam button (Described in Section A Step 4) 11. Reset the DR Radchex Plus meter and take a test exposure 12. Enter the entrance and exit dose from the DR Radchex meter into the test images Dicom header 13. Store the test image Note: If you are using the Excel templates supplied by DISC, you can record mas, entrance dose and exit dose at this time in the template. It is also possible to retrieve mas, entrance dose and exit dose from the Dicom images header at a later time. 20
21 14. You have now established your benchmark technique as well as your benchmark Dicom test image. In order to maintain consistency over time, document the SID that you used, the set kvp, the tube head added filtration, and for buckies with interchangeable grids, record the grid that you used. It is important that you use the same technique on all subsequent QA tests Benchmark Technique: SID used: Set kvp: Tube head added filtration: Grid used: AEC: On Chamber selected: Center Density Selector Setting: 0 Benchmark Technique Metrics Entrance Dose: Exit Dose: 15. Analyze your benchmark Image stored in step 13 using the DISC Image optimizer and record the following metrics: Benchmark Image Metrics Fixed SNR: Random SNR: Random SNR 2: Contrast Factor: Brightness Factor: Highest Visible Line Pair: Note: We suggest viewing the optimized image and ensure that there are no artifacts. Setting up benchmark technique for manual tabletop exposures Before starting, ensure that the x-ray machine is well calibrated. 1. Position DR Plate on tabletop and make sure that the DR plate is appropriately oriented (described in section A step 5) 2. Center x-ray tube over DR Plate 3. Set SID to 100 cm 4. Position DR Radchex on top of DR Plate with head end of the DR Radchex towards the anode end of the x-ray tube 5. Center DR Radchex (DISC Plus phantom) to DR plate 6. Collimate x-ray beam to 30 x 30 cm (size of DISC Plus Phantom) 7. Set ~ 80 kvp. If your x-ray machine does not have an 80 kvp selection, choose the next higher kvp selection 8. Select 4 mas 21
22 9. Reset the DR Radchex Plus meter and take a test exposure. Observe the calculated HVL value on the DR Radchex display (quickly press and release reset button to display HVL and Dose Ratio). The HVL value should be within the range dictated by your local regulations. If the HVL value is not within this range, then the kv calibration of the x-ray generator may have to be verified or the tube head filtration may have to be adjusted. Once corrective measures have been taken, proceed to step Select custom QA/QC exam button (Described in Section A step 4) 11. Reset the DR Radchex Plus meter and take a test exposure 12. Enter the entrance and exit dose from the DR Radchex meter into the test images Dicom header 13. Store the test image Note: If you are using the Excel templates supplied by DISC, you can record mas, entrance dose and exit dose at this time in the template. It is also possible to retrieve mas, entrance dose and exit dose from the Dicom images header at a later time. 14. You have now established your benchmark technique as well as your benchmark Dicom test image. In order to maintain consistency over time, document the set kvp and the tube head added filtration. It is important that you use the same technique on all subsequent QA tests Benchmark Technique: SID used: 100 cm Set kvp: Tube head added filtration: Set mas: 4.0 Benchmark Technique Metrics Entrance Dose: Exit Dose: 15. Analyze your benchmark Image stored in step 13 using the DISC Image optimizer and record the following metrics: Benchmark Image Metrics Fixed SNR: Random SNR: Random SNR 2: Contrast Factor: Brightness Factor: Highest Visible Line Pair: Note: We suggest viewing the optimized image and ensure that there are no artifacts. 22
23 Using the recorded metrics to do regular QA on DR systems The metrics recorded in the benchmark setup of your QA program will now be the benchmark metrics to which the metrics of subsequent QA test exposures will be compared. There are a total of 3 metrics used to monitor changes to the x-ray system and 6 metrics to monitor changes to the Dicom test image. The mas, entrance dose and exit dose metrics are used to monitor changes in the x-ray system. When these metrics are entered into the Excel template provided, the user can monitor changes in the following metrics: ü Changes in kvp ü Changes in tube head filtration ü Changes in SID ü Changes in tube output ü Changes in manual techniques ü Changes in AEC techniques The other 6 metrics allow the user to monitor changes relating to the Dicom test image: ü Fixed SNR: Changes in plate uniformity ü Random SNR and Random SNR 2: Changes in high spatial frequency image noise ü Contrast Factor: Changes in test Dicom image contrast ü Brightness Factor: Changes in test Dicom image brightness ü Highest Visible Line Pair: Changes in high contrast resolution Application Note If you detect any significant changes to the un-enhanced Dicom test image, the first thing to do is to check if there have been any significant changes in the x-ray system. Changes in the x-ray beam could be partly or wholly responsible for changes in the Dicom test image. However if there are no changes to the x-ray beam, then there is a high likelihood that there have been changes in the DR plate system. 23
Acceptance Testing of a Digital Breast Tomosynthesis Unit
 Acceptance Testing of a Digital Breast Tomosynthesis Unit 2012 AAPM Spring Clinical Meeting Jessica Clements, M.S., DABR Objectives Review of technology and clinical advantages Acceptance Testing Procedures
Digital Imaging started in the 1972 with Digital subtraction angiography Clinical digital imaging was employed from the 1980 ~ 37 years ago Amount of
 Digital Imaging started in the 1972 with Digital subtraction angiography Clinical digital imaging was employed from the 1980 ~ 37 years ago Amount of radiation to the population due to Medical Imaging
Nuclear Associates
 Nuclear Associates 07-649 CDRH Fluoroscopic Phantom Users Manual March 2005 Manual No. 07-649-1 Rev. 2 2004, 2005 Fluke Corporation, All rights reserved. Printed in U.S.A. All product names are trademarks
Exposure Indices and Target Values in Radiography: What Are They and How Can You Use Them?
 Exposure Indices and Target Values in Radiography: What Are They and How Can You Use Them? Definition and Validation of Exposure Indices Ingrid Reiser, PhD DABR Department of Radiology University of Chicago
I. PERFORMANCE OF X-RAY PRODUCTION COMPONENTS FLUOROSCOPIC ACCEPTANCE TESTING: TEST PROCEDURES & PERFORMANCE CRITERIA
 FLUOROSCOPIC ACCEPTANCE TESTING: TEST PROCEDURES & PERFORMANCE CRITERIA EDWARD L. NICKOLOFF DEPARTMENT OF RADIOLOGY COLUMBIA UNIVERSITY NEW YORK, NY ACCEPTANCE TESTING GOALS PRIOR TO 1st CLINICAL USAGE
COMPUTED RADIOGRAPHY CHAPTER 4 EFFECTIVE USE OF CR
 This presentation is a professional collaboration of development time prepared by: Rex Christensen Terri Jurkiewicz and Diane Kawamura New Technology https://www.youtube.com/watch?v=ptkzznazb 7U COMPUTED
Y11-DR Digital Radiography (DR) Image Quality
 Image Quality") Y11-DR Digital Radiography (DR) Image Quality Image quality is stressed for all systems in Safety Code 35. In the relevant sections Health Canada s advice is the manufacturer s recommended test procedures
Y11-DR Digital Radiography (DR) Image Quality Image quality is stressed for all systems in Safety Code 35. In the relevant sections Health Canada s advice is the manufacturer s recommended test procedures
STEREOTACTIC BREAST BIOPSY EQUIPMENT SURVEYS
 STEREOTACTIC BREAST BIOPSY EQUIPMENT SURVEYS JAMES A. TOMLINSON, M.S. Diagnostic Radiological Physicist American Board of Radiology Certified Medical Physics Consultants, Inc. Bio 28 yrs experience 100%
Practical Aspects of Medical Physics Surveys of Mammography Equipment and Facilities
 Practical Aspects of Medical Physics Surveys of Mammography Equipment and Facilities Melissa Martin, M.S., FAAPM, FACR, FACMP AAPM Annual Meeting - Philadelphia July 19, 2010 MO-B-204C-1 Educational Objectives
Mammography is a radiographic procedure specially designed for detecting breast pathology Approximately 1 woman in 8 will develop breast cancer over
 Mammography is a radiographic procedure specially designed for detecting breast pathology Approximately 1 woman in 8 will develop breast cancer over a lifetime Breast cancer screening programs rely on
Fire CR Calibration Guide
 1 Fire CR Calibration Guide This reference guide will guide you through the steps to complete the calibration for the Fire CR.. Getting Started: 1. Click on the Opal Icon on the Desktop. Figure 1 2. Once
SYLLABUS. TITLE: Equipment Operation I. DEPARTMENT: Radiologic Technology
 CODE: RADT 156 INSTITUTE: Health Science TITLE: Equipment Operation I DEPARTMENT: Radiologic Technology COURSE DESCRIPTION: This course covers the principles of equipment operation and maintenance of radiographic
MILADY. Product Data. Page 1 of 8
 Page 1 of 8 The MILADY Mammographic Unit offers the best quality-to-price ratio to our customers worldwide. The unit advanced technology together with the application of industrial production standards,
Nuclear Associates EZ CR-DIN Phantoms
 Nuclear Associates 07-605-7777 EZ CR-DIN Phantoms Users Manual August 2006 Manual No. 07-605-7777-1 Rev. 4 2006 Fluke Corporation, All rights reserved. Printed in U.S.A. All product names are trademarks
Investigation of the line-pair pattern method for evaluating mammographic focal spot performance
 Investigation of the line-pair pattern method for evaluating mammographic focal spot performance Mitchell M. Goodsitt, a) Heang-Ping Chan, and Bob Liu Department of Radiology, University of Michigan, Ann
Fully Automatic X-ray meter kvp, dose, rate, HVL and time Extremely easy to use. Unfors ThinX RAD for Radiographic Quality Control
 Fully Automatic X-ray meter kvp, dose, rate, HVL and time Extremely easy to use Unfors ThinX RAD for Radiographic Quality Control Unfors ThinX RAD No keys! No menus! Just position and expose! Unfors ThinX
Digital radiography (DR) post processing techniques for pediatric radiology
 post processing techniques for pediatric radiology") Digital radiography (DR) post processing techniques for pediatric radiology St Jude Children s Research Hospital Samuel Brady, MS PhD DABR samuel.brady@stjude.org Purpose Review common issues and solutions
Digital radiography (DR) post processing techniques for pediatric radiology St Jude Children s Research Hospital Samuel Brady, MS PhD DABR samuel.brady@stjude.org Purpose Review common issues and solutions
Nuclear Associates
 Nuclear Associates 07-647 R/F QC Phantom Operators Manual March 2005 Manual No. 07-647-1 Rev. 2 2004, 2005 Fluke Corporation, All rights reserved. All product names are trademarks of their respective companies
GE AMX 4+ Portable X-Ray
 GE AMX 4+ Portable X-Ray Typical Manufacturer s Picture GE Healthcare s AMX-4+ analog X-ray system provides high-performance in a compact, easy-to-maneuver package. The rotating arm and tube simplify positioning
Digital Imaging Considerations Computed Radiography
 Digital Imaging Considerations Digital Radiography Computed Radiography o Cassette based Direct or Indirect Digital Radiography o Cassetteless Computed Radiography 1 CR Image Acquisition Most like conventional
RADIOGRAPHIC EXPOSURE
 RADIOGRAPHIC EXPOSURE Receptor Exposure Receptor Exposure the that interacts with the receptor. Computed Radiography ( ) requires a. Direct Digital Radiography (DR) requires a. Exposure Indicators Exposure
Digital Radiography X-Ray System. X Twin with X Mobil Roesys GmbH [rshsmi] 1/11
![Digital Radiography X-Ray System. X Twin with X Mobil Roesys GmbH [rshsmi] 1/11](/thumbs/95/124313736.jpg "Digital Radiography X-Ray System. X Twin with X Mobil Roesys GmbH [rshsmi] 1/11") Digital Radiography X-Ray System 2017 Roesys GmbH [rshsmi] 1/11 1 General specifications The system is intended to be installed with floor mounted components only. It enables spacesaving installation without
Digital Radiography X-Ray System 2017 Roesys GmbH [rshsmi] 1/11 1 General specifications The system is intended to be installed with floor mounted components only. It enables spacesaving installation without
History of digital imaging
 CR/QA RADCHEX History of digital imaging Early, crude digital detectors were developed in the 1970 s Image quality was problematic Processing time of digital images was untenable Viewing, transfer and
Quality Control of Full Field Digital Mammography Units
 Quality Control of Full Field Digital Mammography Units Melissa C. Martin, M.S., FACMP, FACR, FAAPM Melissa@TherapyPhysics.com 310-612-8127 ACMP Annual Meeting Virginia Beach, VA May 2, 2009 History of
RAD 150 RADIOLOGIC EXPOSURE TECHNIQUE II
 RAD 150 RADIOLOGIC EXPOSURE TECHNIQUE II APPROVED 12/O2/2011 EFFECTIVE SPRING 2013-14 Prefix & Number RAD 150 Course Title: Radiologic Exposure Technique II & Lab Purpose of this submission: New Change/Updated
Overview of Safety Code 35
 Common Quality Control Procedures for All s Quality Control Procedures Film All s Daily Quality Control Tests Equipment Warm-up (D1) According to manufacturers instructions Can include auto calibration(d1)
Ansur TNT Users Manual. Plug-In
 Ansur TNT 12000 Plug-In Users Manual August 2009, Rev. 2, 12/09 2009 Fluke Corporation. All rights reserved. Specifications are subject to change without notice. All product names are trademarks of their
1. Carlton, Richard R., and Arlene M. Adler. Principles of Radiographic Imaging: An Art and a Science, 5th edition (2013).
.") CODE: RADT 151 INSTITUTE: Health Science TITLE: Radiographic Exposure DEPARTMENT: Radiologic Technology COURSE DESCRIPTION: This course covers the principles of radiographic exposure selection and manipulation
CODE: RADT 151 INSTITUTE: Health Science TITLE: Radiographic Exposure DEPARTMENT: Radiologic Technology COURSE DESCRIPTION: This course covers the principles of radiographic exposure selection and manipulation
Step By Step Guide PA Hand This tutorial will take you through the following steps.
 Step By Step Guide PA Hand This tutorial will take you through the following steps. Selecting a projection PA Hand Selecting the IR/detector from the Exposure panel Room Preparation Inviting the Patient
Diagnostic Imaging Specialists Corporation 163 St.Malo Street St.Malo, MB Canada R0A1T0
 Diagnostic Imaging Specialists Corporation 163 St.Malo Street St.Malo, MB Canada R0A1T0 Instruction Manual for DISC CR Radchex Meter (Wireless Version) Revision L: May 22 nd, 2007 CONTACT INFORMATION:
Step By Step Guide AP Supine Abdomen (Table bucky example) This tutorial will take you through the following steps.
 This tutorial will take you through the following steps.") Step By Step Guide AP Supine Abdomen (Table bucky example) This tutorial will take you through the following steps. Selecting a projection AP Supine Abdomen Selecting the IR/detector from the Exposure
Step By Step Guide AP Supine Abdomen (Table bucky example) This tutorial will take you through the following steps. Selecting a projection AP Supine Abdomen Selecting the IR/detector from the Exposure
4. Contrast is the. There must The function of contrast is to:. The types of contrast are.
 RADIOGRAPHIC VISIBILITY OF DETAIL STUDY QUESTIONS 1. What is visibility of detail? It is controlled by properties. What are the two factors that affect it? 2. What is sharpness of detail? It is controlled
Visibility of Detail
 Visibility of Detail Radiographic Quality Quality radiographic images represents the, and information is for diagnosis. The of the anatomic structures and the accuracy of their ( ) determine the overall
Operating Procedures for MICROCT1 Nikon XTH 225 ST
 Operating Procedures for MICROCT1 Nikon XTH 225 ST Ensuring System is Ready (go through to ensure all windows and tasks below have been completed either by you or someone else prior to mounting and scanning
Version 1.0. TechnicVR. Student Guide
 Version 1.0 TechnicVR s h a d e r w a r e. c o m Student Guide TechnicVR s h a d e r w a r e. c o m Student Guide shaderware 2008 PO Box 103 Saltburn Cleveland TS12 1WP w w w. s h a d e r w a r e. c o
of sufficient quality and quantity
 of sufficient quality and quantity The patient s body attenuates the beam as it passes though the body More energy is deposited in organs located near the entry of the beam than near the exit of the beam
GafChromic QuiCk Phantom with EBT3P/3+P Film and FilmQA Pro for Radiation Therapy Dosimetry Applications
 GafChromic QuiCk Phantom with EBT3P/3+P Film and FilmQA Pro for Radiation Therapy Dosimetry Applications I. SCOPE The protocol applies to GafChromic EBT3P and EBT3+P films exposed in GafChromic QuiCk Phantom
ECOVIEW 9 / ECOVIEW 9 PLUS Digital Radiographic System
 Co., LTD. 3F, Urbanlight B/D, 630, Eonju-ro, Gangnam-gu, Seoul, Korea 135-832 Factory at 621-14, Dochun-dong, Gwangsan-gu, Gwangju, Korea 506-301 TEL. : +82-70-7510-3400 FAX. : +82-70-8630-3420 sales@ecoray.kr
Nuclear Associates
 Nuclear Associates 07-706 Patient Phantom/Penetrometer System Users Manual March 2005 Manual No. 07-706-1 Rev. 2 2004, 2005 Fluke Corporation, All rights reserved. Printed in U.S.A. All product names are
X-ray investigation of crystal structures / Laue method with digital X-ray detector (XRIS) (Item No.: P )
 (Item No.: P )") X-ray investigation of crystal structures / Laue method with digital X-ray detector (XRIS) (Item No.: P2541602) Curricular Relevance Area of Expertise: Physik Education Level: Hochschule Topic: Moderne
X-ray investigation of crystal structures / Laue method with digital X-ray detector (XRIS) (Item No.: P2541602) Curricular Relevance Area of Expertise: Physik Education Level: Hochschule Topic: Moderne
Disclosures. Outline 7/31/2017. Current Implementation Status of IEC Standard : Exposure Index (EI) for Digital Radiography
 for Digital Radiography") Current Implementation Status of IEC Standard 62494-1: Exposure Index (EI) for Digital Radiography July 31, 2017 Ryan Fisher, PhD, DABR Katie Hulme, MS, DABR None Disclosures Outline Review of IEC Standard
Current Implementation Status of IEC Standard 62494-1: Exposure Index (EI) for Digital Radiography July 31, 2017 Ryan Fisher, PhD, DABR Katie Hulme, MS, DABR None Disclosures Outline Review of IEC Standard
TEP Principles of Digital X-ray Imaging
 Related topics exposure time, detector saturation, full well capacity, detector calibration, beam intensity, detector offset, pixel specific gain, attenuation and transmission, image processing. Principle
1 Introduction Installation... 4
 Table of contents 1 Introduction... 3 2 Installation... 4 3 Measurement set up... 5 3.1 Transmissive spatial light modulator...5 3.2 Reflective spatial light modulator...6 4 Software Functions/buttons...
Aspire HD. Program Manual. 2nd Edition - October 2012
 Quality Control 1 Aspire HD Quality Control Program Manual 2nd Edition - October 2012 Overview Installation of FDR Mammography QC Program Weekly Test 2 3 4 Quarterly Test 5 Semi-annual Test 6 Annual Test
IMPAX 6 DISPLAY TOOL LIST
 IMPAX 6 DISPLAY TOOL LIST IMPAX 6.0 TOOLS INDEX A Advance by Image Allows you to scroll from one image or frame to the next Advance by Page Pages through images in a large series, one screen at a time
ECOVIEW 9 / ECOVIEW 9 PLUS Digital Radiographic System
 ECORAY Co., LTD. 3F, Urbanlight B/D, 630, Eonju-ro, Gangnam-gu, Seoul, Korea 135-832 Factory at 621-14, Dochun-dong, Gwangsan-gu, Gwangju, Korea 506-301 TEL. : +82-70-7510-3400 FAX. : +82-70-8630-3420
Digital Radiography : Flat Panel
 Digital Radiography : Flat Panel Flat panels performances & operation How does it work? - what is a sensor? - ideal sensor Flat panels limits and solutions - offset calibration - gain calibration - non
Exposure System Selection
 Principles of Imaging Science II (RAD120) Exposure Systems Exposure System Selection Radiographic exposure is a very complex process Best technique systems manipulate one variable while holding others
LECTURE 1 The Radiographic Image
 LECTURE 1 The Radiographic Image Prepared by:- KAMARUL AMIN ABDULLAH @ ABU BAKAR UiTM Faculty of Health Sciences Medical Imaging Department 11/23/2011 KAMARUL AMIN (C) 1 Lesson Objectives At the end of
New spectral benefi ts, proven low dose
 New spectral benefi ts, proven low dose Philips MicroDose mammography SI, technical data sheet Philips MicroDose SI with single-shot spectral imaging is a fullfi eld digital mammography solution that delivers
Digital radiography. bucky table and wall stand as a dual detector or wireless system. Amadeo DR Systems
 Amadeo DR Systems with dicom PACS DX-R Software X-ray Systems for the Future Digital radiography with Amadeo R-DR including bucky table and wall stand as a dual detector or wireless system High contrast
Fig.2: Scanner VistaScan for image plates
 RADIOGRAPHIC INSPECTION OF WELDINGS BY DIGITAL SENSORS H. Thiele, H.-J. Friemel RADIS GmbH, Johanniskirchen, Germany Abstract: The newly available digital sensors for radiographic inspection are suitable
Image Display and Perception
 Image Display and Perception J. Anthony Seibert, Ph.D. Department of Radiology UC Davis Medical Center Sacramento, California, USA Image acquisition, display, & interpretation X-rays kvp mas Tube filtration
Collimation Assessment Using GAFCHROMIC XR-M2
 Collimation Assessment Using GAFCHROMIC XR-M2 I. Introduction A method of collimation assessment for GE Senographe full-field digital mammography (FFDM) systems is described that uses a self-developing
Teaching Digital Radiography and Fluoroscopic Radiation Protection
 Teaching Digital Radiography and Fluoroscopic Radiation Protection WCEC 20 th Student Educator Radiographer Conference Dennis Bowman, RT(R), CRT (R)(F) Community Hospital of the Monterey Peninsula (CHOMP)
EKA Laboratory Muon Lifetime Experiment Instructions. October 2006
 EKA Laboratory Muon Lifetime Experiment Instructions October 2006 0 Lab setup and singles rate. When high-energy cosmic rays encounter the earth's atmosphere, they decay into a shower of elementary particles.
X-RAYS - NO UNAUTHORISED ENTRY
 Licencing of premises Premises Refer Guidelines A radiation warning sign and warning notice, X-RAYS - NO UNAUTHORISED ENTRY must be displayed at all entrances leading to the rooms where x-ray units are
ISCapture User Guide. advanced CCD imaging. Opticstar
 advanced CCD imaging Opticstar I We always check the accuracy of the information in our promotional material. However, due to the continuous process of product development and improvement it is possible
INNOVATION BY DESIGN. Toshiba A History of Leadership REMOTE CONTROL R/F SYSTEM
 INNOVATION BY DESIGN For over 130 years, Toshiba has led the world in developing technology to improve the quality of life. This Made for Life TM commitment is reflected in our family of leading-edge imaging
Nuclear Associates
 Nuclear Associates 76-700 Digital Subtraction Angiography Phantom Users Manual March 2005 Manual No. 76-700-1 Rev. 2 2004, 2005 Fluke Corporation, All rights reserved. Printed in U.S.A. All product names
Half value layer and AEC receptor dose compliance survey in Estonia
 Half value layer and AEC receptor dose compliance survey in Estonia K. Kepler, A. Vladimirov Training Centre of Medical Physics, University of Tartu Testing Centre of the University of Tartu, Estonia E-mail:
CR Basics and FAQ. Overview. Historical Perspective
 Page: 1 of 6 CR Basics and FAQ Overview Computed Radiography is a term used to describe a system that electronically records a radiographic image. Computed Radiographic systems use unique image receptors
Ludlum Medical Physics
 Ludlum Medical Physics Medical Imaging Radiology QA Test Tools NEW LUDLUM PRODUCT LINE Medical Physics Products Medical Physics Products What are they? Products used to measure radiation output and to
Philips XPER FD10C R7.0.4
 Philips XPER FD10C R7.0.4 Reconditioned 2005 System- Upgraded to R7 in Oct 2010 The Allura Xper FD10 (Ceiling) single-plane cardiovascular system is comprised of a ceiling mounted C-arm stand and digital
Precision Performance Power
 ODYSSEY HF SERIES ULTRA High Frequency X-Ray Technology Precision Performance Power Innovations in Digital Imaging. TM STEP 1 Select anatomical region STEP 2 Select anatomical view STEP 3 Ready for exposure
User Manual Veterinary
 Veterinary Acquisition and diagnostic software Doc No.: Rev 1.0.1 Aug 2013 Part No.: CR-FPM-04-022-EN-S 3DISC, FireCR, Quantor and the 3D Cube are trademarks of 3D Imaging & Simulations Corp, South Korea,
Unfors EDD-30 Radiation Protection in Fluoroscopy
 Unfors EDD-30 Radiation Protection in Fluoroscopy Immediate Warning Decrease Your Dose Interventional radiology procedures are considered to be essential to medical diagnosis and treatment. It is recognized,
ODYSSEY HF SERIES. ULTRA High Frequency X-Ray Technology. Precision... Performance... Power. Innovations in Digital Imaging.
 ODYSSEY HF SERIES ULTRA High Frequency X-Ray Technology Precision... Performance... Power Innovations in Digital Imaging. TM STEP 1 Select anatomical region STEP 2 Select anatomical view STEP 3 Ready for
Quality Control for Stereotactic Breast Biopsy. Robert J. Pizzutiello, Jr., F.A.C.M.P. Upstate Medical Physics, Inc
 Quality Control for Stereotactic Breast Biopsy Robert J. Pizzutiello, Jr., F.A.C.M.P. Upstate Medical Physics, Inc. 716-924-0350 Methods of Imaging Guided Breast Biopsy Ultrasound guided, hand-held needle
Breast Tomosynthesis. Bob Liu, Ph.D. Department of Radiology Massachusetts General Hospital And Harvard Medical School
 Breast Tomosynthesis Bob Liu, Ph.D. Department of Radiology Massachusetts General Hospital And Harvard Medical School Outline Physics aspects of breast tomosynthesis Quality control of breast tomosynthesis
PLD5600A High Frequency Digital Gastrointestinal &DR System(630mA)
") PLD5600A High Frequency Digital Gastrointestinal &DR System(630mA) Application: Full support perspective, gastrointestinal spot film, GI (barium meal, barium enema), orthopedic photography, pediatrics
PLD5600A High Frequency Digital Gastrointestinal &DR System(630mA) Application: Full support perspective, gastrointestinal spot film, GI (barium meal, barium enema), orthopedic photography, pediatrics
DRX Plus Detectors: Going from Good to Great
 DRX Plus Detectors: Going from Good to Great Authors: Karin Töpfer, Tim Wojcik Introduction Carestream s introduction in 2009 of the world s first portable, wireless, cassette-sized detector the CARESTREAM
Test Equipment for Radiology and CT Quality Control Contents
 Test Equipment for Radiology and CT Quality Control Contents Quality Control Testing...2 Photometers for Digital Clinical Display QC...3 Primary Workstations...3 Secondary Workstations...3 Testing of workstations...3
Film Replacement in Radiographic Weld Inspection The New ISO Standard
 BAM Berlin Film Replacement in Radiographic Weld Inspection The New ISO Standard 17636-2 Uwe Ewert, Uwe Zscherpel, Mirko Jechow Requests and information to: uwez@bam.de 1 Outline - The 3 essential parameters
Get more from your images with Symphony Image Processing
 DIRECT RADIOGRAPHY The user-friendly DelWorks image acquisition and processing software possesses a wide range of tools for a variety of image manipulations. Its user interface simplifies every step of
see thoroughly, insure safety digital C-arm system Remote Compact Fully digital
 see thoroughly, insure safety digital C-arm system Remote Compact Fully digital OVERVIEW O V E R V I E W The Statif Pro DReam is a new radiographic concept equipped with a Flat Panel Detector (FPD) that
PERFORMANCE CHARACTERIZATION OF AMORPHOUS SILICON DIGITAL DETECTOR ARRAYS FOR GAMMA RADIOGRAPHY
 12 th A-PCNDT 2006 Asia-Pacific Conference on NDT, 5 th 10 th Nov 2006, Auckland, New Zealand PERFORMANCE CHARACTERIZATION OF AMORPHOUS SILICON DIGITAL DETECTOR ARRAYS FOR GAMMA RADIOGRAPHY Rajashekar
Maximizing clinical outcomes
 Maximizing clinical outcomes Digital Tomosynthesis Dual Energy Subtraction Automated Long Length Imaging Improved image quality at a low dose Xray Xray Patented ISS capture technology promotes high sensitivity
MXHF-1500RF is controlled by Digital key panel console that displays KV, ma and mas with APR menu programmed.
 R/F TV X-RAY SYSTEM DIAGNOSTIC RADIOGRAPHIC FLUOROSCOPIC TV SYSTEM MXHF-1500RF SYSTEM OUTLINE Product Data No. 041021-01 MXHF-1500RF is controlled by Digital key panel console that displays KV, ma and
Learning Objectives: What s my motivation? (unknown screen actor) Workshop Overview
 Workshop Overview") Practical Medical Physics Adapting Traditional Clinical Medical Physics to Digital Radiography Charles E. Willis, Ph.D., DABR Associate Professor Department of Imaging Physics The University of Texas M.D.
Practical Medical Physics Adapting Traditional Clinical Medical Physics to Digital Radiography Charles E. Willis, Ph.D., DABR Associate Professor Department of Imaging Physics The University of Texas M.D.
AeroDR X60. Motorized X-ray System
 AeroDR X60 Motorized X-ray System AeroDR X60 2 MOTORIZED X-RAY SYSTEM The AeroDR X60 is a high quality, cost effective, compact motorized floor mounted X-ray system, built around Konica Minolta s renowned
Edge Blender Controller
 Edge Blender Controller Calibration Manual Version 2017 V1 Contents Contents INTRODUCTION 1 FEATURES 1 OS AND HARDWARE 1 INSTALLATION 2 INSTALLATION 2 UNINSTALLATION 4 INTERFACE 6 COMMUNICATION 7 CONFIG
REQUIREMENTS FOR LICENCE HOLDERS WITH RESPECT TO QUALITY CONTROL TESTS FOR DIAGNOSTIC X-RAY IMAGING SYSTEMS
 REQUIREMENTS FOR LICENCE HOLDERS WITH RESPECT TO QUALITY CONTROL TESTS FOR DIAGNOSTIC X-RAY IMAGING SYSTEMS DEPARTMENT OF HEALTH DIRECTORATE: RADIATION CONTROL Implementation date: 31 March 2009 Contents
China Resources Wandong Medical Equipment Co., Ltd. High Frequency 50kW, 150kV Radiography System - HF50-R
 China Resources Wandong Medical Equipment Co., Ltd. High Frequency 50kW, 150kV Radiography System - HF50-R Building 3, No.9, Jiuxianqiaodong Road, Chaoyang District, Beijing 100015, P.R. China E-mail:
Get more from your images with Symphony Image Processing
 DIRECT RADIOGRAPHY The user-friendly DelWorks image acquisition and processing software provides a wide range of tools for a variety of image enhancements. Its user interface simplifies every step of the
4.0 How to Turn On the Selenia Dimensions
 Chapter 2 System Controls and Indicators How to Turn On the Selenia Dimensions 4.0 How to Turn On the Selenia Dimensions 4.1 Preparation 1. Reset all three Emergency Off switches. Emergency Off Switches
NJDEP Medical Physicist s Radiographic QC Survey Registration Number:
 Facility Name NJDEP ID # NJDEP Medical Physicist s Radiographic QC Survey PLEASE PRINT Facility Information Unit Information Manufacturer Model Console Model # Console serial # Tube serial # Location (room)
Ask EuroSafe Imaging Tips & Tricks. Paediatric Imaging Working Group. Dose Management in Digital Radiography
 Ask EuroSafe Imaging Tips & Tricks Paediatric Imaging Working Group Dose Management in Digital Radiography Raija Seuri (HUS Medical Imaging Center, FI) Cristina Almeida (Centro Hospitalar de Lisboa Central,
Dose Reduction and Image Preservation After the Introduction of a 0.1 mm Cu Filter into the LODOX Statscan unit above 110 kvp
 Dose Reduction and Image Preservation After the Introduction of a into the LODOX Statscan unit above 110 kvp Abstract: CJ Trauernicht 1, C Rall 1, T Perks 2, G Maree 1, E Hering 1, S Steiner 3 1) Division
Digital Dental Quality Assurance Manual Initial Baseline and Longitudinal Assessment
 Digital Dental Quality Assurance Manual Initial Baseline and Longitudinal Assessment Initial Baseline Assessment 1. Place the detector to be evaluated directly under the central portion of the Digital
1. Preliminary sample preparation
 FEI Helios NanoLab 600 standard operating procedure Nicholas G. Rudawski ngr@ufl.edu (352) 392 3077 (office) (805) 252-4916 (cell) Last updated: 03/02/18 What this document provides: an overview of basic
TESTING FLAT-PANEL IMAGING SYSTEMS: What the Medical Physicist Needs to Know. JAMES A. TOMLINSON, M.S., D.A.B.R. Diagnostic Radiological Physicist
 TESTING FLAT-PANEL IMAGING SYSTEMS: What the Medical Physicist Needs to Know JAMES A. TOMLINSON, M.S., D.A.B.R. Diagnostic Radiological Physicist Topics Image Uniformity and Artifacts Image Quality - Detail
2017 West Coast Educators Conference Orlando. Projection Geometry. 1. Review hierarchy of image qualities (amplified version):
:") Spatial Resolution in the Digital Age: NOTES Quinn B. Carroll, MEd, RT 2017 West Coast Educators Conference Orlando Projection Geometry 1. Review hierarchy of image qualities (amplified version): a. Maximum
Spatial Resolution in the Digital Age: NOTES Quinn B. Carroll, MEd, RT 2017 West Coast Educators Conference Orlando Projection Geometry 1. Review hierarchy of image qualities (amplified version): a. Maximum
Fluke199XRAY. Users Manual. Medical ScopeMeter
 Fluke199XRAY Medical ScopeMeter Users Manual 4822 872 30791 August 2006 2006 Fluke Corporation, All rights reserved. All product names are trademarks of their respective companies. Table of Contents Title
Digitizing Film Using the D850 and ES-2 Negative Digitizer
 JULY 23, 2018 INTERMEDIATE Digitizing Film Using the D850 and ES-2 Negative Digitizer The ES 2 can be used with both strip film and mounted slides. Digitizing film is the process of creating digital data
Bruker Optical Profilometer SOP Revision 2 01/04/16 Page 1 of 13. Bruker Optical Profilometer SOP
 Page 1 of 13 Bruker Optical Profilometer SOP The Contour GT-I, is a versatile bench-top optical surface-profiling system that can measure a wide variety of surfaces and samples. Contour GT optical profilers
Principles of CT scan
 Related topics Detector calibration, saturation, CT acquisition, CT reconstruction Principle X-ray computed tomography consists of using X-rays that are converted to a digital signal by a detector and
Zeiss 780 Training Notes
 Zeiss 780 Training Notes Turn on Main Switch, System PC and Components Switches 780 Start up sequence Do you need the argon laser (458, 488, 514 nm lines)? Yes Turn on the laser s main power switch and
Multiple Choice Identify the letter of the choice that best completes the statement or answers the question.
 RA110 test 3 Multiple Choice Identify the letter of the choice that best completes the statement or answers the question. 1. An object 35 cm in width is radiographed at 100 cm SID and at a 50 cm SOD. What
Related topics Beam hardening, cupping effect, Beam hardening correction, metal artefacts, photon starvation
 Beam hardening and metal artefacts TEP Related topics Beam hardening, cupping effect, Beam hardening correction, metal artefacts, photon starvation Principle X-ray sources produce a polychromatic spectrum