The Shoebox spectrograph construction and lab investigations. By Timothy Grove
|
|
|
- Arleen Johnson
- 6 years ago
- Views:
Transcription

1 The Shoebox spectrograph construction and lab investigations By Timothy Grove 1
 Box cutter or utility")
2 Part 1. Build your own spectrograph from flat cardboard Tools and materials: Necessary items Scrap cardboard (You will need a 46cm by 44cm piece, a 12cm by 5cm, and a 5cm by 5cm piece) Box cutter or utility knife Duct tape School glue Meter stick Shears Marking pen DVD or piece of a DVD (blank read/write disks are fine) Useful additions Heating gun (steam from a pot of boiling water can replace this item) 2
3 T-square (to ensure right angles, but careful measurements can be used instead) Cutting board (to eliminate gauging your work table) Rubber stopper hole cutter- 0.6cm diameter (to get a more neat round view port hole) Glass cutter (used to scribe lines for folding, but carefully cutting with a box cutter through one layer will work) Step 1: Cut out the following shape using flat cardboard. The solid lines indicate cut slots. The dotted lines indicate scribed indentures for easier folding. This should be ONE PIECE of cardboard. 46cm 3cm Support flap side Support flap top side 7cm bottom top 44cm side side top side 30cm Support flap 3cm side Support flap top side 12.5cm 12.5cm 7cm 7cm 7cm 7cm Step 2: Fold the cardboard into a box shape and use duct tape and school glue to hold the cardboard in place. The duct tape simply holds the box in shape while the glue dries. See the following assembly photos. 3


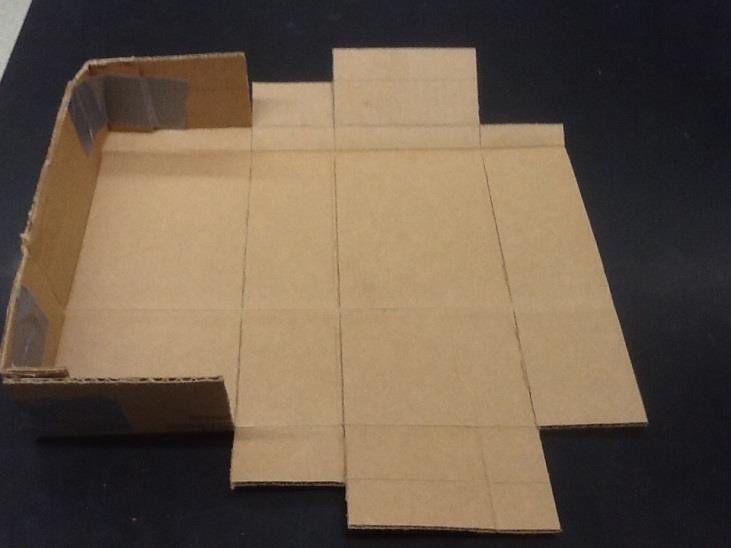
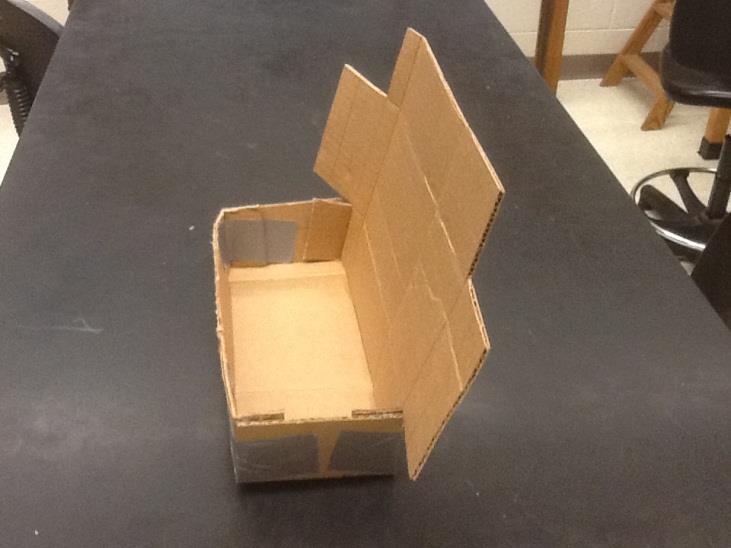
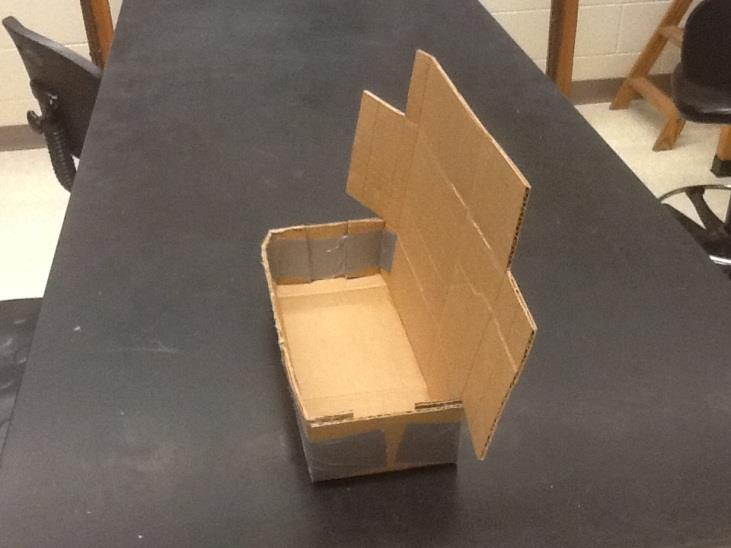
4 Pictures during assembly 4


.")
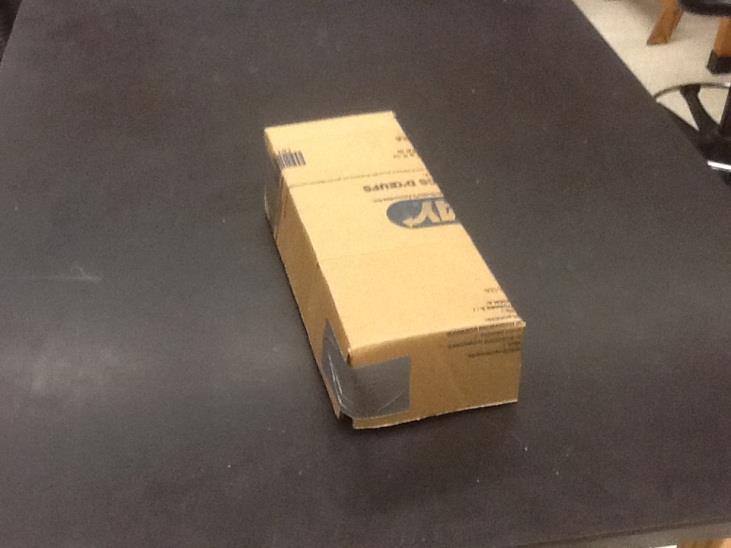
5 Step 3: Cut off a portion of the side flap. Otherwise when you try to make a slit, you would have to cut through 3 layers of cardboard. Then cut a light entrance slit. The slit should be approximately 4cm long and 0.2cm wide and be approximately 2.5cm from the side of the box (see the following photos). Step 4: Cut the view port into the side of the box (about 4cm from the box s edge). The easiest way to get a round view port is to use the same tools that make holes in rubber stoppers. View port Entrance slit 5
6 Step 5: Prepare the grating holder. You will need a 12cm by 5cm piece of flat cardboard and an approximate 5cm by 5cm piece of flat cardboard. Scribe the 12cm by 5cm piece as shown below. 12 cm 5 cm 5 cm 4 cm 4 cm 4 cm Step 6: Fold the 12cm by 5cm cardboard piece into a triangle and secure the shape with tape. Then attach the triangle to the 5cm by 5cm piece (see below) using tape. Step 7: Now you need to make your grating from a DVD. Be aware that if you try to cut a room temperature DVD, it will crack, flake, and/or fracture. To avoid this problem, you must first heat the DVD. Heating it for about a minute with a heat gun will work or boiling it in water. You want the disk to be a little hotter than you could hold, but not so hot the plastic deforms. Step 8: Cut the DVD with shears or strong scissors to get your grating. Trying to cut it with a knife or saw (even when heated) can cause flaking, cracking, and/or fractures. Each DVD can provide up to 4 usable gratings (see the sketch shown below). Grating 1 Grating 2 Grating 4 Grating 3 6
7 Step 9: Attach your grating to your grating holder using tape. Make sure that most of the grating is not covered by tape. Step 10: Open your spectrometer box and place the grating assembly inside. The center of the grating should be aligned with the slit (see sketch). Slit View port Rounded side of grating 7
 is seen through the view port.")
8 Step 11: Hold the slit upwards toward a light source like fluorescent lights. Carefully rotate the grating assembly until the diffraction pattern (bands of different colors of light in the same order as a rainbow) is seen through the view port. You may find it necessary to cut off pieces of the grating holder base for optimal viewing. Make sure the light you are using is coming through the slit (putting your finger over the slit should make the diffraction pattern go away). Once you have the grating assembly in the correct position, hold it in place until you can secure the position with tape and glue. Step 12: Close the box and view different light sources. Keep in mind that you can also use light that is reflected off non-luminous object. 8
 Scrap cardboard (You will need a 12cm by 5cm and 5cm by 5cm piece) Box cutter or utility knife Duct tape School glue Meter stick Shears")
9 Part 1 alternate: Build your own spectrograph from a pre-existing cardboard box (an alternate way of creating a spectrograph) Tools and materials: Necessary items A box (ideally 30cm by 12.5cm by 7cm, but there is a lot of leeway in these dimensions) Scrap cardboard (You will need a 12cm by 5cm and 5cm by 5cm piece) Box cutter or utility knife Duct tape School glue Meter stick Shears Marking pen DVD or piece of a DVD (blank read/write disks are fine) Useful additions Heating gun (a pot of boiling water can replace this item) Cutting board (to eliminate gauging your work table) Rubber stopper hole cutter- 0.6cm diameter (to get a more neat round view port hole) 9
. Entrance Slit Step 2: Cut the view port into the side of the box (about 4cm from the box s edge).")

10 Step 1: Cut a light entrance slit into a side of the box. The slit should be approximately 4cm long and 0.2cm wide and be approximately 2.5cm from the side of the box (see the following photo). Entrance Slit Step 2: Cut the view port into the side of the box (about 4cm from the box s edge). The easiest way to get a round view port is to use the same tools that make holes in rubber stoppers. View port Entrance Slit Step 3: Prepare the grating holder. You will need a 12cm by 5cm piece of flat cardboard and an approximate 5cm by 5cm piece of flat cardboard. Scribe the 12cm by 5cm piece as shown below. 12 cm 5 cm 10 5 cm 4 cm 4 cm 4 cm
11 Step 4: Fold the 12cm by 5cm cardboard piece into a triangle and secure the shape with tape. Then attach the triangle to the 5cm by 5cm piece (see below) using tape. Step 5: Now you need to make your grating from a DVD. Be aware that if you try to cut a room temperature DVD, it will crack and fracture. To avoid this problem, you must first heat the DVD. Heating it for a about a minute with a heat gun will work. Step 6: Cut the DVD to get your grating. Each DVD can provide up to 4 usable gratings (see the sketch shown below). Grating 1 Grating 2 Grating 4 Grating 3 Step 7: Attach your grating to your grating holder using tape. Make sure that most of the grating is not covered by tape. 11

12 Step 8: Open your spectrometer box and place the grating assembly inside. The center of the grating should be aligned with the slit (see sketch). Slit View port Rounded side of grating Step 9: Hold the slit upwards toward a light source like fluorescent lights. Carefully rotate the grating assembly until the diffraction pattern (bands of different colors of light in the same order as a rainbow) is seen through the view port. Make sure the light you are using is coming through the slit (putting your finger over the slit should make the diffraction pattern go away). Once you have the grating assembly in the correct position, hold it in place until you can secure the position with tape and glue. Step 10: Close the box and view different light sources. Keep in mind that you can also use light that is reflected off non-luminous object. 12

13 Part 2. Webcam placement and Calibration Objectives: In this section, you will first attach a webcam (or some other photo taking device to your spectrograph). Next you will be introduced to an open source program called imagej to analyze pictures taken with your spectrograph. Then after a calibration process, you will be able to perform a variety of later investigations. Step 1: Aim your spectrograph towards a light source. This light source could be the overhead fluorescent lights or gas discharge tube (like a helium source). Ideally, this light source should have discrete lines. Then try to lightly attach your spectrograph to a table top or desk (masking tape can help) so that you can see the spectra through the viewing port WITHOUT MOVING THE SPECTROGRAPH. Step 2: Now bring the webcam (or photo taking device) to the spectrograph s viewport. The webcam should be attached to a computer so that you can see how the spectral lines are oriented. Try to orient the webcam such that the discrete lines are VERTICAL and one can see red through violet lines simultaneously on the screen. Once you have this orientation, secure the webcam to the spectrograph with tape (you can carefully use glue if you are trying to make a more permanent spectrograph). Getting help from a second person can greatly aid this process so don t be shy in asking for help. IT IS VITAL THAT THE WEBCAM IS SECURELY ATTACHED AND WELL ALIGNED. IF THE WEBCAM MOVES YOU WILL LOSE A GREAT DEAL OF ACCURACY. Use lots of tape and/or glue. Step 3: Now that the webcam is securely attached to the spectrograph, we will use a helium gas discharge tube to calibrate the spectrograph. Turn on the lamp and orient the spectrograph to get the brightest spectral lines possible. Take a picture of these lines. Where the lines appear in the photograph is irrelevant. All you need is bright, vertical lines going from red to violet (or violet to red). Step 4: If you haven t already done so, download imagej to your computer (go to imagej.nih.gov/ij/). Open imagej and you should see the following menu: 13
 use the rectangle tool to define a region of interest. First click on the rectangle tool.")

14 Use the mouse and go to File Open This should open a browsing window. You now need to locate (and then open) the photograph you took in step 3. Once the photograph is opened (you should see a window that contains your photograph) use the rectangle tool to define a region of interest. First click on the rectangle tool. Rectangle tool Then move the mouse to the window with your photograph. Left click and drag the mouse to select a region of interest. THIS REGION OF INTEREST SHOULD EXTEND FROM THE FAR LEFT SIDE OF YOUR PHOTOGRAPH TO THE FAR RIGHT SIDE. If you didn t draw the region of interest to your exact liking, there are small squares on the yellow box that allow you to modify it after it was drawn. Now go to Analyze Plot Profile. This should open another window that displays an intensity vs. distance graph. 14
15 Step 5: Now open a spreadsheet program like Excel. On the window that shows the intensity vs. distance graph there is a button called Copy Press the button by left clicking it with the mouse. Then go to the spreadsheet program and paste in the values. Step 6: One must now determine the pixel locations for peak intensities. For the example shown above, we find peak intensities at pixel locations Step 7: Now we need to look up the known wavelengths of helium. The National Institute of Standards and Technology (NIST) maintains this information on line. The easiest way of finding any element is to do a google search of strong lines of element name. By googling strong lines of helium we can find the appropriate table for helium. These tables are over-complete for our purposes and one can ignore any wavelength that is less than 3500 angstroms and any wavelength greater than 7500 angstroms (these are beyond the range of human vision as well as beyond the range of most photographic devices). Step 8: We now need to match the peak intensity pixel locations with known wavelengths. If we do this correctly, there should be a linear relationship between our pixel locations and the known wavelengths. This sounds easy but there are multiple distractors. For example, there are strong lines that are rarely seen such as those listed as He II. These are lines associated with He-He molecules and they produce far weaker lines than atomic helium (He I). It is also not uncommon to see peak intensity locations that do not match listed wavelengths. This happens for two reasons: NIST may not have called that emission a strong line or there may be a contaminating substance in the tube. Finally, it is not uncommon to see listed wavelengths as strong lines with no corresponding peak intensity in the photograph. This occurs because some gas discharge tubes do not populate the energy levels that correspond to those lines or that these lines are too weak to be seen with our apparatus. In the example shown above, we found the following correlations between pixel location and wavelength: 15
16 Wavelength (ang.) Wavelength Pixel (ang.) Which when plotted form a linear relationship: y = x R² = Distance (pixels) This would indicate that the calibration is: Wavelength = ang Distance ang pixel By using Excel to create a wavelength column we can produce helium tube intensity vs. wavelength graph. 16
17 Intensity (arb) Helium Spectra Wavelength (ang) 17
18 Part 3. Measurement of unknown spectra Objectives: The purpose of these measurements is to determine the relative accuracy of your particular spectrograph as well as demonstrate how one can use spectrographs to determine substances that emit light. You have been given four different gas discharge tubes. One of which is labeled as Helium. The other three have masking tape covering their labels and could be Hydrogen, Neon, or Mercury gas tubes. DO NOT REMOVE THE MASKING TAPE OR YOU WILL LOSE ALL CREDIT FOR THIS SECTION. Place each tube in the power supply and observe the color light they produce (as seen with the human eye). Write a short description of the color for each tube based on human eyesight and color vision. (This does NOT involve your spectrograph). Now use your spectrograph. First take a picture of helium spectra. Ensure yourself that the peak locations are the same as before. If they have all consistently moved by similar numbers of pixels, your webcam might have moved. Make a list of the pixel locations for the peak intensities and compare them to your previous values. 18
19 Do you need to recalibrate the spectrograph based on your results? Make an argument for/against based upon your data. If you do need to recalibrate, write down your new calibration equation. Now select one of your unknown tubes. Use the spectrograph to determine multiple strong line wavelengths. From these measurements, can you determine the gas in the tube? (Don t forget that you can go on line to look up the strong lines for each of the given gases) Now select a different unknown tube. Use the spectrograph to determine multiple strong line wavelengths. From these measurements, can you determine the gas in the tube? 19
20 Now select the final unknown tube. Use the spectrograph to determine multiple strong line wavelengths. From these measurements, can you determine the gas in the tube? Based upon what you have seen so far, how accurate is your particular spectrograph? That is, how close does your spectrograph s measurements correspond to the measurements given by NIST? Make actual numerical comparisons in the space below. 20
21 To test how well you understand your spectrograph, try the following. Aim your spectrograph upwards at the fluorescent lights and take a spectral picture. Use imagej to analyze the results and determine the strong line wavelengths. (NOTE: because of the cardboard design and different angle of operation, the spectra could slightly shift, but the separation in wavelength between features should remain consistent). Is there any evidence that there is Helium, Hydrogen, Mercury, or Neon in the fluorescent lights based upon your data? Fully explain your reasoning as to whether you believe each gas is present or absent in fluorescent light tubes. 21
22 Part 4. Human color vision and spectral colors Objective: How is human color vision related (if at all) to spectral colors? This investigation examines the relationship between spectral color and human color vision. To begin with we will weakly define human color vision as the colors one would use to describe crayons. Spectral colors are the colors we see in rainbows and on our spectrograph pictures. Are all human vision colors located at some point in the visible spectra (colors in the rainbow)? What is your initial guess without doing this investigation? How does the color white (as seen by humans) relate to spectral colors (the colors in the rainbow)? What is your best guess? Consider the color brown (as seen by humans). Is there a location in the rainbow spectrum that can be described as being brown? If not, what is your best guess to how the color brown is related to the spectral colors? MAKE SURE THAT YOUR ANSWERS ON THIS PAGE ARE CONSISTENT WITH EACH OTHER!!! 22
23 We will begin by examining white light in three different forms (incandescent bulb, fluorescent light, and white from a computer screen). This will be somewhat complicated by the fact that the DVD fragment in the spectrograph does NOT equally reflect all colors of visible light. To ensure consistent pictures go into the settings (advanced settings) and turn off automatic white balance, right light, and any other automatic light correction controls. NOTE: It is now assumed that you have calibrated your spectrograph and that this calibration is still valid. Using your spectrograph, take a picture of light from an incandescent bulb. How would you describe the spectral features of this light using words and values from you analyzed spectral photograph? Using your spectrograph, take a picture of light from a fluorescent light tube. How would you describe the spectral features of this light using words and values from you analyzed spectral photograph? 23
24 To examine white light produced by a computer monitor open the program PowerPoint. Do not allow the PowerPoint window to occupy the full screen (you will need to have the webcam program also available on the screen). On PowerPoint, draw a large white rectangle. Place the spectrograph entry slit on top of the white rectangle that you drew and take a photograph. Analyze this photograph using imagej. How would you describe the spectral features of this light using words and values from you analyzed spectral photograph? Previously, you were asked, How does the color white relate to spectral colors (the colors in the rainbow)? Now that you collected data, does your previous answer agree with your experimental results? If not, how would you change your response to that question given what you know now? Do you need all spectral colors to give humans the sensation of white light? If not, what colors do you need to make people see white? 24
25 Go back to the PowerPoint window. Change the color of the rectangle you drew to blue. Before you take any measurements with your spectrograph, predict how your spectra colors will change (compared to the white light picture taken before)? Now take a picture of the blue rectangle using your spectrograph and analyze it using imagej. Give a description of the spectral light intensities as seen through the spectrograph. Make sure that your answer is detailed enough to differentiate it from previous answers. Resolve any differences between your last two answers. NOTE: Resolve does not mean just noting differences. You are expected to attempt to figure out what is going on. 25
26 Change the color of the rectangle you drew to green. Before you take any measurements with your spectrograph, predict how your spectra colors will change (compared to the white light picture taken before)? Now take a picture of the green rectangle using your spectrograph and analyze it using imagej. Give a description of the spectral light intensities as seen through the spectrograph. Make sure that your answer is detailed enough to differentiate it from previous answers. Resolve any differences between your last two answers. NOTE: Resolve does not mean just noting differences. You are expected to attempt to figure out what is going on. Change the color of the rectangle you drew to yellow. Before you take any measurements with your spectrograph, predict how your spectra colors will change (compared to the white light picture taken before)? 26
27 Now take a picture of the yellow rectangle using your spectrograph and analyze it using imagej. Give a description of the spectral light intensities as seen through the spectrograph. Make sure that your answer is detailed enough to differentiate it from previous answers. Resolve any differences between your last two answers. NOTE: Resolve does not mean just noting differences. You are expected to attempt to figure out what is going on. Now try to summarize your results of the white, blue, green, and yellow rectangles. How do the spectral colors produced by the monitor change as we go from white to blue to green to yellow? 27
28 Reconsider the much earlier question about the color brown. How (if at all) would your answer to that question change given what you have seen so far? Change the color of the rectangle you drew to brown. Before you take any measurements with your spectrograph, predict how your spectra colors will change (compared to the white light picture taken before)? Now take a picture of the brown rectangle using your spectrograph and analyze it using imagej. Give a description of the spectral light intensities as seen through the spectrograph. Make sure that your answer is detailed enough to differentiate it from previous answers. 28
29 Resolve any differences between your last two answers. NOTE: Resolve does not mean just noting differences. You are expected to attempt to figure out what is going on. Your instructor is going to give you a color for your PowerPoint rectangle. Write down this color and predict what the monitor will do to produce that color. Show your answer to the instructor. Now take a picture of this new rectangle using your spectrograph and analyze it using imagej. How does your result compare to your prediction? 29
30 Part 5. Absorption of light Objective: Consider the action of adding food coloring to water in an aquarium. Is the food coloring adding color to the light that passes through the water or is it doing something different? This investigation will reveal the results. Describe white light from an incandescent light bulb. Hint: You really should have a spectral picture of it from your last investigation. Now consider the following investigation (you aren t doing it yet). White light from an incandescent light bulb is direct through a small container (cuvette) containing a mixture of green food coloring dye and water. How would the light spectra change (if at all) from your previous answer? Explain your reasoning! Desk lamp Plastic cuvette filled with water and food coloring Spectrograph with webcam attached 30
31 To ensure consistent pictures go into the settings (advanced settings) and turn off automatic white balance, right light, and any other automatic light correction controls. NOTE: It is now assumed that you have calibrated your spectrograph and that this calibration is still valid. Measure 100mL of water in a beaker. Pour some of this water into a cuvette. Set up the experiment as shown on the previous page and take a picture. Now pour the water back into the beaker and add ONE drop of green food coloring. Mix it until the color is consistent and pour some of the water back into the cuvette. Place the cuvette in front of the spectrograph s entrance slit and take another picture. Now pour the water back into the beaker and add TWO drops of green food coloring. This mixture now has a total of THREE drops of food coloring. Mix it until the color is consistent and pour some of the water back into the cuvette. Place the cuvette in front of the spectrograph s entrance slit and take another picture. Now pour the water back into the beaker and add THREE drops of green food coloring. This mixture now has a total of SIX drops of food coloring. Mix it until the color is consistent and pour some of the water back into the cuvette. Place the cuvette in front of the spectrograph s entrance slit and take another picture. Now pour the water back into the beaker and add FOUR drops of green food coloring. This mixture now has a total of TEN drops of food coloring. Mix it until the color is consistent and pour some of the water back into the cuvette. Place the cuvette in front of the spectrograph s entrance slit and take another picture. Now examine each dye mixture picture using imagej and get the intensity vs. wavelength graph for each picture. Transmittance is defined as the intensity of the light after passing through a substance divided by the intensity of light before it entered the substance. In this case, the substance is the food coloring. The intensity of the light (before the food coloring) is represented by water only picture. Use the imagej data to produce a four trace graph (one drop, three drops, six drops, and 10 drops) of transmittance vs. wavelength for a range of 450nm to 600nm. Attach this graph to this report. Based upon this graph, is the green dye adding color to the light that transmits through the water? Explain your reasoning. 31
32 Recall your prediction. How well did your prediction correspond to the experimental results? Make sure you use experimental values in your WELL EXPLAINED response. Now consider the following investigation (you aren t doing it yet). White light from an incandescent light bulb is direct through a small container (cuvette) containing a mixture of yellow food coloring dye and water. How would the light spectra change (if at all) from your previous answer? Explain your reasoning! You are now going to repeat the process with yellow food coloring using a fresh cuvette. That is you are going to produce transmittance graph traces for one drop, three drops, six drops, and 10 drops of yellow food coloring. Attach this graph to this report. Finally, to test your knowledge, you should now be able to predict the transmittance if we have a mixture of 100mL + 10 drops of green + 10 drops of yellow. Your prediction should be in the form of a graph and you need to supply a written explanation as to how you came up with your prediction. SHOW YOUR ANSWER TO YOUR INSTRUCTOR BEFORE PROCEEDING. 32
33 Make a mixture of 100mL water + 10 drops of green + 10 drops of yellow. Mix well and fill a fresh cuvette. Measure the transmittance of this mixture vs. wavelength and attach a graph of it to this report. How accurate was your prediction compared to the results? Be specific and make direct numerical comparisons. If you could re-do the green-yellow prediction or experiment, what would you do differently? 33
34 Part 6. Reflection of light Objective: What causes some objects to look red and other objects yellow? How does reflected spectral colors differ between two differently colored objects? This investigation explores these relationships among others. Based upon what you think you know, consider the following question. If an object is only illuminated by red light (620nm to 750nm), is it possible for the object to reflect green light (495nm to 570nm)? Explain your reasoning. Consider the experiment shown to the right (don t set it up yet). A red laser is reflected off an object and the reflected light is directed into the spectrograph. A laser produces a very narrow range of wavelengths. Would the wavelengths of the reflected light that enter the spectrograph depend on the color of the reflecting object? Explain your reasoning. Reflecting object Red Laser Spectrograph with webcam attached Now try the experiment (shown on this page) using at least 5 different colors of construction paper as your reflecting object. Collect photographs and analyze them using imagej and your calibration equation. Attach this information to your paper. 34
35 Based upon your collected evidence with the construction paper, what changes (if any) did you see from color of construction paper to the next? Explain your reasoning using collected numerical values. How (if at all) would you change your answers to the questions that were asked before the experiment? Does the experiment support what you said earlier or should you revise your thinking? EXPLAIN. 35
36 Based upon what you think you know, consider an object that looks white under an incandescent light bulb. If the white object is only illuminated by red light (620nm to 750nm), what color would we see this object (human sight vision)? Explain your reasoning. Based upon what you think you know, consider an object that looks dark blue under an incandescent light bulb. If the dark blue object is only illuminated by red light (620nm to 750nm), what color would we see this object (human sight vision)? Explain your reasoning. Consider the experiment shown to the right (don t set it up yet). A light from an incandescent bulb is reflected off an object and the reflected light is directed into the spectrograph. Would the wavelengths of the reflected light that enter the spectrograph depend on the color of the reflecting object? Explain your reasoning. Reflecting object Desk lamp Spectrograph with webcam attached 36
37 Now try the experiment (shown on this page) using at least 5 different colors of construction paper as your reflecting object (they can be the same ones you used before). Collect photographs and analyze them using imagej and your calibration equation. Attach this information to your paper. Based upon your collected evidence with the construction paper, what changes (if any) did you see from color of construction paper to the next? Explain your reasoning using collected numerical values. For the final experiment in this investigation, you will need to go outside and collect a small piece of some brightly colored object (for example, a dandelion flower). If this object was used as your reflecting object (illuminated with an incandescent bulb), PREDICT the spectra you would expect to see. Explain your reasoning. Show your object and prediction to your instructor. 37
38 Now try the experiment with your sample. Collect a photograph and analyze it using imagej and your calibration equation. Attach this information to your paper. Recall your prediction. How well did your prediction correspond to the experimental results? Make sure you use experimental values in your WELL EXPLAINED response. Now that you have run the experiment, how if at all would you change your prediction and/or the experiment? 38
39 Part 7. Laser induced PlayDoh Fluorescence Objective: What is the difference between fluorescence and reflection? Given the spectra for input light, could we look at light coming off an object and deduce whether that light is due to reflection or fluorescence? Based upon what you think you know, consider the following question. If an object is only illuminated by blue laser light (405nm), is it possible for the object to emit red light (620nm to 750nm)? Explain your reasoning. Consider the experiment shown to the right (don t set it up yet). A blue laser beam is incident upon a lump of PlayDoh. Would the wavelengths of the light that enter the spectrograph match those of the laser beam? Explain your reasoning. PlayDoh Lump Blue Laser Spectrograph with webcam attached 39
40 Now try the experiment using red, yellow, green, and blue lumps of PlayDoh with a blue laser (405nm). Collect photographs (one for each color of PlayDoh) and analyze them using imagej and your calibration equation. Attach this information to your paper. Fluorescence differs from reflection in that the wavelength emitted from an illuminated object does not match the wavelength of the incident light. Have you seen any evidence of fluorescence? Repeat the experiment using a green laser (532nm) instead of a blue laser. Collect photographs (one for each color of PlayDoh) and analyze them using imagej and your calibration equation. Attach this information to your paper. Green light is approximately in the middle of the visible spectrum. Is there any evidence that green light can produce fluorescence with a higher wavelength (greater than 532nm)? Explain using numerical values from your data. 40
41 Is there any evidence that green light can produce fluorescence with a lower wavelength (less than 532nm)? Explain using numerical values from your data. Reconsider the fluorescence from blue laser light. Is there any evidence that blue light can produce fluorescence with a lower wavelength (less than 405nm)? Explain using numerical values from your data. Repeat the experiment using a red laser (~650nm) instead of a blue laser. Collect photographs (one for each color of PlayDoh) and analyze them using imagej and your calibration equation. Attach this information to your paper. Is there any evidence that the red light is producing fluorescence in any color of PlayDoh? Explain using numerical values from your data. 41
42 Based upon your entire set of data, which color of laser light seemed to most effectively produce fluorescence? Explain your reasoning. Do you have any fluorescence experiment that resulted in a lower wavelength being emitted than the laser beam? Explain your reasoning and use numerical data when possible. Photons are the smallest whole part of light. A single photon s energy is given by hc where h is Planck s constant, c is the speed of light in vacuum, and is wavelength. Which color laser had the most energetic photons? λ Based upon your limited data, is there any indication that fluorescence may depend on photon energy? 42
Build Spectroscope. This activity is suitable for Middle School or High School Students. State Standards Met
 Build Spectroscope Build Spectroscope Abstract Students learn to how to construct, modify, and calibrate a spectrometer. Students also learn the governing equation of diffraction, and ways in which to
2018 Conference on Laboratory Instruction Beyond the First Year. Quick Summary
 2018 Conference on Laboratory Instruction Beyond the First Year Quick Summary Conference Format A few plenary speakers on topics related to advanced labs. Several breakout sessions related to specialized
PhysicsAndMathsTutor.com 1
 PhysicsAndMathsTutor.com 1 Q1. Just over two hundred years ago Thomas Young demonstrated the interference of light by illuminating two closely spaced narrow slits with light from a single light source.
ECEN. Spectroscopy. Lab 8. copy. constituents HOMEWORK PR. Figure. 1. Layout of. of the
 ECEN 4606 Lab 8 Spectroscopy SUMMARY: ROBLEM 1: Pedrotti 3 12-10. In this lab, you will design, build and test an optical spectrum analyzer and use it for both absorption and emission spectroscopy. The
LAB 11 Color and Light
 Cabrillo College Name LAB 11 Color and Light Bring colored pencils or crayons to lab if you already have some. What to learn and explore In the previous lab, we discovered that some sounds are simple,
PHYS General Physics II Lab Diffraction Grating
 1 PHYS 1040 - General Physics II Lab Diffraction Grating In this lab you will perform an experiment to understand the interference of light waves when they pass through a diffraction grating and to determine
Unit 8: Light and Optics
 Objectives Unit 8: Light and Optics Explain why we see colors as combinations of three primary colors. Explain the dispersion of light by a prism. Understand how lenses and mirrors work. Explain thermal
Teaching Time: Two 50-minute periods
 Lesson Summary In this lesson, students will build an open spectrograph to calculate the angle the light is transmitted through a holographic diffraction grating. After finding the desired angles, the
Mini-spectrometer from a DVD and folded paper
 Mini-spectrometer from a DVD and folded paper Writing up experiences with an open-source transmission grating spectrometer from DVD, paper and camera. A very effective gadget to get hands-on training in
Period 3 Solutions: Electromagnetic Waves Radiant Energy II
 Period 3 Solutions: Electromagnetic Waves Radiant Energy II 3.1 Applications of the Quantum Model of Radiant Energy 1) Photon Absorption and Emission 12/29/04 The diagrams below illustrate an atomic nucleus
Building a simple spectroscope
 Quick and simple laser communicator. Make your own 3D pictures in minutes. Making permanent rainbows. Building the impossible kaleidoscope. Building a simple spectroscope. Make a solar hotdog cooker. Going
[4] (b) Fig. 6.1 shows a loudspeaker fixed near the end of a tube of length 0.6 m. tube m 0.4 m 0.6 m. Fig. 6.
![[4] (b) Fig. 6.1 shows a loudspeaker fixed near the end of a tube of length 0.6 m. tube m 0.4 m 0.6 m. Fig. 6.](/thumbs/82/84801740.jpg "[4] (b) Fig. 6.1 shows a loudspeaker fixed near the end of a tube of length 0.6 m. tube m 0.4 m 0.6 m. Fig. 6.") 1 (a) Describe, in terms of vibrations, the difference between a longitudinal and a transverse wave. Give one example of each wave.................... [4] (b) Fig. 6.1 shows a loudspeaker fixed near the
1 (a) Describe, in terms of vibrations, the difference between a longitudinal and a transverse wave. Give one example of each wave.................... [4] (b) Fig. 6.1 shows a loudspeaker fixed near the
Ph 3455 The Photoelectric Effect
 Ph 3455 The Photoelectric Effect Required background reading Tipler, Llewellyn, section 3-3 Prelab Questions 1. In this experiment you will be using a mercury lamp as the source of photons. At the yellow
Physics 345 Pre-lab 1
 Physics 345 Pre-lab 1 Suppose we have a circular aperture in a baffle and two light sources, a point source and a line source. 1. (a) Consider a small light bulb with an even tinier filament (point source).
The Photoelectric Effect
 The Photoelectric Effect 1 The Photoelectric Effect Overview: The photoelectric effect is the light-induced emission of electrons from an object, in this case from a metal electrode inside a vacuum tube.
Educational Spectrophotometer Accessory Kit and System OS-8537 and OS-8539
 GAIN 1 10 Instruction Manual with Experiment Guide and Teachers Notes 012-06575C *012-06575* Educational Spectrophotometer Accessory Kit and System OS-8537 and OS-8539 100 CI-6604A LIGHT SENSOR POLARIZER
Dumpster Optics THE COLORS OF LIGHT
 January.2017 Dumpster Optics THE COLORS OF LIGHT DO ALL RED LIGHTS CONTAIN THE SAME COLORS? BUILD A SPECTROSCOPE FROM A CARDBOARD TUBE AND AN OLD CD AND LEARN ABOUT THE COLORS IN THE LIGHTS AROUND YOU.
Option G 4:Diffraction
 Name: Date: Option G 4:Diffraction 1. This question is about optical resolution. The two point sources shown in the diagram below (not to scale) emit light of the same frequency. The light is incident
Chemistry workshops and investigations
 Chemistry workshops and investigations Make a DVD smartphone spectrometer CfE Advanced Higher Inorganic and Physical Chemistry Electromagnetic radiation and atomic spectra Background Spectroscopy is an
Colorado State Standards Mathematics Standards 3.4 Science Standard 1, 2, 4, 5
 Lesson Summary In this activity, students build and decorate their own spectrographs using simple materials and holographic diffraction gratings. After building the spectrographs, they observe the spectra
SPECTROCLICK KIT EXPLORE THE INTERACTION OF LIGHT AND MATTER THE SCIENCE OF SPECTROSCOPY. 101 W. Tomaras Ave. Bldg.
 SPECTROCLICK KIT EXPLORE THE INTERACTION OF LIGHT AND MATTER THE SCIENCE OF SPECTROSCOPY 101 W. Tomaras Ave. Bldg. B Savoy, IL 61874 WARNING: NOT INTENDED FOR CHILDREN UNDER THE AGE OF 6 ADULT SUPERVISION
University of Wisconsin Chemistry 524 Spectroscopic Components *
 University of Wisconsin Chemistry 524 Spectroscopic Components * In journal articles, presentations, and textbooks, chemical instruments are often represented as block diagrams. These block diagrams highlight
EDUCATIONAL SPECTROPHOTOMETER ACCESSORY KIT AND EDUCATIONAL SPECTROPHOTOMETER SYSTEM
 GAIN 1 10 100 Instruction Manual and Experiment Guide for the PASCO scientific Model OS-8537 and OS-8539 012-06575A 3/98 EDUCATIONAL SPECTROPHOTOMETER ACCESSORY KIT AND EDUCATIONAL SPECTROPHOTOMETER SYSTEM
Friday 18 January 2013 Morning
 Friday 18 January 2013 Morning AS GCE PHYSICS A G482/01 Electrons, Waves and Photons *G411580113* Candidates answer on the Question Paper. OCR supplied materials: Data, Formulae and Relationships Booklet
AP Chemistry Cell Phone Spectroscopy Lab Adopted from Alexander Scheeline Department of Chemistry University of Illinois at Urbana-Champaign
 AP Chemistry Cell Phone Spectroscopy Lab Adopted from Alexander Scheeline Department of Chemistry University of Illinois at Urbana-Champaign Back Ground Electromagnetic radiation Electromagnetic radiation
Physics 248 Spring 2009 Lab 1: Interference and Diffraction
 Name Section Physics 248 Spring 2009 Lab 1: Interference and Diffraction Your TA will use this sheet to score your lab. It is to be turned in at the end of lab. You must clearly explain your reasoning
Dumpster Optics BENDING LIGHT REFLECTION
 Dumpster Optics BENDING LIGHT REFLECTION WHAT KINDS OF SURFACES REFLECT LIGHT? CAN YOU FIND A RULE TO PREDICT THE PATH OF REFLECTED LIGHT? In this lesson you will test a number of different objects to
Light, Color, Spectra 05/30/2006. Lecture 17 1
 What do we see? Light Our eyes can t t detect intrinsic light from objects (mostly infrared), unless they get red hot The light we see is from the sun or from artificial light When we see objects, we see
Spectroscopy Lab 2. Reading Your text books. Look under spectra, spectrometer, diffraction.
 1 Spectroscopy Lab 2 Reading Your text books. Look under spectra, spectrometer, diffraction. Consult Sargent Welch Spectrum Charts on wall of lab. Note that only the most prominent wavelengths are displayed
Friday 18 January 2013 Morning
 Friday 18 January 2013 Morning AS GCE PHYSICS A G482/01 Electrons, Waves and Photons *G411580113* Candidates answer on the Question Paper. OCR supplied materials: Data, Formulae and Relationships Booklet
Building a Spectroscope and Telescope
 Building a Spectroscope and Telescope By Kevin Cobble, Z-Field Observatory, www.z-field.org Send comments and questions to observatory@z-field.org Yield: Spectrometer and telescope Diagrams shown on next
Make Your Own Digital Spectrometer With Diffraction Grating
 Make Your Own Digital Spectrometer With Diffraction Grating T. Z. July 6, 2012 1 Introduction and Theory Spectrums are very useful for classify atoms and materials. Although digital spectrometers such
In the Heat of the Light
 The Electromagnetic Spectrum Laboratory Investigation TEACHER NOTES In the Heat of the Light Key Concept Fluorescent and incandescent lights work in different ways. Skills Focus observing, measuring, interpreting
Lecture 6 6 Color, Waves, and Dispersion Reading Assignment: Read Kipnis Chapter 7 Colors, Section I, II, III 6.1 Overview and History
 Lecture 6 6 Color, Waves, and Dispersion Reading Assignment: Read Kipnis Chapter 7 Colors, Section I, II, III 6.1 Overview and History In Lecture 5 we discussed the two different ways of talking about
Assignment 1 Examining the Solar Spectrum with a diffraction grating
 Module 1 Assignments 1 & 2 Before we begin, note that some of the activities require posting answers and results on the Blog. In the document below, the Blog assignments are written in green for ease of
How is Light Absorbed and Transmitted?
 How is Light Absorbed and Transmitted? Description: Students will examine the absorption and transmission of light by color filters with the help of a light source and a diffraction grating. Student Materials
Engineering Your Own Spectrograph Instructions & Worksheet
 Team name: Date: Team members: Engineering Your Own Spectrograph Instructions & Worksheet Part 1: Creating an Open Spectrograph Materials List Each group needs: 1 rectangular piece of foam core board 2
Vernier SpectroVis Plus Spectrophotometer (Order Code: SVIS-PL)
") Vernier SpectroVis Plus Spectrophotometer (Order Code: SVIS-PL) SpectroVis Plus is a portable, visible to near-ir spectrophotometer and fluorometer. What is included with the SpectroVis Plus? One SpectroVis
Vernier SpectroVis Plus Spectrophotometer (Order Code: SVIS-PL) SpectroVis Plus is a portable, visible to near-ir spectrophotometer and fluorometer. What is included with the SpectroVis Plus? One SpectroVis
Experiment 1: The Wave Model of light vs. the Quantum Model
 012-04049J h/e Apparatus and h/e Apparatus Accessory Kit Experiment 1: The Wave Model of light vs. the Quantum Model Setup According to the photon theory of light, the maximum kinetic energy, KE, of photoelectrons
FRAUNHOFER AND FRESNEL DIFFRACTION IN ONE DIMENSION
 FRAUNHOFER AND FRESNEL DIFFRACTION IN ONE DIMENSION Revised November 15, 2017 INTRODUCTION The simplest and most commonly described examples of diffraction and interference from two-dimensional apertures
THIS IS A NEW SPECIFICATION
 THIS IS A NEW SPECIFICATION ADVANCED SUBSIDIARY GCE PHYSICS A Electrons, Waves and Photons G482 *OCE/23017* Candidates answer on the Question Paper OCR Supplied Materials: Data, Formulae and Relationships
Physics 4C Chabot College Scott Hildreth
 Physics 4C Chabot College Scott Hildreth The Inverse Square Law for Light Intensity vs. Distance Using Microwaves Experiment Goals: Experimentally test the inverse square law for light using Microwaves.
Exercise 8: Interference and diffraction
 Physics 223 Name: Exercise 8: Interference and diffraction 1. In a two-slit Young s interference experiment, the aperture (the mask with the two slits) to screen distance is 2.0 m, and a red light of wavelength
Shimadzu RF-5301 Fluorimeter operation guide for students
 Department of Chemistry Teaching Laboratories Shimadzu RF-5301 Fluorimeter operation guide for students General directions Detailed instructions for use of the fluorimeter may be given in the lab script,
End-of-Chapter Exercises
 End-of-Chapter Exercises Exercises 1 12 are conceptual questions designed to see whether you understand the main concepts in the chapter. 1. Red laser light shines on a double slit, creating a pattern
Classroom. An Easily Constructed Monochromator
 Classroom In this section of Resonance, we invite readers to pose questions likely to be raised in a classroom situation. We may suggest strategies for dealing with them, or invite responses, or both.
CHAPTER 7. Components of Optical Instruments
 CHAPTER 7 Components of Optical Instruments From: Principles of Instrumental Analysis, 6 th Edition, Holler, Skoog and Crouch. CMY 383 Dr Tim Laurens NB Optical in this case refers not only to the visible
Activity 12 1: Determine the Axis of Polarization of a Piece of Polaroid
 Home Lab Lab 12 Polarization Overview Home Lab 12 Polarization Activity 12 1: Determine the Axis of Polarization of a Piece of Polaroid Objective: To find the axis of polarization of the Polaroid sheet
Appendix A DIY Spectrometer
 Appendix A DIY Spectrometer Page 13 Do-It-Yourself Nitrate Detector Materials and Methods A spectrometer is a device that splits light into the various colors it consists of, which we otherwise cannot
Exam 4. Name: Class: Date: Multiple Choice Identify the choice that best completes the statement or answers the question.
 Name: Class: Date: Exam 4 Multiple Choice Identify the choice that best completes the statement or answers the question. 1. Mirages are a result of which physical phenomena a. interference c. reflection
No Brain Too Small PHYSICS
 WAVES: WAVES BEHAVIOUR QUESTIONS No Brain Too Small PHYSICS DIFFRACTION GRATINGS (2016;3) Moana is doing an experiment in the laboratory. She shines a laser beam at a double slit and observes an interference
Ph 3455 The Franck-Hertz Experiment
 Ph 3455 The Franck-Hertz Experiment Required background reading Tipler, Llewellyn, section 4-5 Prelab Questions 1. In this experiment, we will be using neon rather than mercury as described in the textbook.
NAME SECTION PERFORMANCE TASK # 3. Part I. Qualitative Relationships
 NAME SECTION PARTNERS DATE PERFORMANCE TASK # 3 You must work in teams of three or four (ask instructor) and will turn in ONE report. Answer all questions. Write in complete sentences. You must hand this
Directory of Home Labs, Materials List, and SOLs
 Directory of Home Labs, Materials List, and SOLs Home Lab 1 Introduction and Light Rays, Images and Shadows SOLS K.7a, K.7b A 60 Watt white frosted light bulb (a bulb that you can not directly see the
PROCEEDINGS OF SPIE. Measuring and teaching light spectrum using Tracker as a spectrometer. M. Rodrigues, M. B. Marques, P.
 PROCEEDINGS OF SPIE SPIEDigitalLibrary.org/conference-proceedings-of-spie Measuring and teaching light spectrum using Tracker as a spectrometer M. Rodrigues, M. B. Marques, P. Simeão Carvalho M. Rodrigues,
Guide to SPEX Optical Spectrometer
 Guide to SPEX Optical Spectrometer GENERAL DESCRIPTION A spectrometer is a device for analyzing an input light beam into its constituent wavelengths. The SPEX model 1704 spectrometer covers a range from
Applications of Steady-state Multichannel Spectroscopy in the Visible and NIR Spectral Region
 Feature Article JY Division I nformation Optical Spectroscopy Applications of Steady-state Multichannel Spectroscopy in the Visible and NIR Spectral Region Raymond Pini, Salvatore Atzeni Abstract Multichannel
BUILDING A VR VIEWER COMPLETE BUILD ASSEMBLY
 ACTIVITY 22: PAGE 1 ACTIVITY 22 BUILDING A VR VIEWER COMPLETE BUILD ASSEMBLY MATERIALS NEEDED One Rectangular Cardboard piece from 12-pack soda case Two round bi-convex lenses with a focal point of 45mm
Basic Optics System OS-8515C
 40 50 30 60 20 70 10 80 0 90 80 10 20 70 T 30 60 40 50 50 40 60 30 70 20 80 90 90 80 BASIC OPTICS RAY TABLE 10 0 10 70 20 60 50 40 30 Instruction Manual with Experiment Guide and Teachers Notes 012-09900B
LIGHT BOX & OPTICAL SET CAT NO. PH0615
 LIGHT BOX & OPTICAL SET CAT NO. PH0615 Experiment Guide ACTIVITIES INCLUDED: Diffraction Angle of Reflection Using a Plane Mirror Refraction of Different Shaped Prisms Refraction (Snell's Law) Index of
Physics 2020 Lab 9 Wave Interference
 Physics 2020 Lab 9 Wave Interference Name Section Tues Wed Thu 8am 10am 12pm 2pm 4pm Introduction Consider the four pictures shown below, showing pure yellow lights shining toward a screen. In pictures
Spectrophotometer. An instrument used to make absorbance, transmittance or emission measurements is known as a spectrophotometer :
 Spectrophotometer An instrument used to make absorbance, transmittance or emission measurements is known as a spectrophotometer : Spectrophotometer components Excitation sources Deuterium Lamp Tungsten
Photosynthesis. photosynthesis. respiration
 Photosynthesis Learning Goals After completing this laboratory exercise you will be able to: 1. Observe the absorption spectrum of the pigment Chlorophyll using a spectroscope. 2. Describe the relationship
Observing a colour and a spectrum of light mixed by a digital projector
 Observing a colour and a spectrum of light mixed by a digital projector Zdeněk Navrátil Abstract In this paper an experiment studying a colour and a spectrum of light produced by a digital projector is
AP Physics Problems -- Waves and Light
 AP Physics Problems -- Waves and Light 1. 1974-3 (Geometric Optics) An object 1.0 cm high is placed 4 cm away from a converging lens having a focal length of 3 cm. a. Sketch a principal ray diagram for
A Colorful Lab in a Bag
 A Colorful Lab in a Bag In this lab you will explore color and color mixing. You will investigate the white light spectrum and examine ways in which color can be combined. One process of mixing color,
Home Lab 2 Pinhole Viewer Box
 1 Home Lab 2 Pinhole Viewer Box Overview A pinhole camera, also known as camera obscura, or "dark chamber", is a simple optical imaging device in the shape of a closed box or chamber. In one of its sides
HOLOGRAPHY EXPERIMENT 25. Equipment List:-
 EXPERIMENT 25 HOLOGRAPHY Equipment List:- (a) (b) (c) (d) (e) (f) (g) Holography camera and plate holders Laser/beam lamp and assembly Shutter on stand Light meter Objects to make holographs of Holographic
Improving the Collection Efficiency of Raman Scattering
 PERFORMANCE Unparalleled signal-to-noise ratio with diffraction-limited spectral and imaging resolution Deep-cooled CCD with excelon sensor technology Aberration-free optical design for uniform high resolution
28 Color. The colors of the objects depend on the color of the light that illuminates them.
 The colors of the objects depend on the color of the light that illuminates them. Color is in the eye of the beholder and is provoked by the frequencies of light emitted or reflected by things. We see
Construction Manual of Merlin spectrometer
 Construction Manual of Merlin spectrometer The first generation of our Merlin Spectrometer is based on the ramanpi Spectrometer. The Project was developed open source with a detailed construction documentation.
Test 1: Example #2. Paul Avery PHY 3400 Feb. 15, Note: * indicates the correct answer.
 Test 1: Example #2 Paul Avery PHY 3400 Feb. 15, 1999 Note: * indicates the correct answer. 1. A red shirt illuminated with yellow light will appear (a) orange (b) green (c) blue (d) yellow * (e) red 2.
Instructions for the Experiment
 Instructions for the Experiment Excitonic States in Atomically Thin Semiconductors 1. Introduction Alongside with electrical measurements, optical measurements are an indispensable tool for the study of
Be aware that there is no universal notation for the various quantities.
 Fourier Optics v2.4 Ray tracing is limited in its ability to describe optics because it ignores the wave properties of light. Diffraction is needed to explain image spatial resolution and contrast and
Single-Slit Diffraction. = m, (Eq. 1)
") Single-Slit Diffraction Experimental Objectives To observe the interference pattern formed by monochromatic light passing through a single slit. Compare the diffraction patterns of a single-slit and a
Single-Slit Diffraction Experimental Objectives To observe the interference pattern formed by monochromatic light passing through a single slit. Compare the diffraction patterns of a single-slit and a
Chapter 24. The Wave Nature of Light
 Ch-24-1 Chapter 24 The Wave Nature of Light Questions 1. Does Huygens principle apply to sound waves? To water waves? Explain how Huygens principle makes sense for water waves, where each point vibrates
Spectroscopy Application: Using Raman Spectroscopy to Detect Art Forgeries Detecting art forgeries using Raman spectroscopy
 Spectroscopy Application: Using Raman Spectroscopy to Detect Art Forgeries 5 Detecting art forgeries using Raman spectroscopy In the previous experiment, you were introduced to Raman spectroscopy. This
MicroLab 500-series Getting Started
 MicroLab 500-series Getting Started 2 Contents CHAPTER 1: Getting Started Connecting the Hardware....6 Installing the USB driver......6 Installing the Software.....8 Starting a new Experiment...8 CHAPTER
LlIGHT REVIEW PART 2 DOWNLOAD, PRINT and submit for 100 points
 WRITE ON SCANTRON WITH NUMBER 2 PENCIL DO NOT WRITE ON THIS TEST LlIGHT REVIEW PART 2 DOWNLOAD, PRINT and submit for 100 points Multiple Choice Identify the choice that best completes the statement or
Derrek Wilson. Recreating the Double Slit Experiment. UPII Spring 2009
 Derrek Wilson Recreating the Double Slit Experiment UPII Spring 2009 For my honors project in University Physics II, I decided to recreate Thomas Young s Double Slit Experiment. Young first performed this
LECTURE III: COLOR IN IMAGE & VIDEO DR. OUIEM BCHIR
 1 LECTURE III: COLOR IN IMAGE & VIDEO DR. OUIEM BCHIR 2 COLOR SCIENCE Light and Spectra Light is a narrow range of electromagnetic energy. Electromagnetic waves have the properties of frequency and wavelength.
Activity 1: Diffraction of Light
 Activity 1: Diffraction of Light When laser light passes through a small slit, it forms a diffraction pattern of bright and dark fringes (as shown below). The central bright fringe is wider than the others.
Lab 9 Photosynthesis. Background. Chromatography. Light Absorption
 Lab 9 Photosynthesis Background Plants, cyanobacteria, and algae convert light energy to chemical energy by the process of photosynthesis. This process involves utilizing light energy to combine water
Chemistry 524--"Hour Exam"--Keiderling Mar. 19, pm SES
 Chemistry 524--"Hour Exam"--Keiderling Mar. 19, 2013 -- 2-4 pm -- 170 SES Please answer all questions in the answer book provided. Calculators, rulers, pens and pencils permitted. No open books allowed.
Thursday 9 June 2016 Afternoon
 Oxford Cambridge and RSA Thursday 9 June 2016 Afternoon AS GCE PHYSICS A G482/01 Electrons, Waves and Photons *1164935362* Candidates answer on the Question Paper. OCR supplied materials: Data, Formulae
Reflection of Light, 8/8/2014, Optics
 Grade Level: 8 th Grade Physical Science Reflection of Light, 8/8/2014, Optics Duration: 2 days SOL(s): PS.9 The student will investigate and understand the characteristics of transverse waves. Key concepts
Physics 308 Laboratory Experiment F: Grating Spectrometer
 3/7/09 Physics 308 Laboratory Experiment F: Grating Spectrometer Motivation: Diffraction grating spectrometers are the single most widely used spectroscopic instrument. They are incorporated into many
CONFIGURING. Your Spectroscopy System For PEAK PERFORMANCE. A guide to selecting the best Spectrometers, Sources, and Detectors for your application
 CONFIGURING Your Spectroscopy System For PEAK PERFORMANCE A guide to selecting the best Spectrometers, s, and s for your application Spectral Measurement System Spectral Measurement System Spectrograph
EXPLORATIONS in OPTICS
 EXPLORATIONS in OPTICS 1. Exploring Light Spectra 3 2. What Color is a...? 7 3. Exploring Pinhole Images 9 4. Exploring Reflection 11 5. Hit the Target! 13 6. Exploring Refraction 15 7. Exploring Lenses
PH 481/581 Physical Optics Winter 2014
 PH 481/581 Physical Optics Winter 2014 Laboratory #1 Week of January 13 Read: Handout (Introduction & Projects #2 & 3 from Newport Project in Optics Workbook), pp.150-170 of Optics by Hecht Do: 1. Experiment
Horiba LabRAM ARAMIS Raman Spectrometer Revision /28/2016 Page 1 of 11. Horiba Jobin-Yvon LabRAM Aramis - Raman Spectrometer
 Page 1 of 11 Horiba Jobin-Yvon LabRAM Aramis - Raman Spectrometer The Aramis Raman system is a software selectable multi-wavelength Raman system with mapping capabilities with a 400mm monochromator and
Pre-Lab 10. Which plan or plans would work? Explain. Which plan is most efficient in regard to light power with the correct polarization? Explain.
 Pre-Lab 10 1. A laser beam is vertically, linearly polarized. For a particular application horizontal, linear polarization is needed. Two different students come up with different plans as to how to accomplish
Ultraviolet Visible Infrared Instrumentation
 Ultraviolet Visible Infrared Instrumentation Focus our attention on measurements in the UV-vis region of the EM spectrum Good instrumentation available Very widely used techniques Longstanding and proven
MASSACHUSETTS INSTITUTE OF TECHNOLOGY Department of Electrical Engineering and Computer Science
 Student Name Date MASSACHUSETTS INSTITUTE OF TECHNOLOGY Department of Electrical Engineering and Computer Science 6.161 Modern Optics Project Laboratory Laboratory Exercise No. 3 Fall 2005 Diffraction
Mylar Moon Boots. Supplies. Cardboard. Mylar blanket. Duct tape. Craft knife. Ruler. Pen/Pencil
 Mylar Moon Boots 1. Design a custom box. Measure the length, width, and height of your foot and add an inch to each of these measurements.» Now draw a rectangle on your cardboard that has the new dimensions
Lesson Plan: The Physics of Color Kevin Hugo Physics 335 December 15, 2004
 Lesson Plan: The Physics of Color Kevin Hugo Physics 335 December 15, 2004 Introduction Although educational research on the physics of color is far less advanced than other aspects of physics education,
Section 18.3 Behavior of Light
 Light and Materials When light hits an object it can be Section 18.3 Behavior of Light Light and Materials Objects can be classified as Transparent Translucent Opaque Transparent, Translucent, Opaque Transparent
Observational Astronomy
 Observational Astronomy Instruments The telescope- instruments combination forms a tightly coupled system: Telescope = collecting photons and forming an image Instruments = registering and analyzing the
Instructions For Building A Three-Pump Shared Aquifer Model
 Instructions For Building A Three-Pump Shared Aquifer Model Overview The following groundwater model and simulator can be constructed for less than $5.00 with a little planning. The most difficult parts
Experiment 10. Color. Observe the transmission properties of the three additive primary color filters and the three subtractive primary color filters.
 Experiment 10 Color 10.1 Objectives Observe the transmission properties of the three additive primary color filters and the three subtractive primary color filters. Observe and interpret the color sensations