ImageJ, A Useful Tool for Image Processing and Analysis Joel B. Sheffield
|
|
|
- Barrie Henderson
- 6 years ago
- Views:
Transcription
1 ImageJ, A Useful Tool for Image Processing and Analysis Joel B. Sheffield Temple University Dedicated to the memory of Dan H. Moore ( ) Presented at the 2008 meeting of the Microscopy and Microanalytical Societies
2 Why Image Processing? 1. To improve the appearance of the image. 2. To bring out obscure details in an image. 3. To carry out quantitative measurements
3 Part I. Introduction to ImageJ History Advantages Resources Macbiophotonics Mailing List Wiki Burger and Burge Basic Menu Structure Part II Special Issues Operations on all pixels in an image The histogram Brightness Contrast Look Up Tables RGB color Aspects of Analysis of an Image Measurement Calibration Areas and Densities Confocal Series Bandpass Filter

4
5 ImageJ An adaptation of NIH image for the Java platform. Can run on any computer systems that can run Java (Sun Microsystems) Open source Two powerful scripting languages Java Plugins Macro Language Continual Upgrades Active community of several thousand users
6 Resources ImageJ Web Site Macbiophotonics: Wiki: Burger and Burge (a real book!): Digital Image Processing, An Algorithmic Introduction using Java; Springer Verlag, 2008

7 Introduction to the Main Menu Of these, we ll concentrate on: Image Process Analyze Plugins Help

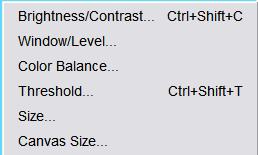
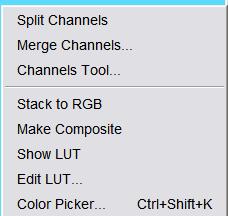
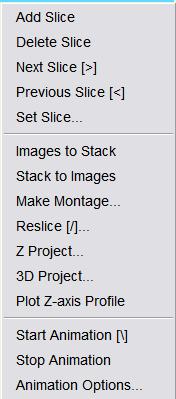
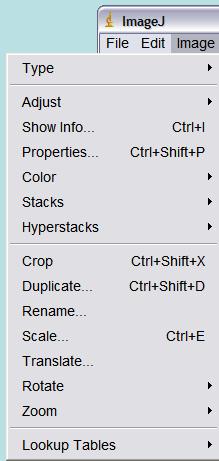
8 Image Menu

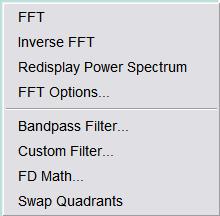
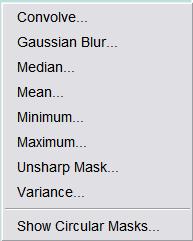
9 Process Menu

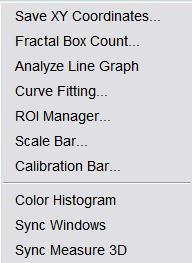
10 Analyze Menu

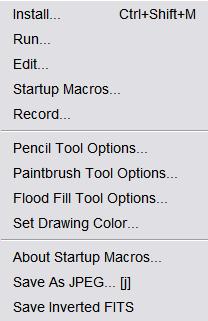
11 Plugins Menu
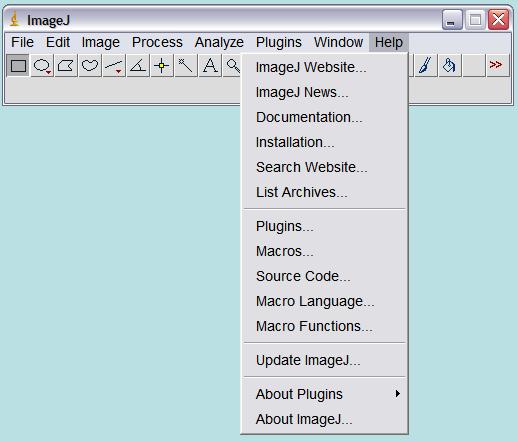
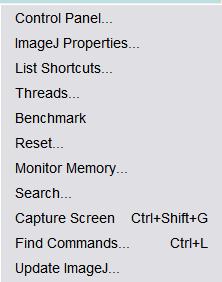
12 Help Menu


13 The Image Histogram Log Scale The histogram shows the number of pixels of each value, regardless of location. The log display allows for the visualization of minor components. Note that there are unused pixel values

14 In this case, the log display indicates that virtually all pixel values are used, even though they are a small percentage of the total.


15 Brightness Adjustment The brightness adjustment essentially adds or subtracts a constant to every pixel, causing a shift in the histogram along the x axis, but no change in the distribution


16 Contrast Enhancement For contrast enhancement, a lower value, in this case, 88, is set at zero, and a higher value, 166, is set at 255. The values of each of the pixels are adjusted proportionately. Note that because of the integer values, not all of the pixel values are used.


17 Look-Up Tables 8-bit images have no inherent color values. We normally assign values to each of the pixels according to a table. Because of earlier display devices, these values were shades of gray. As displays improved, it became possible to assign specific colors to given values. In ImageJ, there are three representations of LUTs.


18 Since some of these images, such as a fluorescence micrograph are of colored objects, it is useful to apply a color LUT to match the expected image, or to enhance it, even if the camera was monochrome.


19 The other way to treat color is to assign a set of 3 values, for Red, Green and Blue to each pixel. For common color images, each of the three colors is represented as an 8-bit value. One can think of a color image as consisting of three planes, one for each of the primary colors
20 As we move the cursor over different parts of the image, the color values appear in the status bar of the program. A color histogram is available, In the Analyze>Tools>Misc. menu


21 This can be used to correct white balance in micrographs Select an area that is to be white. Determine the adjustments necessary for each channel, and use the RGB Recolor plugin to balance the values Adjust brightness and contrast


22 Conversion to grey scale Since many operations will work only on grey scale images, it is necessary to consider how the conversions from color images can be accomplished. There are two approaches, dependent on the type of image. The simplest is to select the image, go to Image>type, and select 8-bit, or 16 or 32 bit.
 to generate the image.")
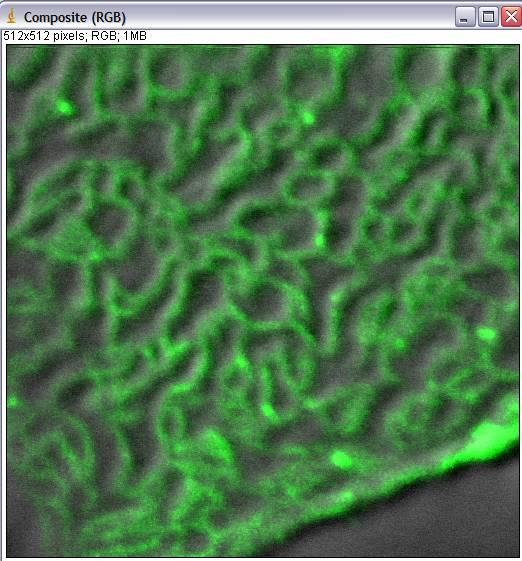
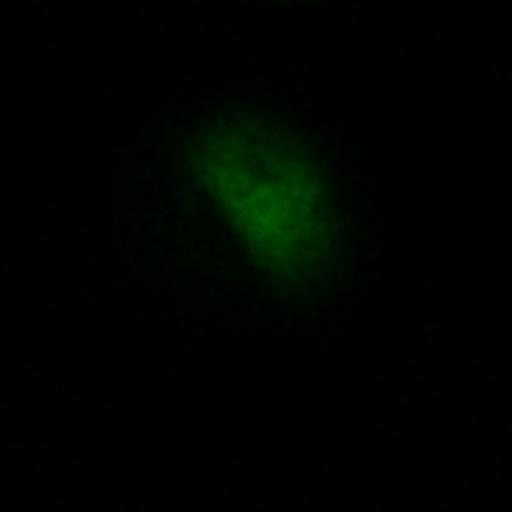
23 However, some images, such as fluorescence micrographs taken as RGB images, can yield surprises. The reason that the image is so dark is that the routine averages the three channels (rgb) to generate the image. Since there is no data in g or b, the values for the red channel are divided by 3, yielding a dark image.


24 We can overcome this by separating the three channels and discarding those with no data.


25 Compare the two 8-bit images, after correction for brightness 8-bit Channel separation Because of the reduction in values in the 8-bit conversion, there are fewer values in the histogram.


26 Color Merge Many fluorescence images are taken in single channel images which are often merged to generate a single overlapped image. Some cameras generate rgb images even of single color fluorescence In that case, the images have to be converted to 8-bit before processing.


27 Another Issue: colors + gray scale What happened?

, we can divide each of the planes, so that the maximum value of")
28 The value at any pixel is the sum of all four channels. Remember that the gray channel actually has values for r,g, and b. These are added to the other values, and exceed the 255 limit. Since the image is a composite (i.e. each plane is represented separately and the images are combined), we can divide each of the planes, so that the maximum value of the additions is less than 255. We can then adjust brightness and contrast to compensate without exceeding the limit.


29 Divide by 2 Convert to RGB and adjust
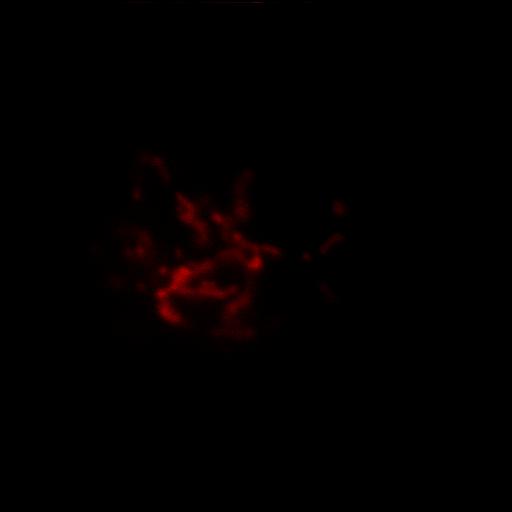
30 Confocal Microscope Series

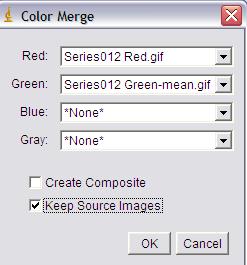
31 Merge the Red and Green


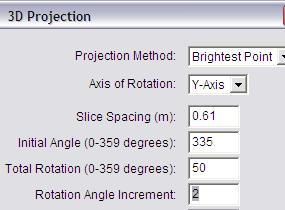
32 Creating a 3D Rotating Image

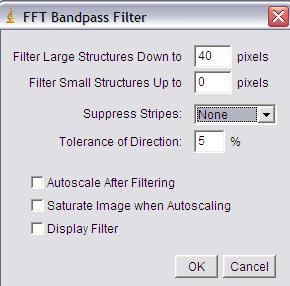
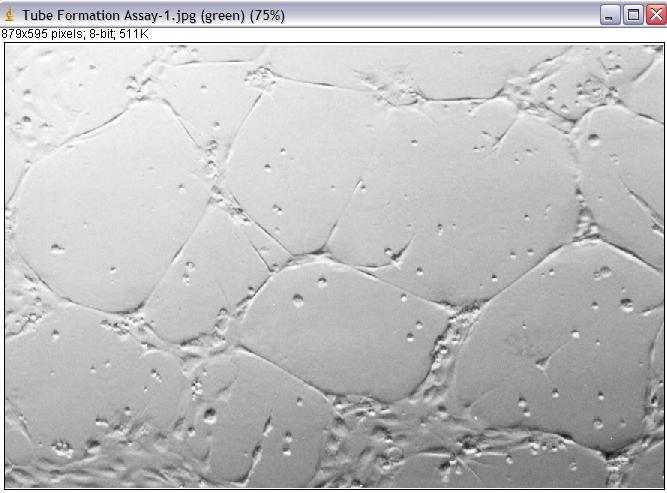
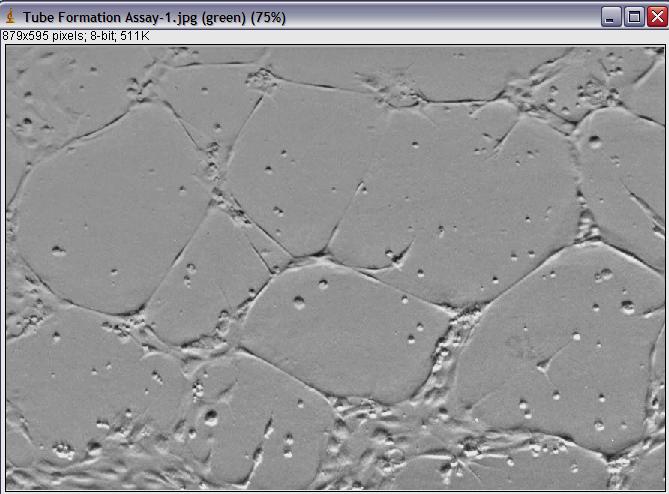
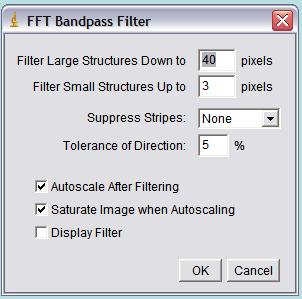
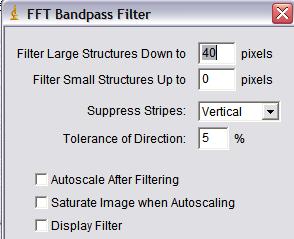
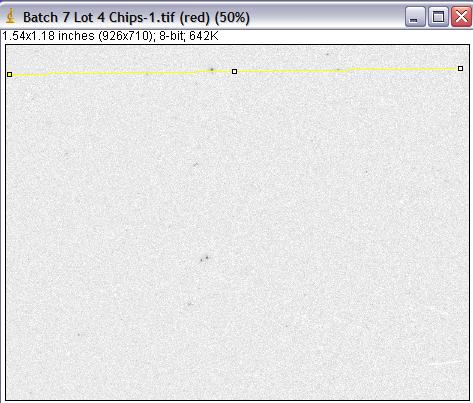
33 Bandpass Filter to smooth background
 4. Size is given as 1.54x1.")
34 Image courtesy of Wu Yuhong: 1. It is RGB 2. Low contrast 3. Uneven background (stripes from a scanner) 4. Size is given as 1.54x1.18 inches

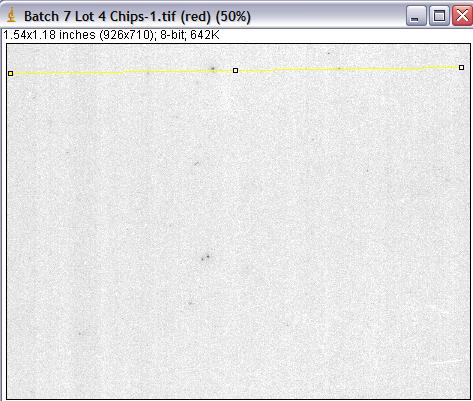
35 The goal is to count, and measure the spots. The approach has to evolve, but here are the essential elements: 1. Since all of the spots appear to be black, color is not significant, and one can use a monochrome image. 2. The background must be dealt with. 3. The spots need to be discriminated from the background several options. 4. We can scan a line across the image, storing the coordinates. Note the slight rise upwards, Also the range, from 140-ish to 130 or so for the largest dot.

36 Adjust contrast and brightness according to the histogram


37 Separate channels, scan each. red green blue It appears that the greatest difference between the background and the signal is in the red channel, but there are stripes on the image.
38


39 we can use the graph of the image to make a rough determination of the threshold, and then tune it by looking as the selection.


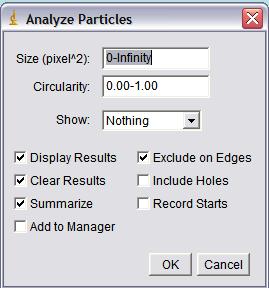
40 Exclude very small objects by selecting a size > 10 But look at these measurements!


41 Let s take a closer look at the original image Specifically the dimensions as given in the header. We can see how ImageJ decided on these numbers by looking at the Image>Properties menu item. Note that it lists the unit of length as the inch, and the width of a pixel as Where did that come from? Well, if we look at the image with another program, IrfanView, or Photoshop, we will discover that the image is listed as containing 600 dpi. That information is encoded in the tiff header for the image. It is not listed in jpg versions. So, in its wisdom. ImageJ reads the 600 dpi and calculates the number of inches that would be taken up by 926 pixels. Since the original image was obtained from a scanner, using 600 dpi as a standard, this is reasonable.


42 We can change the unit of length to, say, mm, and the pixel width changes to adjust. The results of the analysis, then, are presented in mm, rather than inches.* *We have discovered that the camera we use for micrography also includes a value of 96 dpi in our images, which has to be corrected. The value of 96 is, we assume, related to print size. At any rate, we have to restandardize each image.
43 For more information, the web site is
IMAGE ENHANCEMENT - POINT PROCESSING
 1 IMAGE ENHANCEMENT - POINT PROCESSING KOM3212 Image Processing in Industrial Systems Some of the contents are adopted from R. C. Gonzalez, R. E. Woods, Digital Image Processing, 2nd edition, Prentice
The BIOS in many personal computers stores the date and time in BCD. M-Mushtaq Hussain
 Practical applications of BCD The BIOS in many personal computers stores the date and time in BCD Images How data for a bitmapped image is encoded? A bitmap images take the form of an array, where the
Images for PowerPoint Scanning, adjusting, & saving digital images
 Images for PowerPoint Scanning, adjusting, & saving digital images Susann Lusnia Digital Trends Seminar Tulane University April 17, 2008 Susann Lusnia email: slusnia@tulane.edu Classical Studies, Tulane
Photoshop 01. Introduction to Computer Graphics UIC / AA/ AD / AD 205 / F05/ Sauter.../documents/photoshop_01.pdf
 Photoshop 01 Introduction to Computer Graphics UIC / AA/ AD / AD 205 / F05/ Sauter.../documents/photoshop_01.pdf Topics Raster Graphics Document Setup Image Size & Resolution Tools Selecting and Transforming
User Reference Manual
 User Reference Manual IN SITU HYBRIDIZATION QUANTIFICATION (for research purposes only) Contents Overview... 3 System Requirements... 3 Compatible File Formats... 3 Input Parameters... 4 Output Parameters...
HISTOGRAMS. These notes are a basic introduction to using histograms to guide image capture and image processing.
 HISTOGRAMS Roy Killen, APSEM, EFIAP, GMPSA These notes are a basic introduction to using histograms to guide image capture and image processing. What are histograms? Histograms are graphs that show what
Computer Graphics Fundamentals
 Computer Graphics Fundamentals Jacek Kęsik, PhD Simple converts Rotations Translations Flips Resizing Geometry Rotation n * 90 degrees other Geometry Rotation n * 90 degrees other Geometry Translations
Color and More. Color basics
 Color and More In this lesson, you'll evaluate an image in terms of its overall tonal range (lightness, darkness, and contrast), its overall balance of color, and its overall appearance for areas that
Image Capture TOTALLAB
 1 Introduction In order for image analysis to be performed on a gel or Western blot, it must first be converted into digital data. Good image capture is critical to guarantee optimal performance of automated
MIF ZEISS LSM510 CONFOCAL USER PROTOCOL
 MIF ZEISS LSM510 CONFOCAL USER PROTOCOL START-UP Turn on the Mercury Bulb Power Supply (if needed). Power-on the Control Box. Turn on the computer. Open the LSM 510 software. Choose Scan New Images and
Image Processing. 2. Point Processes. Computer Engineering, Sejong University Dongil Han. Spatial domain processing
 Image Processing 2. Point Processes Computer Engineering, Sejong University Dongil Han Spatial domain processing g(x,y) = T[f(x,y)] f(x,y) : input image g(x,y) : processed image T[.] : operator on f, defined
This PDF file is best viewed at actual size (Command-H on the Mac; Control-H on the PC) to maximize the clarity of photos and screenshots.
 to maximize the clarity of photos and screenshots.") BLACK & WHITE CORRECTIONS IN PHOTOSHOP This PDF file is best viewed at actual size (Command-H on the Mac; Control-H on the PC) to maximize the clarity of photos and screenshots. INITIAL SCANS: Resolution
BLACK & WHITE CORRECTIONS IN PHOTOSHOP This PDF file is best viewed at actual size (Command-H on the Mac; Control-H on the PC) to maximize the clarity of photos and screenshots. INITIAL SCANS: Resolution
(RGB images only) Ctrl-click (Windows) or Command-click (Mac OS) a pixel in the image.
 Ctrl-click (Windows) or Command-click (Mac OS) a pixel in the image.") PHOTOSHOP TOOLS USING CURVES: To adjust tonality with Curves, do one of the following: Choose Image > Adjustments > Curves. Choose Layer > New Adjustment Layer > Curves. Click OK in the New Layer dialog
PHOTOSHOP TOOLS USING CURVES: To adjust tonality with Curves, do one of the following: Choose Image > Adjustments > Curves. Choose Layer > New Adjustment Layer > Curves. Click OK in the New Layer dialog
Machinery HDR Effects 3
 1 Machinery HDR Effects 3 MACHINERY HDR is a photo editor that utilizes HDR technology. You do not need to be an expert to achieve dazzling effects even from a single image saved in JPG format! MACHINERY
PHOTOSHOP. pixel based image editing software (pixel=picture element) several small dots or pixels make up an image.
 several small dots or pixels make up an image.") Photoshop PHOTOSHOP pixel based image editing software (pixel=picture element) several small dots or pixels make up an image. RESOLUTION measurement of the total number of pixels displayed determines the
Photoshop PHOTOSHOP pixel based image editing software (pixel=picture element) several small dots or pixels make up an image. RESOLUTION measurement of the total number of pixels displayed determines the
Contents Downloading and installing IrfanView.. 1
 Contents Downloading and installing IrfanView.. 1 Rotating Images. 2 Resizing/Resample Images.. 3 Cropping Images.... 4 Thumbnail View.. 5 Effects.. 6 Downloading and installing IrfanView IrFanView is
μscope Microscopy Software
 μscope Microscopy Software Pixelink μscope Essentials (ES) Software is an easy-to-use robust image capture tool optimized for productivity. Pixelink μscope Standard (SE) Software had added features, making
The Camera Club. David Champion January 2011
 The Camera Club B&W Negative Proccesing After Scanning. David Champion January 2011 That s how to scan a negative, now I will explain how to process the image using Photoshop CS5. To achieve a good scan
(Quantitative Imaging for) Colocalisation Analysis
 Colocalisation Analysis") (Quantitative Imaging for) Colocalisation Analysis or Why Colour Merge / Overlay Images are EVIL! Special course for DIGS-BB PhD program What is an Image anyway..? An image is a representation of reality
(Quantitative Imaging for) Colocalisation Analysis or Why Colour Merge / Overlay Images are EVIL! Special course for DIGS-BB PhD program What is an Image anyway..? An image is a representation of reality
from: Point Operations (Single Operands)
") from: http://www.khoral.com/contrib/contrib/dip2001 Point Operations (Single Operands) Histogram Equalization Histogram equalization is as a contrast enhancement technique with the objective to obtain
from: http://www.khoral.com/contrib/contrib/dip2001 Point Operations (Single Operands) Histogram Equalization Histogram equalization is as a contrast enhancement technique with the objective to obtain
SECTION I - CHAPTER 2 DIGITAL IMAGING PROCESSING CONCEPTS
 RADT 3463 - COMPUTERIZED IMAGING Section I: Chapter 2 RADT 3463 Computerized Imaging 1 SECTION I - CHAPTER 2 DIGITAL IMAGING PROCESSING CONCEPTS RADT 3463 COMPUTERIZED IMAGING Section I: Chapter 2 RADT
One Week to Better Photography
 One Week to Better Photography Glossary Adobe Bridge Useful application packaged with Adobe Photoshop that previews, organizes and renames digital image files and creates digital contact sheets Adobe Photoshop
Digital Images. Digital Images. Digital Images fall into two main categories
 Digital Images Digital Images Scanned or digitally captured image Image created on computer using graphics software Digital Images fall into two main categories Vector Graphics Raster (Bitmap) Graphics
Sampling Rate = Resolution Quantization Level = Color Depth = Bit Depth = Number of Colors
 ITEC2110 FALL 2011 TEST 2 REVIEW Chapters 2-3: Images I. Concepts Graphics A. Bitmaps and Vector Representations Logical vs. Physical Pixels - Images are modeled internally as an array of pixel values
4. Measuring Area in Digital Images
 Chapter 4 4. Measuring Area in Digital Images There are three ways to measure the area of objects in digital images using tools in the AnalyzingDigitalImages software: Rectangle tool, Polygon tool, and
Practical Image and Video Processing Using MATLAB
 Practical Image and Video Processing Using MATLAB Chapter 1 Introduction and overview What will we learn? What is image processing? What are the main applications of image processing? What is an image?
NEUROIMAGING DATA ANALYSIS SOFTWARE
 NEUROIMAGING DATA ANALYSIS SOFTWARE Emilia Dana SELEŢCHI Abstract: Recent advanced in neuroimaging have significantly improved understanding of the brain and the mind. A variety of image analysis software
Grid Assembly. User guide. A plugin developed for microscopy non-overlapping images stitching, for the public-domain image analysis package ImageJ
 BIOIMAGING AND OPTIC PLATFORM Grid Assembly A plugin developed for microscopy non-overlapping images stitching, for the public-domain image analysis package ImageJ User guide March 2008 Introduction In
Image Smoothing. Controlling printed output. Printing. Using color. Paper handling. Maintenance. Troubleshooting. Administration.
 Your printer driver provides you with the best quality output for various types of printing needs. However, you may want more control over how your printed document will look. 1 Your printer default is
Cellular Bioengineering Boot Camp. Image Analysis
 Cellular Bioengineering Boot Camp Image Analysis Overview of the Lab Exercises Microscopy and Cellular Imaging The purpose of this laboratory exercise is to develop an understanding of the measurements
6. Graphics MULTIMEDIA & GRAPHICS 10/12/2016 CHAPTER. Graphics covers wide range of pictorial representations. Uses for computer graphics include:
 CHAPTER 6. Graphics MULTIMEDIA & GRAPHICS Graphics covers wide range of pictorial representations. Uses for computer graphics include: Buttons Charts Diagrams Animated images 2 1 MULTIMEDIA GRAPHICS Challenges
DodgeCmd Image Dodging Algorithm A Technical White Paper
 DodgeCmd Image Dodging Algorithm A Technical White Paper July 2008 Intergraph ZI Imaging 170 Graphics Drive Madison, AL 35758 USA www.intergraph.com Table of Contents ABSTRACT...1 1. INTRODUCTION...2 2.
What is a digital image?
 Chapter 4 What is a digital image? 4.1 How is the image represented by the computer? Pixels Images can have 2 or 3 spacial dimensions, a time dimensions and a number of colour-channels. An image is a rectilinear
Color is the factory default setting. The printer driver is capable of overriding this setting. Adjust the color output on the printed page.
 Page 1 of 6 Color quality guide The Color quality guide helps users understand how operations available on the printer can be used to adjust and customize color output. Quality menu Use Print Mode Color
Quick Guide for Zeiss 710 Laser Scanning Confocal MGH Cancer Center
 Quick Guide for Zeiss 710 Laser Scanning Confocal MGH Cancer Center For any questions or concerns, please contact: Linda Nieman lnieman@mgh.harvard.edu Office: (617) 643-9684 Cell: (512) 565-8076 Chenyue
Kigamo Scanback which fits in your view camera in place of conventional film.
 What's included Kigamo Scanback which fits in your view camera in place of conventional film. SCSI Cable to connect your Scanback to the host computer. A 3-meter SCSI cable is standard. Kigamo also has
Enhancement of Multispectral Images and Vegetation Indices
 Enhancement of Multispectral Images and Vegetation Indices ERDAS Imagine 2016 Description: We will use ERDAS Imagine with multispectral images to learn how an image can be enhanced for better interpretation.
DIGITAL-MICROSCOPY CAMERA SOLUTIONS USB 3.0
 DIGITAL-MICROSCOPY CAMERA SOLUTIONS USB 3.0 PixeLINK for Microscopy Applications PixeLINK will work with you to choose and integrate the optimal USB 3.0 camera for your microscopy project. Ideal for use
Digitizing Film Using the D850 and ES-2 Negative Digitizer
 JULY 23, 2018 INTERMEDIATE Digitizing Film Using the D850 and ES-2 Negative Digitizer The ES 2 can be used with both strip film and mounted slides. Digitizing film is the process of creating digital data
THERMOIMAGING THEORY THERMOGRAPHY PRINCIPLES
 Thermoimaging EPPN Summer School THERMOIMAGING THEORY THERMOIMAGING - a non-destructive method suitable for monitoring spatial distribution of temperature (Instrument: Thermal camera TC) THERMAL CAMERA
Introduction to BioImage Analysis using Fiji
 Introduction to BioImage Analysis using Fiji CellNetworks Math-Clinic core facility Qi Gao Carlo A. Beretta 12.05.2017 Math-Clinic core facility Data analysis services on bioinformatics & bioimage analysis:
Images and Displays. Lecture Steve Marschner 1
 Images and Displays Lecture 2 2008 Steve Marschner 1 Introduction Computer graphics: The study of creating, manipulating, and using visual images in the computer. What is an image? A photographic print?
Raster (Bitmap) Graphic File Formats & Standards
 Graphic File Formats & Standards") Raster (Bitmap) Graphic File Formats & Standards Contents Raster (Bitmap) Images Digital Or Printed Images Resolution Colour Depth Alpha Channel Palettes Antialiasing Compression Colour Models RGB Colour
Raster (Bitmap) Graphic File Formats & Standards Contents Raster (Bitmap) Images Digital Or Printed Images Resolution Colour Depth Alpha Channel Palettes Antialiasing Compression Colour Models RGB Colour
AF Area Mode. Face Priority
 Chapter 4: The Shooting Menu 71 AF Area Mode This next option on the second screen of the Shooting menu gives you several options for controlling how the autofocus frame is set up when the camera is in
3) Start ImageJ, install CM Engine as a macro (instructions here:
 Start ImageJ, install CM Engine as a macro (instructions here:") Instructions for CM Engine use 1) Download CM Engine from SourceForge (http://cm- engine.sourceforge.net/) or from the Rothstein Lab website (http://www.rothsteinlab.com/cm- engine.zip ). 2) Download ImageJ
Instructions for CM Engine use 1) Download CM Engine from SourceForge (http://cm- engine.sourceforge.net/) or from the Rothstein Lab website (http://www.rothsteinlab.com/cm- engine.zip ). 2) Download ImageJ
Positive Pixel Count Algorithm. User s Guide
 Positive Pixel Count Algorithm User s Guide Copyright 2004, 2006 2008 Aperio Technologies, Inc. Part Number/Revision: MAN 0024, Revision B Date: December 9, 2008 This document applies to software versions
Technical Note How to Compensate Lateral Chromatic Aberration
 Lateral Chromatic Aberration Compensation Function: In JAI color line scan cameras (3CCD/4CCD/3CMOS/4CMOS), sensors and prisms are precisely fabricated. On the other hand, the lens mounts of the cameras
There must be hundreds of
 There must be hundreds of scanners on the market, ranging in price from less than $100 to tens of thousands of dollars. One attribute common to all these scanners is the need for driver software. No matter
Dr. Bob on Colocalization or MSL Experiments In Learning Colocalization Using Image J
 Dr. Bob on Colocalization or MSL Experiments In Learning Colocalization Using Image J Confocal microscopy is used to test whether two fluorescently labeled molecules are associated with one another. If
Introduction to BioImage Analysis
 Introduction to BioImage Analysis Qi Gao CellNetworks Math-Clinic core facility 22-23.02.2018 MATH- CLINIC Math-Clinic core facility Data analysis services on bioimage analysis & bioinformatics: 1-to-1
Digital Image Processing. Lecture # 3 Image Enhancement
 Digital Image Processing Lecture # 3 Image Enhancement 1 Image Enhancement Image Enhancement 3 Image Enhancement 4 Image Enhancement Process an image so that the result is more suitable than the original
Introduction to Image Analysis with
 Introduction to Image Analysis with PLEASE ENSURE FIJI IS INSTALLED CORRECTLY! WHAT DO WE HOPE TO ACHIEVE? Specifically, the workshop will cover the following topics: 1. Opening images with Bioformats
F400. Detects subtle color differences. Color-graying vision sensor. Features
 Color-graying vision sensor Detects subtle color differences Features In addition to regular color extraction, the color-graying sensor features the world's first color-graying filter. This is a completely
Topic 04 What is a digital image?
 Topic 04 What is a digital image? Exercise 4.1 How is the image represented by the computer - Pixels Images can have 2 or 3 spacial dimensions, a time dimensions and a number of colour-channels. An image
Introduction to ImageJ 8 Sept 2009
 Biomedical Imaging Research Unit School of Medical Sciences Faculty of Medical and Health Sciences The University of Auckland Private Bag 92019 Auckland, NZ Ph: 373 7599 ext. 87438 http://www.auckland.ac.nz/biru/
How is the Digital Image Generated? Image Acquisition Devices
 In order for image analysis to be performed on a 2D gel, it must first be converted into digital data. Good image capture is critical to guarantee optimal performance of automated image analysis packages
MassArt Studio Foundation: Visual Language Digital Media Cookbook, Fall 2013
 21 / TONAL SCALE 1 In this section we ll be exploring tonal scale and how to adjust it using Photoshop to address common problems such as blown out highlights, murky images lacking contrast or a colorcast
Images and Graphics. 4. Images and Graphics - Copyright Denis Hamelin - Ryerson University
 Images and Graphics Images and Graphics Graphics and images are non-textual information that can be displayed and printed. Graphics (vector graphics) are an assemblage of lines, curves or circles with
Applying mathematics to digital image processing using a spreadsheet
 Jeff Waldock Applying mathematics to digital image processing using a spreadsheet Jeff Waldock Department of Engineering and Mathematics Sheffield Hallam University j.waldock@shu.ac.uk Introduction When
WiseContact. scan, edit, analyze
 WiseContact scan, edit, analyze W isecontact package combines the power of WiseImage software and special plug-in to solve the toughest pressure measurement problems. It can process monochrome, grayscale
Chapter 3 Part 2 Color image processing
 Chapter 3 Part 2 Color image processing Motivation Color fundamentals Color models Pseudocolor image processing Full-color image processing: Component-wise Vector-based Recent and current work Spring 2002
Fig 1: Error Diffusion halftoning method
 Volume 3, Issue 6, June 013 ISSN: 77 18X International Journal of Advanced Research in Computer Science and Software Engineering Research Paper Available online at: www.ijarcsse.com An Approach to Digital
PENGENALAN TEKNIK TELEKOMUNIKASI CLO
 PENGENALAN TEKNIK TELEKOMUNIKASI CLO : 4 Digital Image Faculty of Electrical Engineering BANDUNG, 2017 What is a Digital Image A digital image is a representation of a two-dimensional image as a finite
Point Spread Function Estimation Tool, Alpha Version. A Plugin for ImageJ
 Tutorial Point Spread Function Estimation Tool, Alpha Version A Plugin for ImageJ Benedikt Baumgartner Jo Helmuth jo.helmuth@inf.ethz.ch MOSAIC Lab, ETH Zurich www.mosaic.ethz.ch This tutorial explains
Figure 1 HDR image fusion example
 TN-0903 Date: 10/06/09 Using image fusion to capture high-dynamic range (hdr) scenes High dynamic range (HDR) refers to the ability to distinguish details in scenes containing both very bright and relatively
Introduction to Color Theory
 Systems & Biomedical Engineering Department SBE 306B: Computer Systems III (Computer Graphics) Dr. Ayman Eldeib Spring 2018 Introduction to With colors you can set a mood, attract attention, or make a
Screening Basics Technology Report
 Screening Basics Technology Report If you're an expert in creating halftone screens and printing color separations, you probably don't need this report. This Technology Report provides a basic introduction
DIGITAL IMAGE PROCESSING (COM-3371) Week 2 - January 14, 2002
 Week 2 - January 14, 2002") DIGITAL IMAGE PROCESSING (COM-3371) Week 2 - January 14, 22 Topics: Human eye Visual phenomena Simple image model Image enhancement Point processes Histogram Lookup tables Contrast compression and stretching
DIGITAL IMAGE PROCESSING (COM-3371) Week 2 - January 14, 22 Topics: Human eye Visual phenomena Simple image model Image enhancement Point processes Histogram Lookup tables Contrast compression and stretching
Zeiss Axiovert 135 Fluorescence Microscope Quick Guide / Operations Manual (v. 1.0 February 09)
") University of Chicago Integrated Light Microscopy Core Dr. Vytas Bindokas, Director http://digital.bsd.uchicago.edu By: Christine Labno, Assistant Director Room: AB-129 Phone: 4-9040 Zeiss Axiovert 135
University of Chicago Integrated Light Microscopy Core Dr. Vytas Bindokas, Director http://digital.bsd.uchicago.edu By: Christine Labno, Assistant Director Room: AB-129 Phone: 4-9040 Zeiss Axiovert 135
Considerations. image solid color for tracing make sure your traced shapes are a single solid color - Black RGB 0,0,0 or #000000
 2D Design Object Description Form Fit and Function (FFF) Design for laser cut elements.bmp or.jpg border at least 300 dpi allow 1/8 margin for boarder of the material image solid color for tracing make
Digital Images. Back to top-level. Digital Images. Back to top-level Representing Images. Dr. Hayden Kwok-Hay So ENGG st semester, 2010
 0.9.4 Back to top-level High Level Digital Images ENGG05 st This week Semester, 00 Dr. Hayden Kwok-Hay So Department of Electrical and Electronic Engineering Low Level Applications Image & Video Processing
Why Should We Care? Everyone uses plotting But most people ignore or are unaware of simple principles Default plotting tools are not always the best
 Elementary Plots Why Should We Care? Everyone uses plotting But most people ignore or are unaware of simple principles Default plotting tools are not always the best More importantly, it is easy to lie
JCB Feature. What s in a picture? The temptation of image manipulation. The Journal of Cell Biology
 JCB Feature What s in a picture? The temptation of image manipulation Mike Rossner 1 and Kenneth M. Yamada 2 1 Managing Editor, The Journal of Cell Biology 2 Editor, The Journal of Cell Biology, and the
4/9/2015. Simple Graphics and Image Processing. Simple Graphics. Overview of Turtle Graphics (continued) Overview of Turtle Graphics
 Overview of Turtle Graphics") Simple Graphics and Image Processing The Plan For Today Website Updates Intro to Python Quiz Corrections Missing Assignments Graphics and Images Simple Graphics Turtle Graphics Image Processing Assignment
Simple Graphics and Image Processing The Plan For Today Website Updates Intro to Python Quiz Corrections Missing Assignments Graphics and Images Simple Graphics Turtle Graphics Image Processing Assignment
Terms and Definitions. Scanning
 Terms and Definitions Scanning A/D Converter Building block of a scanner. Converts the electric, analog signals to computer-ready, digital signals. Scanners Aliasing The visibility of individual pixels,
CREATING A COMPOSITE
 CREATING A COMPOSITE In a digital image, the amount of detail that a digital camera or scanner captures is frequently called image resolution, however, this should be referred to as pixel dimensions. This
In this rather technical follow-up article to my original
 Adjusting Photographs for Print or Web Use In this rather technical follow-up article to my original photography article, I will discuss how I use Photoshop CS5 after taking photos of flow blue or mulberry
2. Pixels and Colors. Introduction to Pixels. Chapter 2. Investigation Pixels and Digital Images
 2. Pixels and Colors Introduction to Pixels The term pixel is a truncation of the phrase picture element which is exactly what a pixel is. A pixel is the smallest block of color in a digital picture. The
A lthough it may not seem so at first
 Photoshop Selections by Jeff The Wizard of Draws Bucchino www.wizardofdraws.com A lthough it may not seem so at first glance, learning to use Photoshop is largely about making selections. Knowing how to
Digitizing Color. Place Value in a Decimal Number. Place Value in a Binary Number. Chapter 11: Light, Sound, Magic: Representing Multimedia Digitally
 Chapter 11: Light, Sound, Magic: Representing Multimedia Digitally Fluency with Information Technology Third Edition by Lawrence Snyder Digitizing Color RGB Colors: Binary Representation Giving the intensities
1. Describe how a graphic would be stored in memory using a bit-mapped graphics package.
 HIGHER COMPUTING COMPUTER SYSTEMS DATA REPRESENTATION GRAPHICS SUCCESS CRITERIA I can describe the bit map method of graphic representation using examples of colour or greyscale bit maps. I can describe
Basics of Quantitative Imaging and Image Processing Using ImageJ / Fiji. Dan White Nov 2008
 MPI-CBG LMF / IPF Basics of Quantitative Imaging and Image Processing Using ImageJ / Fiji Dan White Nov 2008 Before you start writing... Presentations soon available at: http://tu-dresden.de/med/ifn Light
When scanning 3 D objects, open or remove the lid of the scanner, depending on your scanner and/or preferences, either way is fine.
 The first day that someone accidentally photocopied their hand while trying to copy a document it became inevitable that people would start using copiers and other equipment intended for flat surfaces
Scientific Imaging Image Analysis worksheet Page 1 of 8. Image Analysis
 Scientific Imaging Image Analysis worksheet Page 1 of 8 Image Analysis Part 1 - Data Analysis: We will Photoshop software to determine the area of leaves. Option 1: Open the file provided by your instructor.
2013 LMIC Imaging Workshop. Sidney L. Shaw Technical Director. - Light and the Image - Detectors - Signal and Noise
 2013 LMIC Imaging Workshop Sidney L. Shaw Technical Director - Light and the Image - Detectors - Signal and Noise The Anatomy of a Digital Image Representative Intensities Specimen: (molecular distribution)
Press-Ready Folder Guide
 Press-Ready Folder Guide Our online system enables you to upload logos, images, and text to build folder parts (front, back, pockets, and handbook). You may also upload completed press-ready parts. Press-ready
Computer Vision. Howie Choset Introduction to Robotics
 Computer Vision Howie Choset http://www.cs.cmu.edu.edu/~choset Introduction to Robotics http://generalrobotics.org What is vision? What is computer vision? Edge Detection Edge Detection Interest points
Dr. Shahanawaj Ahamad. Dr. S.Ahamad, SWE-423, Unit-06
 Dr. Shahanawaj Ahamad 1 Outline: Basic concepts underlying Images Popular Image File formats Human perception of color Various Color Models in use and the idea behind them 2 Pixels -- picture elements
5/17/2009. Digitizing Color. Place Value in a Binary Number. Place Value in a Decimal Number. Place Value in a Binary Number
 Chapter 11: Light, Sound, Magic: Representing Multimedia Digitally Digitizing Color Fluency with Information Technology Third Edition by Lawrence Snyder RGB Colors: Binary Representation Giving the intensities
WORKING WITH COLOR Monitor Placement Place the monitor at roughly right angles to a window. Place the monitor at least several feet from any window
 WORKING WITH COLOR In order to work consistently with color printing, you need to calibrate both your monitor and your printer. The basic steps for doing so are listed below. This is really a minimum approach;
Spotlight White paper
 Spotlight White paper Benefits of digital highlighting vs. laser By Logitech, December 2017 EXECUTIVE SUMMARY The new Logitech Spotlight Presentation Remote with digital highlighting solves the laser visibility
CS 445 HW#2 Solutions
 1. Text problem 3.1 CS 445 HW#2 Solutions (a) General form: problem figure,. For the condition shown in the Solving for K yields Then, (b) General form: the problem figure, as in (a) so For the condition
Wisconsin Heritage Online Digital Imaging Guidelines QUICK GUIDE TO SCANNING
 Wisconsin Heritage Online Digital Imaging Guidelines QUICK GUIDE TO SCANNING January 2010 This Scanning Quick Guide is a summary of the recommended scanning standards for WHO Content Providers. It is intended
ImageJ: Introduction to Image Analysis 3 May 2012 Jacqui Ross
 Biomedical Imaging Research Unit School of Medical Sciences Faculty of Medical and Health Sciences The University of Auckland Private Bag 92019 Auckland 1142, NZ Ph: 373 7599 ext. 87438 http://www.fmhs.auckland.ac.nz/sms/biru/.
Female Height. Height (inches)
") Math 111 Normal distribution NAME: Consider the histogram detailing female height. The mean is 6 and the standard deviation is 2.. We will use it to introduce and practice the ideas of normal distributions.
Math 111 Normal distribution NAME: Consider the histogram detailing female height. The mean is 6 and the standard deviation is 2.. We will use it to introduce and practice the ideas of normal distributions.
Exercise NMCGJ: Image Processing
 Exercise NMCGJ: Image Processing A digital picture (or image) is internally stored as an array or a matrix of pixels (= picture elements), each of them containing a specific color. This exercise is devoted
Digital Imaging and Image Editing
 Digital Imaging and Image Editing A digital image is a representation of a twodimensional image as a finite set of digital values, called picture elements or pixels. The digital image contains a fixed
Digital Image Processing
 Digital Image Processing Digital Imaging Fundamentals Christophoros Nikou cnikou@cs.uoi.gr Images taken from: R. Gonzalez and R. Woods. Digital Image Processing, Prentice Hall, 2008. Digital Image Processing
Acquisition and representation of images
 Acquisition and representation of images Stefano Ferrari Università degli Studi di Milano stefano.ferrari@unimi.it Elaborazione delle immagini (Image processing I) academic year 2011 2012 Electromagnetic
Rapid Non linear Image Scanning Microscopy, Supplementary Notes
 Rapid Non linear Image Scanning Microscopy, Supplementary Notes Calculation of theoretical PSFs We calculated the electrical field distribution using the wave optical theory developed by Wolf 1, and Richards