Synthetic Aperture Radar Interferometry (InSAR) Technique (Lecture I- Tuesday 11 May 2010)
|
|
|
- Prosper Owen
- 6 years ago
- Views:
Transcription
1 Synthetic Aperture Radar Interferometry () Technique (Lecture I- Tuesday 11 May 2010) ISNET/CRTEAN Training Course on Synthetic Aperture Radar (SAR) Imagery: Processing, Interpretation and Applications 3-14 May 2010, Tunis, Tunisia Parviz Tarikhi, PhD Mahdasht Satellite Receiving Station, ISA, Iran
2 Rapid and dynamic changes in technologies in recent decades Space technologies and exploration is avant-garde Sensing and detecting phenomena from long distance is of great importance and effect. Electromagnetic waves the tool for long range sensing of the phenomena Radar Remote Sensing an effective mean that uses Electromagnetic waves characteristics for SAR Interferometry

3 Synthetic Aperture Radar (SAR) technology is an efficient tool for monitoring and investigation of dynamic phenomena on Earth.
4 OUTLINE Introduction Use of interferometric products INSAR System components Historical review SAR systems INSAR software Consumer market of applications Future Trends Electromagnetic Radiation & Interference Concepts Technique and Principles Data Investigation Information Analysis
5 Introduction Interferometric Synthetic Aperture Radar (INSAR or IFSAR) a technique for extracting topographic and thematic information SAR phase data using the wave characteristics of radar signals generating phase difference images from two or more (repeat pass) data collections Coherence maps, The images called interferogram a measure of the equality of two SAR datasets, can be generated
6 Use of interferometric products Digital Elevation Models (DEM) or Digital Terrain Models (DTM) created using the interferogram of two SAR datasets acquired at slightly different sensors positions Deformation maps created using a technique called Differential (D) calculates the difference between two interferograms belonging to three datasets acquired at different moments applied to detect positional changes on the earth surface caused by ice flows, tectonic plates shifts or volcanic movements, between the acquisitions of three or more SAR datasets Thematic maps created using coherence maps degree of coherence is related to the stability of the chemical and structural composition of the groundcover between the moments of the data acquisition different vegetation type can have different coherence.
7 System components To generate DTM s, deformation maps or thematic maps, two or more SAR datasets of the same area acquired by the same sensor systems are necessary datasets are in such a format that they still contain the phase and magnitude information of the radar signal and also the orbit, timing, calibration and other essential parameters of these data are available To produce a DTM a software package containing the below functionalities needed Data input Coregistration of the data sets Coherence map generation Interferogram generation Phase unwrapping DTM generation


8 Historical review 1969: used for the first time in observation of the surface of Venus and the Moon by Rogers and Igalis High-resolution topographic map of the Moon generated by SAR The surface of Venus, as imaged by the Magellan probe using SAR >
 Observing the")


9 Historical review (continued) Observing the surface of Venus and the Moon by Topographic map of the Moon generated by SAR The surface of Venus, imaged by SAR >
10 Historical review (continued) 1974: Graham was the first to introduce SAR for topographic mapping There are two kinds of information that are acquired for the production of topographic maps. Firstly, the various objects and features to be mapped must be present in the image with sufficient resolution to be identified. Secondly, a three-dimensional measurement of the position, with respect to the sensor platform, of a sufficient number of points must be executed to define the terrain surface. These measurements can be realized by means of with SAR data that is collected by sensors on airborne or spaceborne platforms. 1985: Zebker and Goldstein started a research at Jet Propulsion Laboratory (JPL) in Pasadena, California. They mounted two SAR antennas on an aircraft with a distance (the baseline) of 11.1 m from each other. Both antennas received the signals transmitted from one antenna simultaneously.

11 Historical review (continued) 1988: Goldstein transferred the concept of the airborne images to the SEASAT data SEASAT, USA
/ 2000/ Endeavour")
12 Historical review (continued) 1988: Gabriel and Goldstein adapted the technique to the space shuttle mission that collected the SIR-B radar data SRTM (Shuttle Radar Topography Mission)/ 2000/ Endeavour
13 Historical review (continued) 1991: European Space Agency (ESA) launched the ERS-1 satellite with its C-band SAR; 1995: ERS-2 is launched. After its launch the opportunities for spaceborne were extended using ERS-1 and ERS-2 in tandem mode (radar data acquisition only one day apart) 1995: Canadian RADARSAT satellite launched successfully and data from that system became available to extract topographic information by means of 2002: ESA s Envisat is launched 2006: Japanese ALOS is launched 2008: German TerraSAR-X is launched
14 SAR systems SAR systems installed on spaceborne and airborne platforms Airborne Imaging RADAR Systems Emisar : C, L band, University of Denmark, Denmark AeS-1: X, P band Aerosensing, Germany Pharus: C band FEL-TNO, Netherlands Star-31: X band Intermap, Canada Airsar/topsar: P, L, C band, NASA/JPL, USA Carabas: 3-15cm, Chalmas University/FOI, Sweden Geosar: X, P band, JPL and others, USA WINSAR: 4 bands, Metratec, USA
15 SAR systems (continued) SAR systems installed on spaceborne and airborne platforms Spaceborne Imaging RADAR Systems ERS-1: C band (Not operational anymore), ESA JERS-1: L band (Not operational anymore), Japan ERS-2: C band, ESA Radarsat: C band, Canada SRTM: C and X band, Space shuttle mission, NASA, USA Envisat: C band, ESA ALOS: L band, Japan TerraSAR-X, X band, Germany

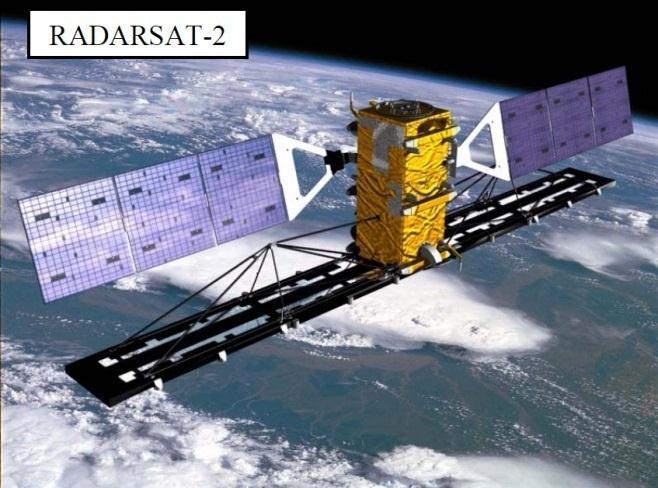
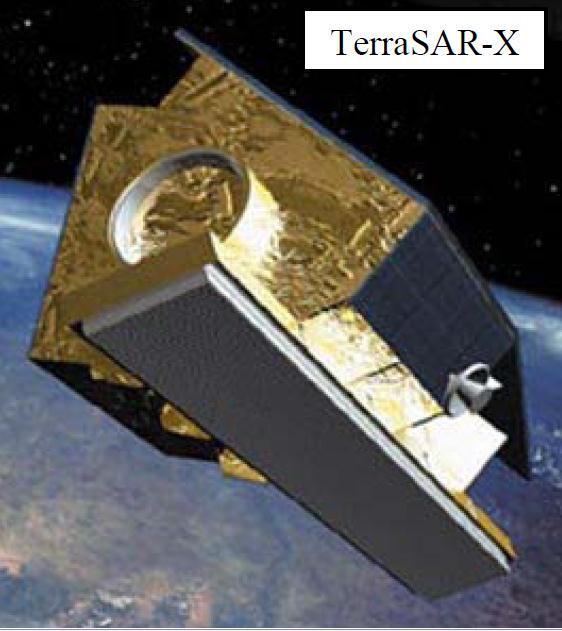
16 SAR systems (continued) Spaceborne Imaging RADAR Systems
 operates these satellites. Canadian Radarsat-1 equipped with imaging radar was launched in 1995.")
17 SAR systems (continued) The first and second European Remote Sensing (ERS) satellites are the earliest orbiting platforms which their data have been applied for SAR Interferometry. ERS-1 and ERS-2 launched in 1991 and European Space Agency (ESA) operates these satellites. Canadian Radarsat-1 equipped with imaging radar was launched in The first Japanese Earth Resource Satellite (JERS-1) was orbited two years earlier in 1992.
18 SAR systems (continued) Platforms of Spaceborne Imaging RADAR Systems
19 INSAR software There are several software packages that can process SAR data into interferometric products for many applications. The list of common software packages EPSIE 2000, Indra Espacio, Spain DIOPSON, French Space Agency (CNES)/Altamira Information, France ERDAS Imagine (ERDAS ), Leica Geosystems, USA Earth-View (EV), Atlantis Scientific Inc. of Canada/USA GAMMA, GAMMA Remote Sensing and Consulting AG, Switzerland ROI PAC, NASA's Jet Propulsion Laboratory and CalTech., USA SARscape, ENVI, Germany PulSAR and DRAIN, Phoenix Systems Ltd., UK SAR-E2, JAXA, Japan (developed for JERS SAR data examining) DORIS, Delft University of Technology, The Netherlands, (Delft Objectoriented Radar Interferometer Software) SAR Toolbox, BEST (Basic Envisat SAR Toolbox), NEST (Next ESA SAR Toolbox)
20 Consumer market of applications Spaceborne SAR interferometry holds great promise as a change-detection tool in the fields of earthquake studies, volcano monitoring, land subsidence detection, and glacier and ice-stream flow studies. other fields includes hydrology, geo-morphology, ecosystem studies The market for Airborne interferometric products is the same as for the laser altimetry.
21 The future The trend in airborne is towards multi frequency and multi polarization systems The advantages of a long-wave-band (L or P) are that they can penetrate canopy and will probably result in a ground surface height map in dense forest. The use of combinations of short-wave-bands (X or C) with long wave band will enable bio mass estimation. use of multi polarization enables the creation of optimized interferograms applying a weighted contribution of the different polarizations (HH, HV, VV). The usage of airborne SAR sensors for differential interferometry is of great interest. usage of longer wavelengths with better coherence behavior, like L-or P-band, offers the possibility of an analysis of long-term processes even in case of vegetated areas. the capabilities for monitoring of short-term processes is improved by the greater flexibility of airborne sensors. Particularly, the combination of operationally generated space-borne interferometric SAR data with flexibly acquired airborne data seems to be very promising The future in spaceborne interferometry will be mainly in the direction of Differential for several applications where change detection is important.
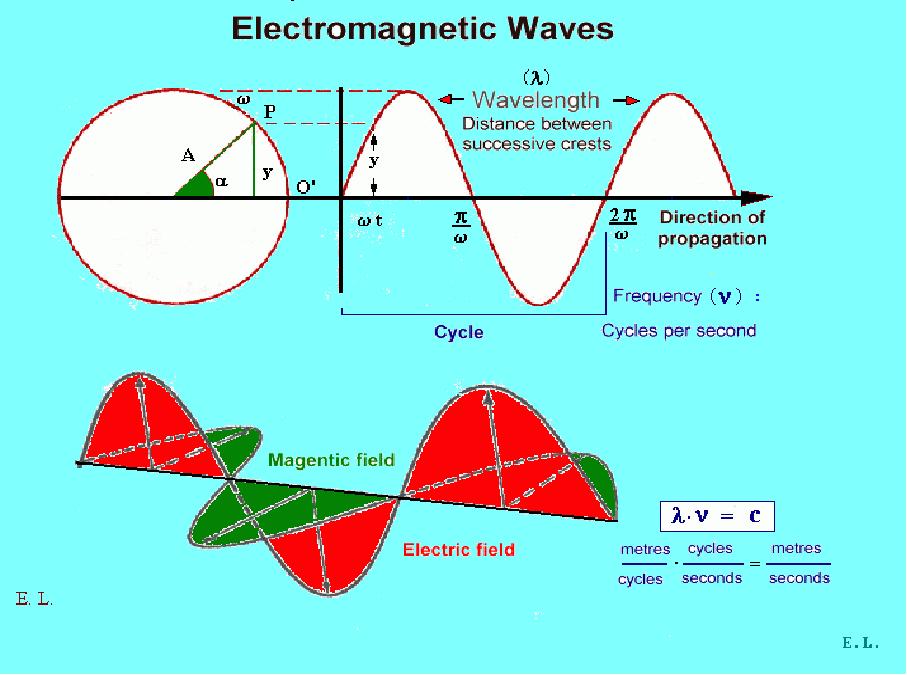
22 Electromagnetic Radiation & Interference Concepts


23 The Electromagnetic Spectrum and Energy The Photon A pack of electromagnetic energy localized in space and time Electromagnetic wave


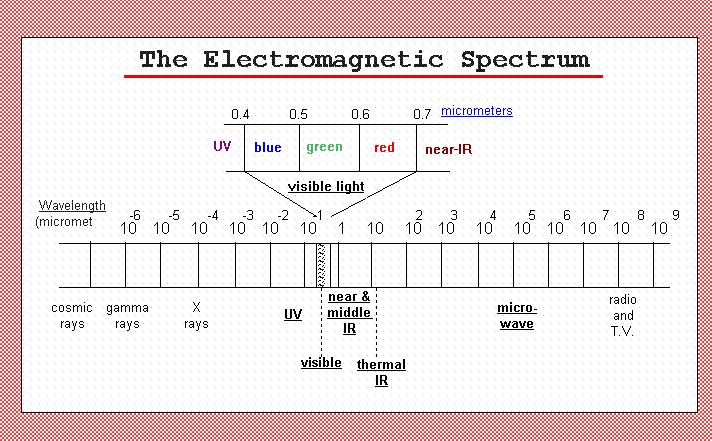
24 The Electromagnetic Spectrum and Energy Electromagnetic Spectrum: Distribution of Radiant Energies

25 The Electromagnetic Spectrum and Energy Electromagnetic Spectrum: Distribution of Radiant Energies

26 The Electromagnetic Spectrum and Energy Transmission, Absorption, Reflectance and Scattering The concept and model


27 The Electromagnetic Spectrum and Energy Transmission, Absorption, Reflectance and Scattering Electromagnetic Spectrum: Distribution of Radiant Energies
28

29 Wavelength and Frequency

30 Visible Frequency
31

32 Microwave Region of the Electromagnetic Spectrum

33 Visible Region of the Electromagnetic Spectrum
34 wave propagation
35 wave propagation principles

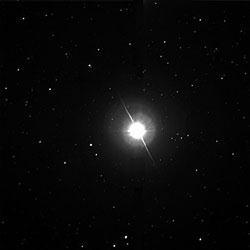
36 Albert Michelson, born in 1852, Prussia -the pioneer of interferometry -in 1882 he used his interferometer to measure the speed of light.

37 Primary Interferometers; - in 1919 Michelson developed his 100-inch telescope to measure the diameter of remote stars.

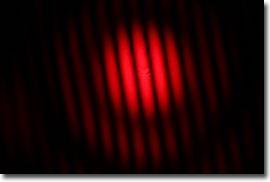
38 Generating light firings by interferometry
39 Interferometry
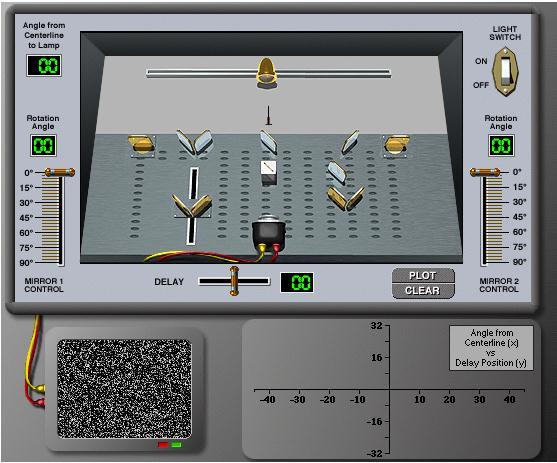
40 Virtual Interferometer
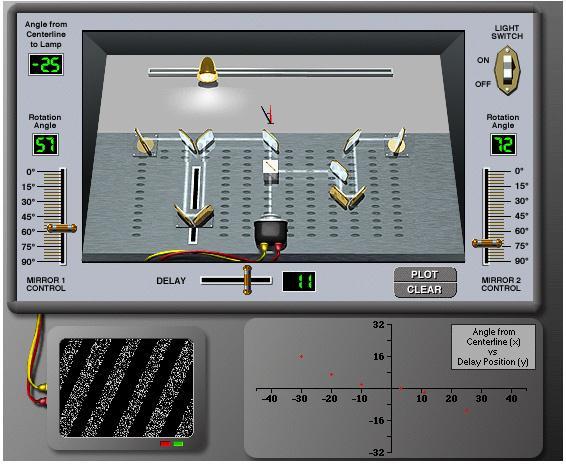
41 Virtual Interferometer

42 Virtual Interferometer The graph of a polynomial function of degree 3 y = c 0 + c 1 x + c 2 x 2 + c 3 x 3

43 What is the origin in the real world?
44 Sensor technology Data formats Raw Data SLC (Single Look Complex) Data Intensity
45 Sensor technology (continued) Raw Data The raw data contains the information about the object on the ground related to Azimuth Bandwidth and Range Bandwidth. Data is stored in two layers known as real and imaginary layers. These two layers contain information about all the objects in azimuth direction as well as in range direction.
46 Sensor technology (continued) SLC Data SAR raw data needs to be processed before getting meaningful image. Transformation from raw data to SLC is done by range compression and azimuth focusing. Signal information stored in complex numbers consisting of real and imaginary component. Using the ratio of the component, we can compute the phase and computing the length of the vector, we can derive the intensity. Azimuth resolution
47 Sensor technology (continued) Intensity An SLC image is transformed into an Intensity image by computation of the norms of the complex vectors.
48 Synthetic Aperture Radar Interferometry () Technique

49 SAR interferometry in recent years proves to be a strong method for change detection, DEM generation, classification and For interferometry, two radar images of the same area with slightly different imaging angles is required.

50 Synthetic Aperture Radar (SAR) technology is an efficient tool for monitoring and inspection of dynamic phenomena on Earth.
51 measurement of ground movement
52 Orbit baseline changes can produce varying phase shifts.


53 Polar orbiting satellites have an east looking and west looking perspective.

54 ERS 1 & 2 tracks 800 km height, ascending/descending near polar orbit, 35 days repeat period
55 Example of satellite looking up-slope and down-slope
56 is a set of successive steps to produce a height image called DTM. To generate DTM s, deformation maps or thematic maps, two or more SAR datasets of the same area acquired by the same sensor systems are needed. datasets are in such a format that they still contain the phase and magnitude information of the radar signal and also the orbit, timing, calibration and other essential parameters of these data are available To produce a DTM The following basic steps should be carried out successively Data search, selection and pre-processing Co-registration of the data sets Coherence map generation Interferogram generation Phase unwrapping DTM generation
57 DEM generation steps data processing stage comprises of five steps D data pre-processing coregistration interferogram generation phase unwrapping geo-coding


58 Data search, selection and pre-processing PORT-AU-PRINCE/ Jan 12, 2010: A huge quake measuring 7.0 hits Haiti. Baseline: m Master image dated 26 January 2010 Slave image dated 2 March 2010
59 Coregistration of the data sets By the conventional image coregistration methods

60 Coherence map generation

61 Coherence map generation The sums are over L=5 looks in frequency and N spatially adjacent pixels. Generally large values of N will give poor spatial resolution but will help to reduce the zero coherence bias and the speckle noise. A value of N= 3 3 is the compromise, which gives a zero coherence bias of approximately Values of N greater than 1 also introduce a negative bias for high phase slopes. This leads to an under-estimate of the coherence in regions of high slope. The coherence is always a non-negative real number limited between 0 (for totally different images) and 1 (for completely identical images). Due to the moving window transient, the coherence image shows a border which size is half the moving window size, consisting of null pixels.

62 Coherence map generation Coherence image of the data pairs of master image dated 26 January 2010 and slave image dated 2 March 2010 Measure for the correlation of corresponding signals Ranges from 0 to 1
63
64 Geometry
65 Interferogram generation Interferogram of the data pairs of master image dated 26 January 2010 and slave image dated 2 March 2010


66 Phase unwrapping Phase image and unwrapped phase of the data pairs of master image dated 26 January 2010 and slave image dated 2 March 2010 Phase image unwrapped phase image

67 Interferometric phase notion: a simplified example

68 DTM generation Topo-map of the data pairs of master image dated 26 January 2010 and slave image dated 2 March 2010
69 An interference model
70 ppihgf
71 Interferogram of the data pairs of master image dated 26 January 2010 and slave image dated 2 March 2010 PORT-AU-PRINCE, Haiti Baseline: m

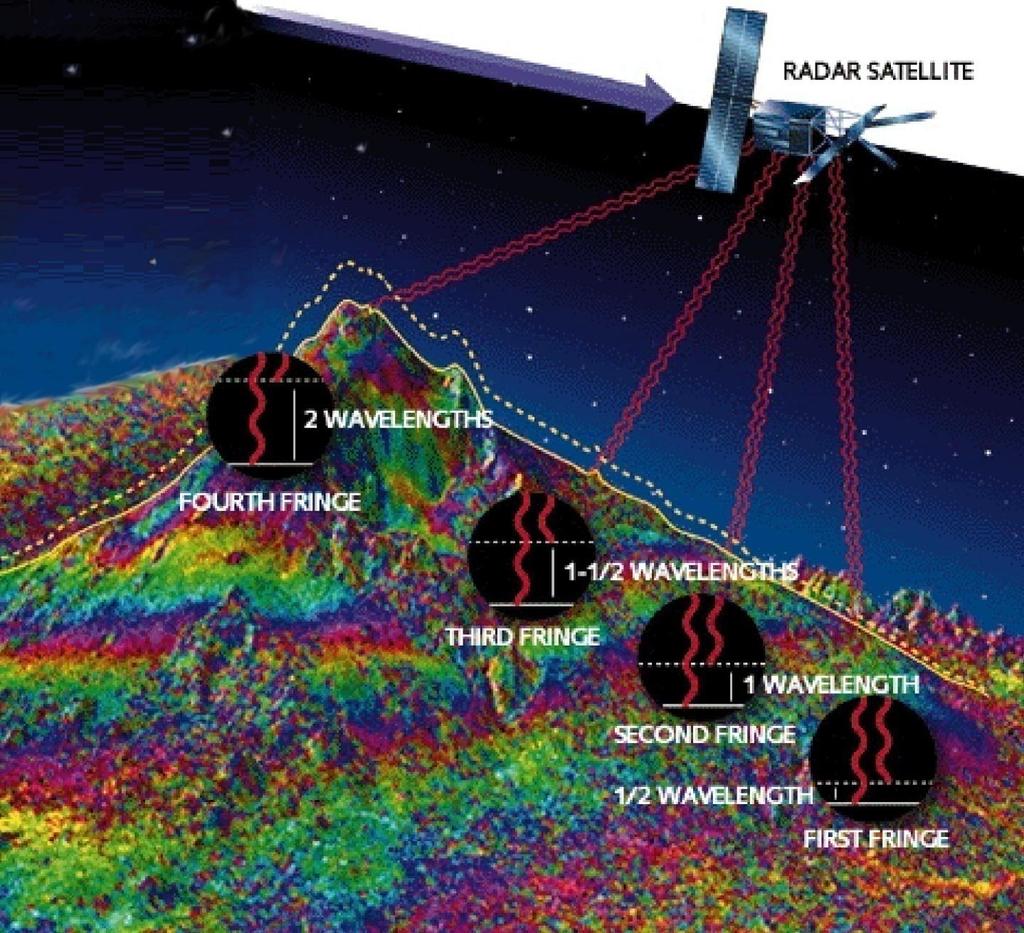
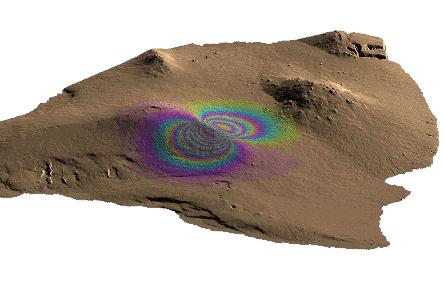
72 Interferogram: can be generated by complex computerized processes from phase data of two radar imagery of a common area of the Earth surface collected in two different times. consists of the fringes cycling from yellow to purple to turquoise and back to yellow. Representing the whole range of the phase from 0 to 2 in a full color cycle Each cycle represents a change in the ground height in the direction of platform that depends on satellite geometry.
73 Geometry of interferometry Satellite orbit is very important for successful application of SAR interferometry. In general a normal baseline larger than 400m is usually not suitable for interferometry. Also baselines smaller than 40m may not be suitable for DEM generation but this data are very good for differential interferometry.
74 Phase-range relationship
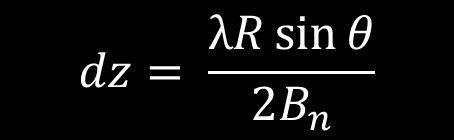
75 Phase-height relationship Topographic phase is inversely scaled by the perpendicular baseline.

76 Height ambiguity: sensitivity
77 Height ambiguity: sensitivity
78 Critical baseline for ERS1/2 and TerraSAR X

79 Very sensitive to deformation
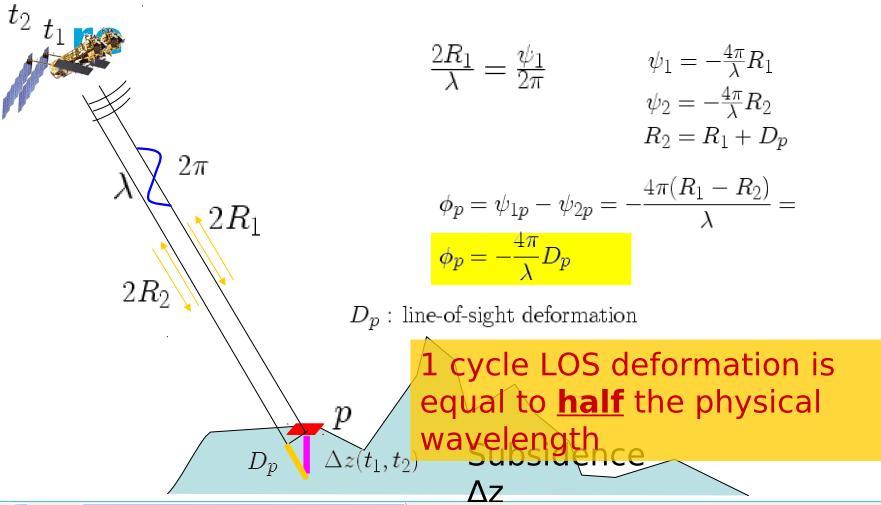
80 Phase-deformation relationship

81 Topography and deformation

82 Geometrical correlation
83 Coherence estimation

84 Change detection


85 New Technologies in monitoring and management of calamities and dynamic changes Bosporus Strait
. Middle image: 3-D perspective view of vertical displacement of south of Bam (during the 3.5 years after the 6.")
86 Bam Quake, 26 th December 2003 Left image: topo-d product of Envisat-ASAR data of 11 Jun and 3 Dec 2003 (nbsl m, pbsl m) Right image: topo-d product of the 3 Dec 2003 and 7 Jan 2004 (nbsl m, pbsl m). Middle image: 3-D perspective view of vertical displacement of south of Bam (during the 3.5 years after the 6.6 earthquake) Displacements along the radar line-of-sight direction: 30 cm and 16 cm at south-east and north-east lobes of the interferogram Displacement to the western part of the area, about 5cm along the radar line-of-sight direction
87 Thank you! KNOWLEDGE SHOULD BE SHARED, OTHERWISE IT IS USELESS. ISNET can play a key role!
SARscape Modules for ENVI
 Visual Information Solutions SARscape Modules for ENVI Read, process, analyze, and output products from SAR data. ENVI. Easy to Use Tools. Proven Functionality. Fast Results. DEM, based on TerraSAR-X-1
ACTIVE SENSORS RADAR
 ACTIVE SENSORS RADAR RADAR LiDAR: Light Detection And Ranging RADAR: RAdio Detection And Ranging SONAR: SOund Navigation And Ranging Used to image the ocean floor (produce bathymetic maps) and detect objects
Detection of a Point Target Movement with SAR Interferometry
 Journal of the Korean Society of Remote Sensing, Vol.16, No.4, 2000, pp.355~365 Detection of a Point Target Movement with SAR Interferometry Jung-Hee Jun* and Min-Ho Ka** Agency for Defence Development*,
RADAR REMOTE SENSING
 RADAR REMOTE SENSING Jan G.P.W. Clevers & Steven M. de Jong Chapter 8 of L&K 1 Wave theory for the EMS: Section 1.2 of L&K E = electrical field M = magnetic field c = speed of light : propagation direction
remote sensing? What are the remote sensing principles behind these Definition
 Introduction to remote sensing: Content (1/2) Definition: photogrammetry and remote sensing (PRS) Radiation sources: solar radiation (passive optical RS) earth emission (passive microwave or thermal infrared
RADAR INTERFEROMETRY FOR SAFE COAL MINING IN CHINA
 RADAR INTERFEROMETRY FOR SAFE COAL MINING IN CHINA L. Ge a, H.-C. Chang a, A. H. Ng b and C. Rizos a Cooperative Research Centre for Spatial Information School of Surveying & Spatial Information Systems,
Specificities of Near Nadir Ka-band Interferometric SAR Imagery
 Specificities of Near Nadir Ka-band Interferometric SAR Imagery Roger Fjørtoft, Alain Mallet, Nadine Pourthie, Jean-Marc Gaudin, Christine Lion Centre National d Etudes Spatiales (CNES), France Fifamé
SAR Imagery: Airborne or Spaceborne? Presenter: M. Lorraine Tighe PhD
 SAR Imagery: Airborne or Spaceborne? Presenter: M. Lorraine Tighe PhD Introduction The geospatial community has seen a plethora of spaceborne SAR imagery systems where there are now extensive archives
RESERVOIR MONITORING USING RADAR SATELLITES
 RESERVOIR MONITORING USING RADAR SATELLITES Alain Arnaud, Johanna Granda, Geraint Cooksley ALTAMIRA INFORMATION S.L., Calle Córcega 381-387, E-08037 Barcelona, Spain. Key words: Reservoir monitoring, InSAR,
MODULE 9 LECTURE NOTES 2 ACTIVE MICROWAVE REMOTE SENSING
 MODULE 9 LECTURE NOTES 2 ACTIVE MICROWAVE REMOTE SENSING 1. Introduction Satellite sensors are capable of actively emitting microwaves towards the earth s surface. An active microwave system transmits
SAR Remote Sensing (Microwave Remote Sensing)
") iirs SAR Remote Sensing (Microwave Remote Sensing) Synthetic Aperture Radar Shashi Kumar shashi@iirs.gov.in Electromagnetic Radiation Electromagnetic radiation consists of an electrical field(e) which
iirs SAR Remote Sensing (Microwave Remote Sensing) Synthetic Aperture Radar Shashi Kumar shashi@iirs.gov.in Electromagnetic Radiation Electromagnetic radiation consists of an electrical field(e) which
THE NASA/JPL AIRBORNE SYNTHETIC APERTURE RADAR SYSTEM. Yunling Lou, Yunjin Kim, and Jakob van Zyl
 THE NASA/JPL AIRBORNE SYNTHETIC APERTURE RADAR SYSTEM Yunling Lou, Yunjin Kim, and Jakob van Zyl Jet Propulsion Laboratory California Institute of Technology 4800 Oak Grove Drive, MS 300-243 Pasadena,
SARscape for ENVI. A Complete SAR Analysis Solution
 SARscape for ENVI A Complete SAR Analysis Solution IDL and ENVI A Foundation for SARscape IDL The Data Analysis & Visualization Platform Data Access: IDL supports virtually every data format, type and
Synthetic aperture RADAR (SAR) principles/instruments October 31, 2018
 principles/instruments October 31, 2018") GEOL 1460/2461 Ramsey Introduction to Remote Sensing Fall, 2018 Synthetic aperture RADAR (SAR) principles/instruments October 31, 2018 I. Reminder: Upcoming Dates lab #2 reports due by the start of next
GEOL 1460/2461 Ramsey Introduction to Remote Sensing Fall, 2018 Synthetic aperture RADAR (SAR) principles/instruments October 31, 2018 I. Reminder: Upcoming Dates lab #2 reports due by the start of next
Review. Guoqing Sun Department of Geography, University of Maryland ABrief
 Review Guoqing Sun Department of Geography, University of Maryland gsun@glue.umd.edu ABrief Introduction Scattering Mechanisms and Radar Image Characteristics Data Availability Example of Applications
Environmental Impact Assessment of Mining Subsidence by Using Spaceborne Radar Interferometry
 Environmental Impact Assessment of Mining Subsidence by Using Spaceborne Radar Interferometry Hsing-Chung CHANG, Linlin GE and Chris RIZOS, Australia Key words: Mining Subsidence, InSAR, DInSAR, DEM. SUMMARY
Microwave remote sensing. Rudi Gens Alaska Satellite Facility Remote Sensing Support Center
 Microwave remote sensing Alaska Satellite Facility Remote Sensing Support Center 1 Remote Sensing Fundamental The entire range of EM radiation constitute the EM Spectrum SAR sensors sense electromagnetic
ASAR Training Course, Hanoi, 25 February 7 March 2008 Introduction to Radar Interferometry
 Introduction to Radar Interferometry Presenter: F.Sarti (ESA/ESRIN) 1 Imaging Radar : reminder 2 Physics of radar Potentialities of radar All-weather observation system (active system) Penetration capabilities
MODULE 7 LECTURE NOTES 3 SHUTTLE RADAR TOPOGRAPHIC MISSION DATA
 MODULE 7 LECTURE NOTES 3 SHUTTLE RADAR TOPOGRAPHIC MISSION DATA 1. Introduction Availability of a reasonably accurate elevation information for many parts of the world was once very much limited. Dense
Synthetic Aperture Radar. Hugh Griffiths THALES/Royal Academy of Engineering Chair of RF Sensors University College London
 Synthetic Aperture Radar Hugh Griffiths THALES/Royal Academy of Engineering Chair of RF Sensors University College London CEOI Training Workshop Designing and Delivering and Instrument Concept 15 March
RADAR (RAdio Detection And Ranging)
") RADAR (RAdio Detection And Ranging) CLASSIFICATION OF NONPHOTOGRAPHIC REMOTE SENSORS PASSIVE ACTIVE DIGITAL CAMERA THERMAL (e.g. TIMS) VIDEO CAMERA MULTI- SPECTRAL SCANNERS VISIBLE & NIR MICROWAVE Real
RADAR (RAdio Detection And Ranging) CLASSIFICATION OF NONPHOTOGRAPHIC REMOTE SENSORS PASSIVE ACTIVE DIGITAL CAMERA THERMAL (e.g. TIMS) VIDEO CAMERA MULTI- SPECTRAL SCANNERS VISIBLE & NIR MICROWAVE Real
School of Rural and Surveying Engineering National Technical University of Athens
 Laboratory of Photogrammetry National Technical University of Athens Combined use of spaceborne optical and SAR data Incompatible data sources or a useful procedure? Charalabos Ioannidis, Dimitra Vassilaki
Acknowledgment. Process of Atmospheric Radiation. Atmospheric Transmittance. Microwaves used by Radar GMAT Principles of Remote Sensing
 GMAT 9600 Principles of Remote Sensing Week 4 Radar Background & Surface Interactions Acknowledgment Mike Chang Natural Resources Canada Process of Atmospheric Radiation Dr. Linlin Ge and Prof Bruce Forster
Remote Sensing. Ch. 3 Microwaves (Part 1 of 2)
") Remote Sensing Ch. 3 Microwaves (Part 1 of 2) 3.1 Introduction 3.2 Radar Basics 3.3 Viewing Geometry and Spatial Resolution 3.4 Radar Image Distortions 3.1 Introduction Microwave (1cm to 1m in wavelength)
Remote Sensing Ch. 3 Microwaves (Part 1 of 2) 3.1 Introduction 3.2 Radar Basics 3.3 Viewing Geometry and Spatial Resolution 3.4 Radar Image Distortions 3.1 Introduction Microwave (1cm to 1m in wavelength)
HIGH RESOLUTION DIFFERENTIAL INTERFEROMETRY USING TIME SERIES OF ERS AND ENVISAT SAR DATA
 HIGH RESOLUTION DIFFERENTIAL INTERFEROMETRY USING TIME SERIES OF ERS AND ENVISAT SAR DATA Javier Duro 1, Josep Closa 1, Erlinda Biescas 2, Michele Crosetto 2, Alain Arnaud 1 1 Altamira Information C/ Roger
Earth Observation and Sensing Technologies: a focus on Radar Imaging Developments. Riccardo Lanari
 Earth Observation and Sensing Technologies: a focus on Radar Imaging Developments Riccardo Lanari Institute for Electromagnetic Sensing of the Environment (IREA) National Research Council of Italy (CNR)
Microwave Remote Sensing (1)
") Microwave Remote Sensing (1) Microwave sensing encompasses both active and passive forms of remote sensing. The microwave portion of the spectrum covers the range from approximately 1cm to 1m in wavelength.
Microwave Remote Sensing (1) Microwave sensing encompasses both active and passive forms of remote sensing. The microwave portion of the spectrum covers the range from approximately 1cm to 1m in wavelength.
All rights reserved. ENVI, IDL and Jagwire are trademarks of Exelis, Inc. All other marks are the property of their respective owners.
 SAR Analysis Made Easy with SARscape 5.1 All rights reserved. ENVI, IDL and Jagwire are trademarks of Exelis, Inc. All other marks are the property of their respective owners. 2014, Exelis Visual Information
Fringe 2015 Workshop
 Fringe 2015 Workshop On the Estimation and Interpretation of Sentinel-1 TOPS InSAR Coherence Urs Wegmüller, Maurizio Santoro, Charles Werner and Oliver Cartus Gamma Remote Sensing AG - S1 IWS InSAR and
Envisat and ERS missions: data and services
 FRINGE 2005 Workshop Envisat and ERS missions: and services Henri LAUR Envisat Mission Manager Our top objective: ease access to Earth Observation Common objective for all missions handled by ESA: Envisat,
Introduction to Imaging Radar INF-GEO 4310
 Introduction to Imaging Radar INF-GEO 4310 22.9.2011 Literature Contact: yoann.paichard@ffi.no Suggested readings: Fundamentals of Radar Signal Processing, M.A. Richards, McGraw-Hill, 2005 High Resolution
Playa del Rey, California InSAR Ground Deformation Monitoring Interim Report H
 Playa del Rey, California InSAR Ground Deformation Monitoring Interim Report H Ref.: RV-14524 Doc.: CM-168-01 January 31, 2013 SUBMITTED TO: Southern California Gas Company 555 W. Fifth Street (Mail Location
Principles of Remote Sensing. Shuttle Radar Topography Mission S R T M. Michiel Damen. Dept. Earth Systems Analysis
 Principles of Remote Sensing Shuttle Radar Topography Mission S R T M Michiel Damen Dept. Earth Systems Analysis Contents Present problems with DEMs Advantage of SRTM Cell size Mission and system Radar
COMPARATIVE ANALYSIS OF INSAR DIGITAL SURFACE MODELS FOR TEST AREA BUCHAREST
 COMPARATIVE ANALYSIS OF INSAR DIGITAL SURFACE MODELS FOR TEST AREA BUCHAREST Iulia Dana (1), Valentin Poncos (2), Delia Teleaga (2) (1) Romanian Space Agency, 21-25 Mendeleev Street, 010362, Bucharest,
Persistent Scatterer InSAR
 Persistent Scatterer InSAR Andy Hooper University of Leeds Synthetic Aperture Radar: A Global Solution for Monitoring Geological Disasters, ICTP, 2 Sep 2013 Good Interferogram 2011 Tohoku earthquake Good
Radar and Satellite Remote Sensing. Chris Allen, Associate Director Technology Center for Remote Sensing of Ice Sheets The University of Kansas
 Radar and Satellite Remote Sensing Chris Allen, Associate Director Technology Center for Remote Sensing of Ice Sheets The University of Kansas 2of 43 Outline Background ice sheet characterization Radar
Introduction to radar. interferometry
 Introduction to radar Introduction to Radar Interferometry interferometry Presenter: F.Sarti (ESA/ESRIN) With kind contribution by the Radar Department of CNES All-weather observation system (active system)
Generation of Fine Resolution DEM at Test Areas in Alaska Using ERS SAR Tandem Pairs and Precise Orbital Data *
 Generation of Fine Resolution DEM at Test Areas in Alaska Using ERS SAR Tandem Pairs and Precise Orbital Data * O. Lawlor, T. Logan, R. Guritz, R. Fatland, S. Li, Z. Wang, and C. Olmsted Alaska SAR Facility
Fundamentals of Remote Sensing: SAR Interferometry
 INSIS Fundamentals of Remote Sensing: SAR Interferometry Notions fondamentales de télédétection : l interférométrie RSO Gabriel VASILE Chargé de Recherche CNRS gabriel.vasile@gipsa-lab.grenoble-inp.fr
Introduction to Radar
 National Aeronautics and Space Administration ARSET Applied Remote Sensing Training http://arset.gsfc.nasa.gov @NASAARSET Introduction to Radar Jul. 16, 2016 www.nasa.gov Objective The objective of this
Terrain Motion and Persistent Scatterer InSAR
 Terrain Motion and Persistent Scatterer InSAR Andy Hooper University of Leeds ESA Land Training Course, Gödöllő, Hungary, 4-9 th September, 2017 Good Interferogram 2011 Tohoku earthquake Good correlation
THREE-DIMENSIONAL MAPPING USING BOTH AIRBORNE AND SPACEBORNE IFSAR TECHNOLOGIES ABSTRACT INTRODUCTION
 THREE-DIMENSIONAL MAPPING USING BOTH AIRBORNE AND SPACEBORNE IFSAR TECHNOLOGIES Trina Kuuskivi Manager of Value Added Products and Services, Intermap Technologies Corp. 2 Gurdwara Rd, Suite 200, Ottawa,
Interferometric Cartwheel 1
 The Interferometric CartWheel A wheel of passive radar microsatellites for upgrading existing SAR projects D. Massonnet, P. Ultré-Guérard (DPI/EOT) E. Thouvenot (DTS/AE/INS/IR) Interferometric Cartwheel
EE 529 Remote Sensing Techniques. Introduction
 EE 529 Remote Sensing Techniques Introduction Course Contents Radar Imaging Sensors Imaging Sensors Imaging Algorithms Imaging Algorithms Course Contents (Cont( Cont d) Simulated Raw Data y r Processing
TerraSAR-X Applications Guide
 TerraSAR-X Applications Guide Extract: Change Detection and Monitoring: Geospatial / Image Intelligence April 2015 Airbus Defence and Space Geo-Intelligence Programme Line Change Detection and Monitoring:
European Space Agency and IPY
 European Space Agency and IPY ESA supports IPY 2007-2008 activities: First ESA step was a dedicated Announcement Opportunity (AO) for EO data provision in support IPY, released in 2006, with data provision
ANALYSIS OF SRTM HEIGHT MODELS
 ANALYSIS OF SRTM HEIGHT MODELS Sefercik, U. *, Jacobsen, K.** * Karaelmas University, Zonguldak, Turkey, ugsefercik@hotmail.com **Institute of Photogrammetry and GeoInformation, University of Hannover,
Active and Passive Microwave Remote Sensing
 Active and Passive Microwave Remote Sensing Passive remote sensing system record EMR that was reflected (e.g., blue, green, red, and near IR) or emitted (e.g., thermal IR) from the surface of the Earth.
IMPACT OF BAQ LEVEL ON INSAR PERFORMANCE OF RADARSAT-2 EXTENDED SWATH BEAM MODES
 IMPACT OF BAQ LEVEL ON INSAR PERFORMANCE OF RADARSAT-2 EXTENDED SWATH BEAM MODES Jayson Eppler (1), Mike Kubanski (1) (1) MDA Systems Ltd., 13800 Commerce Parkway, Richmond, British Columbia, Canada, V6V
MULTI-CHANNEL SAR EXPERIMENTS FROM THE SPACE AND FROM GROUND: POTENTIAL EVOLUTION OF PRESENT GENERATION SPACEBORNE SAR
 3 nd International Workshop on Science and Applications of SAR Polarimetry and Polarimetric Interferometry POLinSAR 2007 January 25, 2007 ESA/ESRIN Frascati, Italy MULTI-CHANNEL SAR EXPERIMENTS FROM THE
CEGEG046 / GEOG3051 Principles & Practice of Remote Sensing (PPRS) 8: RADAR 1
 8: RADAR 1") CEGEG046 / GEOG3051 Principles & Practice of Remote Sensing (PPRS) 8: RADAR 1 Dr. Mathias (Mat) Disney UCL Geography Office: 113, Pearson Building Tel: 7670 05921 Email: mdisney@ucl.geog.ac.uk www.geog.ucl.ac.uk/~mdisney
CEGEG046 / GEOG3051 Principles & Practice of Remote Sensing (PPRS) 8: RADAR 1 Dr. Mathias (Mat) Disney UCL Geography Office: 113, Pearson Building Tel: 7670 05921 Email: mdisney@ucl.geog.ac.uk www.geog.ucl.ac.uk/~mdisney
Microwave Remote Sensing
 Provide copy on a CD of the UCAR multi-media tutorial to all in class. Assign Ch-7 and Ch-9 (for two weeks) as reading material for this class. HW#4 (Due in two weeks) Problems 1,2,3 and 4 (Chapter 7)
Synthetic Aperture Radar for Rapid Flood Extent Mapping
 National Aeronautics and Space Administration ARSET Applied Remote Sensing Training http://arset.gsfc.nasa.gov @NASAARSET Synthetic Aperture Radar for Rapid Flood Extent Mapping Sang-Ho Yun ARIA Team Jet
Synthetic Aperture Radar (SAR) images features clustering using Fuzzy c- means (FCM) clustering algorithm
 images features clustering using Fuzzy c- means (FCM) clustering algorithm") Article Synthetic Aperture Radar (SAR) images features clustering using Fuzzy c- means (FCM) clustering algorithm Rashid Hussain Faculty of Engineering Science and Technology, Hamdard University, Karachi
Article Synthetic Aperture Radar (SAR) images features clustering using Fuzzy c- means (FCM) clustering algorithm Rashid Hussain Faculty of Engineering Science and Technology, Hamdard University, Karachi
Monitoring the Earth Surface from space
 Monitoring the Earth Surface from space Picture of the surface from optical Imagery, i.e. obtained by telescopes or cameras operating in visual bandwith. Shape of the surface from radar imagery Surface
Mine Subsidence Monitoring Using Multi-source Satellite SAR Images
 Mine Subsidence Monitoring Using Multi-source Satellite SAR Images Linlin Ge, Hsing-Chung Chang and Chris Rizos Cooperative Research Centre for Spatial Information & School of Surveying and Spatial Information
Comparison between SAR atmospheric phase screens at 30 by means of ERS and ENVISAT data
 Fringe 2007 - ESA-ESRIN - Frascati, November 28, 2007 Comparison between SAR atmospheric phase screens at 30 by means of ERS and ENVISAT data D. Perissin Politecnico di Milano Tele-Rilevamento Europa -
SAR Remote Sensing. Introduction into SAR. Data characteristics, challenges, and applications.
 SAR Remote Sensing Introduction into SAR. Data characteristics, challenges, and applications. PD Dr. habil. Christian Thiel, Friedrich-Schiller-University Jena DLR-HR Jena & Friedrich-Schiller-University
Dynamics and Control Issues for Future Multistatic Spaceborne Radars
 Dynamics and Control Issues for Future Multistatic Spaceborne Radars Dr Stephen Hobbs Space Research Centre, School of Engineering, Cranfield University, UK Abstract Concepts for future spaceborne radar
RADAR ANALYST WORKSTATION MODERN, USER-FRIENDLY RADAR TECHNOLOGY IN ERDAS IMAGINE
 RADAR ANALYST WORKSTATION MODERN, USER-FRIENDLY RADAR TECHNOLOGY IN ERDAS IMAGINE White Paper December 17, 2014 Contents Introduction... 3 IMAGINE Radar Mapping Suite... 3 The Radar Analyst Workstation...
The Shuttle Radar Topography Mission: A Global DEM
 The Shuttle Radar Topography Mission: A Global DEM Tom G. Farr, Mike Kobrick Jet Propulsion Laboratory California Institute of Technology Pasadena, CAUSA Digital topographic data are critical for a variety
PALSAR SCANSAR SCANSAR Interferometry
 PALSAR SCANSAR SCANSAR Interferometry Masanobu Shimada Japan Aerospace Exploration Agency Earth Observation Research Center ALOS PI symposium, Greece Nov. 6 2008 1 Introduction L-band PALSAR strip mode
URBAN MONITORING USING PERSISTENT SCATTERER INSAR AND PHOTOGRAMMETRY
 URBAN MONITORING USING PERSISTENT SCATTERER INSAR AND PHOTOGRAMMETRY Junghum Yu *, Alex Hay-Man Ng, Sungheuk Jung, Linlin Ge, and Chris Rizos. School of Surveying and Spatial Information Systems, University
Active and Passive Microwave Remote Sensing
 Active and Passive Microwave Remote Sensing Passive remote sensing system record EMR that was reflected (e.g., blue, green, red, and near IR) or emitted (e.g., thermal IR) from the surface of the Earth.
21-Sep-11. Outline. InSAR monitoring of CO2 sequestration - Complications. Enhanced solution (novel spatiotemporal atmospheric filtering)
") Pushing the accuracy limit for CO2 sequestration monitoring: Statistically optimal spatio-temporal removal of the atmospheric component from InSAR Networks Bernhard Rabus Jayson Eppler MacDonald Dettwiler
Pushing the accuracy limit for CO2 sequestration monitoring: Statistically optimal spatio-temporal removal of the atmospheric component from InSAR Networks Bernhard Rabus Jayson Eppler MacDonald Dettwiler
Radar Imaging Wavelengths
 A Basic Introduction to Radar Remote Sensing ~~~~~~~~~~ Rev. Ronald J. Wasowski, C.S.C. Associate Professor of Environmental Science University of Portland Portland, Oregon 3 November 2015 Radar Imaging
ESA Radar Remote Sensing Course ESA Radar Remote Sensing Course Radar, SAR, InSAR; a first introduction
 Radar, SAR, InSAR; a first introduction Ramon Hanssen Delft University of Technology The Netherlands r.f.hanssen@tudelft.nl Charles University in Prague Contents Radar background and fundamentals Imaging
Introduction Active microwave Radar
 RADAR Imaging Introduction 2 Introduction Active microwave Radar Passive remote sensing systems record electromagnetic energy that was reflected or emitted from the surface of the Earth. There are also
Accuracy assessment of a digital height model derived from airborne synthetic aperture radar measurements
 Kleusberg, Klaedtke 139 Accuracy assessment of a digital height model derived from airborne synthetic aperture radar measurements ALFRED KLEUS BERG and HANS-GEORG KLAEDTKE, S tuttgart ABSTRACT A digital
Govt. Engineering College Jhalawar Model Question Paper Subject- Remote Sensing & GIS
 Govt. Engineering College Jhalawar Model Question Paper Subject- Remote Sensing & GIS Time: Max. Marks: Q1. What is remote Sensing? Explain the basic components of a Remote Sensing system. Q2. What is
How accurately can current and futureinsar missions map tectonic strain?
 How accurately can current and futureinsar missions map tectonic strain? Outline: How accurately do we need to measure strain? InSAR missions Error budget for InSAR Ability of current, planned and proposed
Figure 1: C band and L band (SIR-C/X-SAR images of Flevoland in Holland). color scheme: HH: red, HV:green, VV: blue
. color scheme: HH: red, HV:green, VV: blue") L-band PS analysis: JERS-1 results and TerraSAR L predictions Kenji Daito (1), Alessandro Ferretti (), Shigeki Kuzuoka (3),Fabrizio Novali (), Pietro Panzeri (), Fabio Rocca (4) (1) Daido Institute of
L-band PS analysis: JERS-1 results and TerraSAR L predictions Kenji Daito (1), Alessandro Ferretti (), Shigeki Kuzuoka (3),Fabrizio Novali (), Pietro Panzeri (), Fabio Rocca (4) (1) Daido Institute of
SAR Multi-Temporal Applications
 SAR Multi-Temporal Applications 83230359-DOC-TAS-EN-001 Contents 2 Advantages of SAR Remote Sensing Technology All weather any time Frequencies and polarisations Interferometry and 3D mapping Change Detection
High resolution ground deformations monitoring by COSMO-SkyMed PSP SAR interferometry
 High resolution ground deformations monitoring by COSMO-SkyMed PSP SAR interferometry Mario Costantini e-geos - an ASI/Telespazio Company, Rome, Italy mario.costantini@e-geos.it Summary COSMO-SkyMed satellite
Remote Sensing: John Wilkin IMCS Building Room 211C ext 251. Active microwave systems (1) Satellite Altimetry
 Satellite Altimetry") Remote Sensing: John Wilkin wilkin@marine.rutgers.edu IMCS Building Room 211C 732-932-6555 ext 251 Active microwave systems (1) Satellite Altimetry Active microwave instruments Scatterometer (scattering
Remote Sensing: John Wilkin wilkin@marine.rutgers.edu IMCS Building Room 211C 732-932-6555 ext 251 Active microwave systems (1) Satellite Altimetry Active microwave instruments Scatterometer (scattering
Integration of InSAR and GPS for precise deformation mapping
 Integration of InSAR and GPS for precise deformation mapping Zhenhong Li (COMET, University of Glasgow, UK) Eric J. Fielding (Jet Propulsion Laboratory, Caltech, USA) 30 November 2009 Contents Two major
Damage detection in the 2015 Nepal earthquake using ALOS-2 satellite SAR imagery
 Proceedings of the Tenth Pacific Conference on Earthquake Engineering Building an Earthquake-Resilient Pacific 6-8 November 2015, Sydney, Australia Damage detection in the 2015 Nepal earthquake using ALOS-2
SATELLITE OCEANOGRAPHY
 SATELLITE OCEANOGRAPHY An Introduction for Oceanographers and Remote-sensing Scientists I. S. Robinson Lecturer in Physical Oceanography Department of Oceanography University of Southampton JOHN WILEY
TerraSAR-X Applications Guide
 TerraSAR-X Applications Guide Extract: Maritime Monitoring: Ship Detection April 2015 Airbus Defence and Space Geo-Intelligence Programme Line Maritime Monitoring: Ship Detection Issue Maritime security
Active microwave systems (1) Satellite Altimetry
 Satellite Altimetry") Remote Sensing: John Wilkin Active microwave systems (1) Satellite Altimetry jwilkin@rutgers.edu IMCS Building Room 214C 732-932-6555 ext 251 Active microwave instruments Scatterometer (scattering from
Remote Sensing: John Wilkin Active microwave systems (1) Satellite Altimetry jwilkin@rutgers.edu IMCS Building Room 214C 732-932-6555 ext 251 Active microwave instruments Scatterometer (scattering from
ASSESSMENT OF SRTM, ACE2 AND ASTER-GDEM USING RTK-GPS
 ASSESSMENT OF SRTM, ACE2 AND ASTER-GDEM USING RTK-GPS Hsing-Chung Chang, Xiaojing Li, Linlin Ge School of Surveying and Spatial Information Systems The University of New South Wales, Sydney, NSW 2052,
Sentinel-1 System Overview
 Sentinel-1 System Overview Dirk Geudtner, Rámon Torres, Paul Snoeij, Malcolm Davidson European Space Agency, ESTEC Global Monitoring for Environment and Security (GMES) EU-led program aiming at providing
ASAR WIDE-SWATH SINGLE-LOOK COMPLEX PRODUCTS: PROCESSING AND EXPLOITATION POTENTIAL
 ASAR WIDE-SWATH SINGLE-LOOK COMPLEX PRODUCTS: PROCESSING AND EXPLOITATION POTENTIAL Ralph Cordey (1), Tim Pearson (2), Yves-Louis Desnos (3), Betlem Rosich-Tell (3) (1) European Space Agency, ESTEC, Keplerlaan
Multiscale Monitoring and Health Assessment for Effective Management of Flood-Control Infrastructure Systems
 Multiscale Monitoring and Health Assessment for Effective Management of Flood-Control Infrastructure Systems Tarek Abdoun Rensselaer Polytechnic Institute Levees Everywhere 3 Vision SAR Satellite 4 SAR
Remote sensing radio applications/ systems for environmental monitoring
 Remote sensing radio applications/ systems for environmental monitoring Alexandre VASSILIEV ITU Radiocommunication Bureau phone: +41 22 7305924 e-mail: alexandre.vassiliev@itu.int 1 Source: European Space
LE/ESSE Payload Design
 LE/ESSE4360 - Payload Design 3.2 Spacecraft Sensors Introduction to Sensors Earth, Moon, Mars, and Beyond Dr. Jinjun Shan, Professor of Space Engineering Department of Earth and Space Science and Engineering
Francesco Holecz. TUBE II meeting - 17 June Land Degradation. Land Degradation
 Land Degradation Francesco Holecz Objective To identify and monitor land degraded areas, in particular those related to agricultural and pastoral activities. Following products are generated: Land cover
7.7 TerraSAR-X & TanDEM-X
 7.7 TerraSAR-X & TanDEM-X Two Innovative Remote Sensing Stars for space-borne Earth Observation Vorlesung Wolfgang Keydel Microwaves and Radar Institute, German Aerospace Research Center (DLR), D-82230
Synthetic Aperture Radar
 Synthetic Aperture Radar Picture 1: Radar silhouette of a ship, produced with the ISAR-Processor of the Ocean Master A Synthetic Aperture Radar (SAR), or SAR, is a coherent mostly airborne or spaceborne
Development of a Ground-based Synthetic Aperture Radar System for Highly Repeatable Measurements
 Development of a Ground-based Synthetic Aperture Radar System for Highly Repeatable Measurements Hoonyol LEE, Seong-Jun CHO, Nak-Hoon SUNG and Jung-Ho KIM Department of Geophysics, Kangwon National University
10 Radar Imaging Radar Imaging
 10 Radar Imaging Active sensors provide their own source of energy to illuminate the target. Active sensors are generally divided into two distinct categories: imaging and non-imaging. The most common
SARscape 4.1 Supported Sensors/Products (October 2008)
") SARscape 4.1 Supported Sensors/Products (October 2008) ALOS PALSAR (provided by JAXA) In case of RAW (level 1.0) data, import is carried out within the Focusing Module. PALSAR RAW data in CEOS standard
SARscape 4.1 Supported Sensors/Products (October 2008) ALOS PALSAR (provided by JAXA) In case of RAW (level 1.0) data, import is carried out within the Focusing Module. PALSAR RAW data in CEOS standard
NEXTMAP. P-Band. Airborne Radar Imaging Technology. Key Benefits & Features INTERMAP.COM. Answers Now
 INTERMAP.COM Answers Now NEXTMAP P-Band Airborne Radar Imaging Technology Intermap is proud to announce the latest advancement of their Synthetic Aperture Radar (SAR) imaging technology. Leveraging over
ENVISAT ASAR DATA PROCESSING
 ASAR data processing with GAMMA Software, Version of 20-Jun-2003 GAMMA SOFTWARE VALIDATION REPORT: ENVISAT ASAR DATA PROCESSING Urs Wegmüller, Tazio Strozzi, Charles Werner and Andreas Wiesmann Gamma Remote
Digital Terrain Models from Radar Interferometry
 Bamler 93 Digital Terrain Models from Radar Interferometry RICHARD BAMLER, Wessling ABSTRACT Interferometric synthetic aperture radar (InSAR) is a rapidly evolving technology for DTM generation. It exploits
Client: Statens vegvesen, Region midt County: Sør Trondelag
 Geological Survey of Norway N-7441 Trondheim, Norway REPORT Report no.: 2004.043 ISSN 0800-3416 Grading: Open Title: Preliminary analysis of InSAR data over Trondheim with respect to future road development
Configuration, Capabilities, Limitations, and Examples
 FUGRO EARTHDATA, Inc. Introduction to the New GeoSAR Interferometric Radar Sensor Bill Sharp GeoSAR Regional Director - Americas Becky Morton Regional Manager Configuration, Capabilities, Limitations,
Outline. Introduction. Introduction: Film Emulsions. Sensor Systems. Types of Remote Sensing. A/Prof Linlin Ge. Photographic systems (cf(
 GMAT x600 Remote Sensing / Earth Observation Types of Sensor Systems (1) Outline Image Sensor Systems (i) Line Scanning Sensor Systems (passive) (ii) Array Sensor Systems (passive) (iii) Antenna Radar
MULTIPLE APERTURE INSAR (MAI) WITH C-BAND AND L-BAND DATA: NOISE AND PRECISION
 WITH C-BAND AND L-BAND DATA: NOISE AND PRECISION") MULTIPLE APERTURE INSAR (MAI) WITH C-BAND AND L-BAND DATA: NOISE AND PRECISION Noa Bechor Ben-Dov and Thomas A. Herring Massachusetts Institute of Technology, Cambridge, MA 2139, USA, Email: nbechor@chandler.mit.edu
MULTIPLE APERTURE INSAR (MAI) WITH C-BAND AND L-BAND DATA: NOISE AND PRECISION Noa Bechor Ben-Dov and Thomas A. Herring Massachusetts Institute of Technology, Cambridge, MA 2139, USA, Email: nbechor@chandler.mit.edu
TanDEM-X: Mission Status & Scientific Contribution
 TanDEM-X: Mission Status & Scientific Contribution Irena Hajnsek 1/2, Gerhard Krieger 1, Kostas Papathanassiou 1, Stefan Baumgartner 1, Marc Rodriguez-Cassola 1, Pau Prats 1, Maria Sanjuan Ferrer 1, Florian