WATCHING OVER OUR PLANET FROM SPACE
|
|
|
- Denis Cobb
- 6 years ago
- Views:
Transcription
1 3.10 Land Use Mapping City planners need to know which areas of a city are used for which purpose. Therefore, they produce a map of land use, that identifies parts of a city and the major activities (land use) that happen there. Remote sensing imagery is very useful for this purpose, since you certainly don t want to spend many weeks or months walking or driving around a city to map its land use. But to use remote sensing imagery effectively, you have to be able to interpret it accurately. The satellite image in this activity shows a part of downtown Montreal. It will be a bit harder to interpret this black and white image, because you don t have colour clues to rely on. But you can see quite a bit of spatial detail even individual streets and large buildings. Task There are five categories to map: water, industrial, central business district, parks & recreation, and residential & commercial. Choose a different colour for each of these categories and colour in the boxes in the index of the blank map. Then for each area outlined on the map, interpret the corresponding area on the image. Use the interpretation key below for clues. Once you figure out the land use for a particular area, colour in the map to match it. Land Use Category What does it mean? Look for this in the image water rivers, lakes smooth, dark areas with docks and bridges industrial central business district parks and recreation residential and commercial large factories, railway yards, docks, storage yards tall office buildings, hotels parks, golf courses, race tracks, amusement parks, sports arenas houses, apartment buildings, stores, shopping centres rail yards; large (wide) buildings; empty lots; bare ground; lack of rectangular street pattern closely packed, tall buildings casting large shadows large grassed areas; winding paths; ponds; oval tracks; large, irregular buildings rectangular street pattern, closely spaced houses and some larger buildings Activity 3.10 Land Use Mapping page 1

2 Satellite Image Downtown Montreal Activity 3.10 Land Use Mapping page 2
3 Land Use Map Downtown Montreal Activity 3.10 Land Use Mapping page 3

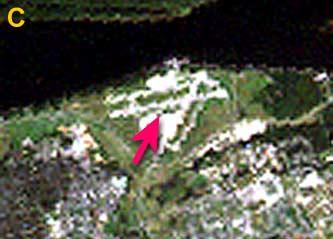
4 There seems to be a lot of activity going on in this remote sensing image of a copper mine. We are using a sensor on an airplane here, so we have very fine detail of features. Also, the spectral band combinations are chosen to show healthy, dense vegetation as bright red. Less healthy and thinner vegetation will show less red and more brown colouring. Artificial materials like pavement and buildings will appear in different shades of pale blue. Of course you can t see what is going on underground, but let s take a tour of what happens above ground: Ore is taken from the ground and processed at a mill (A). This involves grinding it up and adding water. The parts of the mixture that are useful are called concentrates and passed to the smelter B for further processing, while the unwanted parts are called tailings and need to be disposed of. At the smelter, the concentrates go through several processes, including melting at very high temperatures, to isolate the metals that are the desired end products. The remaining materials are called slag and also need to be disposed of At a Mine Site The copper that is produced here, becomes the water pipes and electrical wires in our houses, as well as many other useful products. The unwanted parts of the processes, are allowed to settle and mix with air and water in settling ponds. It takes special effort to overcome the environmental effect that the slag and tailings have on the soil, air, water and vegetation. Land to be reclaimed Potential settling pond Vegetation affected by the pond water content and level Question #1: We can see in the satellite image, several stages of the environmental recovery that the mine has implemented. At C, a pipe is dumping the raw tailings (yellow colour) into a settling pond. What is another location where tailings are entering a settling pond (2.3, 2.6) or (4.7, 1.8) or (4.5, 2.7)? Red colour in water due to minerals in the tailings Tailings entering the settling pond Activity 3.11 At a Mine Site page 1
 or (0.5, 3.0)")
 or (6.5, 6.7) or (5.6, 1.")

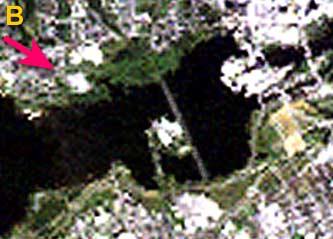
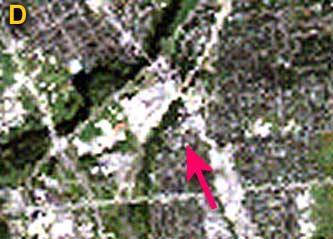
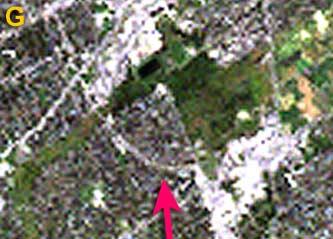
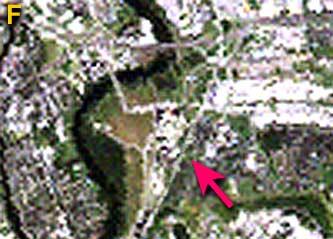
5 Question #2: The settling pond in the satellite image at D is almost completely filled in with tailings. Where can you find another almost-filled pond (0.5, 5.2) or (0.5, 3.0) or (2.0, 6.0)? Question #3: Lime is added to the tailings to reduce its acidity. You can see in the satellite image, a big pile of lime stored at F. Where is another lime pile (2.2, 7.5) or (6.5, 6.7) or (5.6, 1.0)? Settling pond being filled with tailings Lime pile at the mine site Question #4: At G in the satellite image, seeds have been planted and grass has started to grow on the tailings. A few young trees are also growing here. Where is another area like this (4.6, 3.2) or (0.4, 7.2) or (0.7, 3.4)? Grass and young trees growing on the tailings Activity 3.11 At a Mine Site page 2

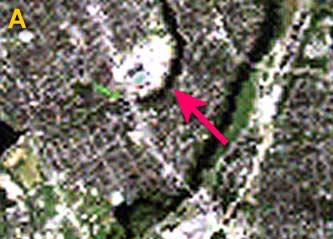
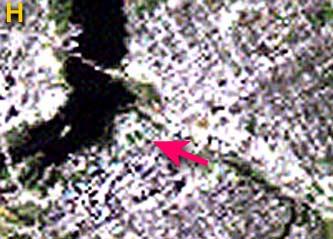
6 Question #5: Fully mature trees, growing on old tailings can be seen on the satellite image at H. Where is another similar area (6.5, 1.0) or (2.2, 0.9) or (3.7, 3.7)? Question #6: Mature trees growing on land reclaimed from a tailings pile On the satellite image there is a housing development for mine workers, at I. Where is another such neighbourhood (0.2, 4.6) or (2.0, 2.0) or (6.5, 8.1)? Question #7: A cluster of large storage tanks can be seen on the satellite image at J. Where is a second group of storage tanks located (6.9, 7.1) or (3.7, 7.6) or (4.1, 8.8)? Activity 3.11 At a Mine Site page 3

7 Remote Sensing Image of a Mine Activity 3.11 At a Mine Site (satellite image) page 4
8 3.12 A Different Perspective Looking at things from directly above is very different from the normal way that we see things. But when we use satellite imagery, we have to get used to how things look from space. Try the following activity to see this difference. There are two sets of pictures of places in the city of Ottawa and vicinity. One set was taken from an airplane, looking at things from an angle (obliquely, that is) which is a more familiar way to see things. The other set was taken from satellite, looking at things from directly above which we are not used to. Task Can you match each aerial photograph to its corresponding satellite image? To help you, we ve shown on each satellite image, from where and in which direction the matching air photo was taken. Aerial Photograph Satellite Image Activity 3.12 A Different Perspective page 1
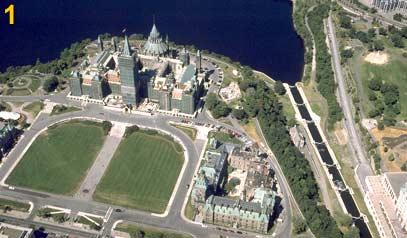
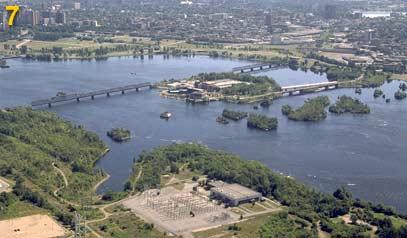
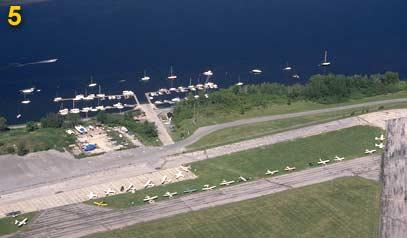
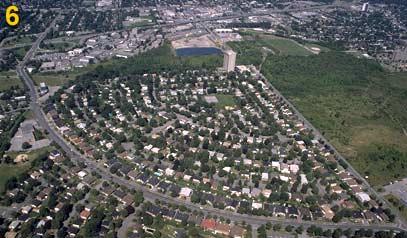
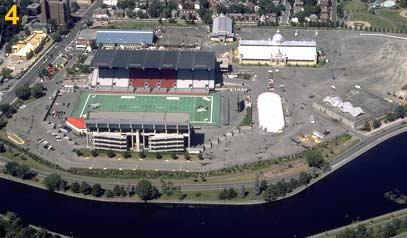
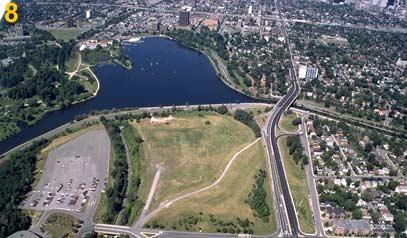
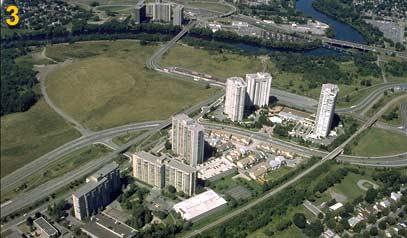
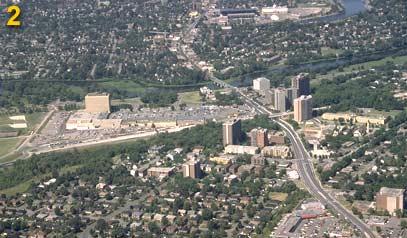
9 Aerial Photographs taken over Ottawa Activity 3.12 A Different Perspective page 2

10 Satellite Images of Ottawa Activity 3.12 A Different Perspective page 3


11 102/04/001:19 WATCHING OVER OUR PLANET FROM SPACE 4.1 Why does Remote Sensing work so well? Without Remote Sensing Covering a large area on foot, by car, by boat or even by airplane is very expensive and can take a long time. By the time a large area is covered using these methods, things at the beginning of the survey could have changed. With Remote Sensing A satellite scans a very large area within seconds. Forest fires, North West Territories Without Remote Sensing A survey of a large area of forest, agricultural land, cities or oceans could require paying a team of people and perhaps renting boats or airplanes, potentially making it very expensive for just one project. With Remote Sensing The cost of building, launching, and operating a satellite is shared by the many thousands of people who buy images for their own projects. Section Why Does Remote Sensing Work So Well? 11 page 1

 or when looking at the slow change of crops, forests or city growth, remote sensing images can t be beaten.")

12 202/04/001:19 WATCHING OVER OUR PLANET FROM SPACE Without Remote Sensing It is sometimes hard to see small changes and it is very difficult to count and record many small changes, especially if they occur over a large area. In order to make good decisions about how to help our environment, we need to know accurately, what is happening where and when. With Remote Sensing A satellite can acquire repeated views of the same area and computers can accurately show what has changed between acquisitions. When dealing with fast-changing disasters (forest fires, floods) or when looking at the slow change of crops, forests or city growth, remote sensing images can t be beaten. Without Remote Sensing There is always a lot of guesswork. Resource managers go to a site to take samples or make a count in only a small portion of the area to be studied. Using this information, predictions are made for the entire area. The same survey done twice could produce very different results. With Remote Sensing Remote sensing tells us exactly what is there, how many and where. It doesn t rely on a person s memory or experience. It gives us reliable and repeatable information with measurable accuracy. Without Remote Sensing If information is described in writing or even in a drawing, it can be used only in a limited way. It is very difficult to make comparisons to other similar descriptions and it is even more difficult to analyze. It may not be possible to make good decisions based on this type of information. With Remote Sensing Remote sensing information is mostly digital and therefore can be analyzed by computer, compared, and statistics can be collected from it. Decisions can be made more accurately from this type of data. Section Why Does Remote Sensing Work So Well? 22 page 2

 Is there a difference between a Landsat satellite and a RADARSAT satellite? Yes.")
13 302/04/001:19 WATCHING OVER OUR PLANET FROM SPACE 4.2 Frequently Asked Questions a) Is remote sensing always done using satellites? No. Remote sensing is simply sensing things from a distance. You do remote sensing whenever you look, hear or smell. Remote sensing can be done for business and scientific research using helicopters, airplanes, rockets, or balloons. Even kites have been tried, but satellites are definitely the most popular platform for carrying remote sensing equipment. Active Passive b) Is there a difference between a Landsat satellite and a RADARSAT satellite? Yes. Landsat carries a Thematic Mapper scanner that uses the visible and infrared parts of the electromagnetic spectrum to make images. As humans, we can only see the visible light part of the spectrum (the colours of red, orange, yellow, green, blue and violet), but we can t see the infrared parts as Landsat can. RADARSAT, however, carries a radar instrument that uses the radar or microwave part of the spectrum to make images. We can t see that part of the spectrum either. These are the same microwaves that are used in many other ways such as in microwave ovens. c) What is the difference between an ACTIVE and a PASSIVE sensor? A camera provides an excellent example of both passive and active sensors. It is the film of the camera that is the sensor. It records the light that is reflected from the object that is being photographed. If the illumination for the scene is coming not from the camera but from another source (say, the sun) then the camera is a PASSIVE sensor. On a cloudy day or inside a room or at night, there may not be enough light. When the camera also has to provide the illumination for the scene (using a flash) it becomes an ACTIVE sensor Section 4.2 Frequently Asked Questions 33 page 3
 and some of the energy is reflected back to the antenna. This is called backscatter.")
14 402/04/001:19 WATCHING OVER OUR PLANET FROM SPACE d) How does radar work? A short pulse of energy is sent out by the radar antenna at an angle, towards the ground. The pulse bounces off targets on the ground (houses, trees, grass, telephone poles, etc.) and some of the energy is reflected back to the antenna. This is called backscatter. The more energy a target backscatters, the brighter it will be shown on the radar image. e) Is there one remote sensing satellite that is the best? There is no best. The best choice of satellite data depends upon the application. Some satellites (and the sensors they carry) are designed for looking at fine detail so that small targets can be imaged. Other satellites specialize in covering very large areas all at once, or perhaps in revisiting the same area often. Radar-carrying satellites are chosen for use at night, for penetrating clouds or for mapping special targets like ice. Other satellites carry sensors that are particularly good at imaging in colour, to help in the spectral identification of targets. f) How high up are these satellites? The earth observation satellites such as Landsat and RADARSAT are about 900 km above the Earth. This is much higher than the international space station (about 200 km) but not as high as the communication satellites (in geostationary orbit) that are used for TV and telephone (about 32,000 km). g) How many remote sensing satellites are there? Lots. RADARSAT is Canadian. Other satellites belong to different countries such as U.S., Europe, Japan, France and India. Private companies are now launching remote sensing satellites too, because they have realized that this technology is very useful and profitable. h) How do the remote sensing satellites cover the Earth? The Earth Observation satellites move in a near polar orbit. As the Earth spins west to east beneath them, they orbit from the North Pole down to the South Pole, back up to the North Pole, etc., each time passing close to, but not exactly over the poles. These two motions Section 4.2 Frequently Asked Questions 44 page 4
 How long does it take for a satellite to cover the Earth? One Landsat satellite, which looks straight down, takes 16 days to cover the whole of the Earth s surface.")
15 502/04/001:19 WATCHING OVER OUR PLANET FROM SPACE (the satellite orbit and the rotation of the Earth) make it possible for them to see almost the entire surface of the Earth. i) How long does it take for a satellite to cover the Earth? One Landsat satellite, which looks straight down, takes 16 days to cover the whole of the Earth s surface. The NOAA satellite, which also looks straight down but covers a much wider area takes much less time. The RADARSAT and SPOT sensors, on the other hand, can be steered to point at a sideways angle at a target area from several neighbouring orbits. In this way, in a limited fashion, it is possible to get daily views of an area for several days. j) How is the satellite data sent from way up there, down to us? There are two receiving stations in Canada. One is in Gatineau, Quebec, the other in Prince Albert, Saskatchewan. Together these two receiving stations can pick up all the data transmitted by satellites passing over any part of Canada. Other ground stations have been set up around the world to similarly capture data from a variety of satellites when they are overhead. Most of the time the satellites re-transmit the data that they receive directly to the ground station below them, using radio waves. At other times when the satellite is not within line-of-sight of a receiving station, it will store the data on board temporarily, and then transmit to the ground station when it passes overhead. k) How long does it take the data to reach Earth? The data is transmitted instantaneously (well.... to be accurate, it s transmitted at the speed of light). l) Why are some satellite images in black and white and others in colour? Some sensors record images from just one part of the electromagnetic spectrum, showing the image in shades (usually 256) of grey making what s called a black and white image. This is how RADARSAT works. When an image is recorded simultaneously in several parts of the spectrum, then three of those spectral bands are shown as shades Section 4.2 Frequently Asked Questions 55 page 5

16 602/04/001:19 WATCHING OVER OUR PLANET FROM SPACE of red and green and blue. Landsat and SPOT images are often displayed this way. From those three primary additive colours, one can make any of the other colours such as orange, brown, turquoise, etc. That is also how your TV and your computer monitor work when the three images in red, green and blue are superimposed on the screen, a full range of colour results. m) Why do we get such strange colours in many of these satellite images? Remote sensing uses parts of the spectrum that people can't see by eye: infrared, ultraviolet, radar, etc. If we want to display (on a photo or a computer monitor) one or more of these bands, we must use one or more of the three primary colours that people can see: red, green and blue. Therefore, you could get some strange combinations, like: infrared information shown as blue, red information shown as green and green information shown as blue!! The resulting colours will be nothing like what we experience using just our eyes. n) Can sensors see underground or underwater? Under very special circumstances (using long wave radar over an area that is extremely dry) it is possible to see a few metres into the ground. In Canada, where usually the ground has lots of moisture, we are limited to seeing what s on the surface only. Some of the visible wavelengths, like blue for instance, penetrate water quite well and if the water is clear, we can see down several metres. o) What is a "spectral fingerprint"? It s a way to try to identify objects in a satellite image. By using many parts of the spectrum, including the visible colours and perhaps parts of the infrared band, we try to find how an object reflects light. The way that an object reflects different parts of the spectrum is its "spectral fingerprint". There are different spectral fingerprints for different kinds of trees, crops, soil, etc Section 4.2 Frequently Asked Questions 66 page 6
 ANALOGUE: This is the opposite of DIGITAL. It refers to things that aren t made up of numbers. A photo taken with a film camera would be an analogue picture.")
17 702/04/001:19 WATCHING OVER OUR PLANET FROM SPACE 4.3 Glossary of Remote Sensing Terms AIRBORNE SENSING: Remote sensing from an airplane. (Related words: airphoto, aerial) ANALOGUE: This is the opposite of DIGITAL. It refers to things that aren t made up of numbers. A photo taken with a film camera would be an analogue picture. A photo taken by a digital camera would be defined in terms of zeros and ones and would be considered digital. (Related word: digital) APPLICATION: The end purpose for which remote sensing is used. Most often remote sensing is used to measure, map or monitor features of our environment. (See Student s Introduction to Remote Sensing for examples of applications) (Related word: apply) BACKSCATTERING: Energy, when hitting a target, can be scattered in many directions. The part of the energy that is scattered back in the exact direction where it came from, is backscattered. (Related word: reflection) CLOUD: If there are clouds in the area and an optical satellite like SPOT, IRS or Landsat passes overhead, the satellite image will show the cloud but the features below the cloud won t be seen. A cloud shadow, the same shape as the cloud, will be seen nearby. (Related words: penetration, reflection, opaque) CLASSIFICATION: When image pixels are the same colour, or nearly the same colour, an image classification computer program can recognize this and group such pixels together. Such a grouping is called a class and the process of doing the grouping is called classification. The remote sensing researcher then has the challenge of identifying just what each class represents in the real environment (pine trees? pavement? shallow water? dry grass?). (Related word: classes) COMPOSITE IMAGE: We can make a composite image by selecting the most appropriate parts of other images. For instance, we could take only the cloud-free parts of Section Glossary of Remote Sensing Terms 77 page 7

18 802/04/001:19 WATCHING OVER OUR PLANET FROM SPACE many images to make a composite image of all of Canada showing no clouds at all. It would not be a realistic scene, since we always have some clouds, but it would show all of Canada without allowing cloud cover to mask parts of it. (Related words: combining, mosaic) DETECTION: If you are detecting something, you are trying to determine if it is there. This could be done using your senses or by using instruments. Once it is found, it has been detected. (Related words: sensing, discovery, detect) DIGITAL DATA: Information that is made up of numbers is digital data. Telephone numbers are digital data, so are the percentage scores on your last test. So are digital images from satellites. The opposite of digital is ANALOGUE. (Related words: digitized, analogue) DIGITAL ANALYSIS: If you have a digital satellite image, then it s useful to analyze it digitally. Special computer programs are available for this. Such programs can stretch and distort a digital image to make it fit a map, they can enhance it to make it show some features more clearly, they can classify the image into categories which contain similar features, and much more. (Related words: image analysis, classification, enhancement) EARTH OBSERVATION: Looking down at the Earth from aircraft and satellites using various sensors which make images that are afterwards used to study what is happening on or near the Earth s surface. (Related word: remote sensing) ELECTROMAGNETIC SPECTRUM: The range of energy which contains parts or bands such as the visible, infrared, ultraviolet, microwave (radar), gamma ray, x-ray, radio, and which travels at the speed of light. Different parts of the electromagnetic spectrum have different wavelengths and frequencies. (Related words: spectrum, radiation, spectral band) EMIT: This word means the same as sent out or given off. The sun emits radiation, some of which we can feel as heat and some of which we can see as light. The radar sensor in RADARSAT emits a radar beam. (Related words: transmit, radiation) ENHANCEMENT: Anything that you do to an image to Section Glossary of Remote Sensing Terms 88 page 8

19 902/04/001:19 WATCHING OVER OUR PLANET FROM SPACE make it simpler, faster or more accurate to analyze and interpret by eye is a form of enhancement. Special enhancement techniques can improve colour, brightness, contrast, sharpness, etc. (Related words: visual interpretation) GROUND STATION: See RECEIVING STATION GROUND TRUTHING: Remote sensing analysts must be sure that their image analysis is accurate. This is done by field where they go out to the actual places shown in the images and confirm that what they think they see on the image is actually true. (Related words: verification, calibration) IMAGE: The picture that is a result of the sensing process. A remote sensing image can be displayed on a computer monitor or it can be made into a printed copy. (Related word: imagery) IMAGE ANALYSIS: This is the process of studying an image in order to explain, measure, map, count or monitor what is on the Earth s surface. (Related words: interpretation, classification) LANDSAT: Owned and launched by the United States, this is a series of remote sensing satellites that use the visible and infrared parts of the spectrum to record images of the Earth s surface. (Related words: SPOT, IRS, RADARSAT, NOAA, satellite) LINE-OF-SIGHT: When two objects (such as a satellite and a receiving station) have nothing in between them, then they are in line-of-sight of each other. When a satellite is on the other side of the Earth from a receiving station, the Earth is in between them, so the satellite and the receiving station are not in line-of sight of each other. (Related words: visibility, data reception) MONITORING: Keeping track of how things change over time. For example, with remote sensing, using several images taken over time, you can monitor the result of logging in a forest or how much of an oil slick in the ocean has been cleaned up or how well crops are growing or how much a glacier has melted or how far a plume of sediment travels in a lake, etc. (Related words: change detection, multi-temporal analysis) Section Glossary of Remote Sensing Terms 99 page 9

20 1002/04/001:19 WATCHING OVER OUR PLANET FROM SPACE MOSAIC: A big image made by combining smaller images. For example, to get an image of a whole province in Canada, we must combine many images. This is tricky because the images were probably taken at different times and possibly in different seasons so they could look different in colour or brightness. ORBIT: The path traced by a satellite as it passes around a planet. (Related words: path, satellite, near polar, geostationary) PIXEL: The smallest unit in a digital image. A satellite image is made up of a matrix of many pixels, each having its own digital value. (Related words: image, digital analysis) PLATFORM: This is what carries a sensor usually a satellite or an airplane. But a remote sensing platform could also be a hot-air balloon, a tall tower, etc. (related words: satellite, aircraft, sensor) RADAR SHADOW: Just as with a flashlight, a radar sensor illuminates a scene, and if an object blocks the beam, a shadow area develops behind it. Such shadows can be seen in a radar image. Radar shadows are pure black they contain absolutely no information. (Related word: radar beam) RADARSAT: This is the first Canadian remote sensing satellite. It uses radar technology to capture images of the earth s surface. (Related words: satellite, radar) RECEIVING STATION: At a receiving station, antennas collect the signals sent by an orbiting satellite. Electronic devices process the signals and the data are stored. Usually the station also converts the data into usable digital and printed images. (Related words: satellite, reception, downlink) REFLECTION: Reflection occurs when radiation (light, radar signals, etc.) bounces off a target. It is very important in remote sensing how that reflection happens, how much is reflected and how the radiation is changed in the process of reflection, because it tells us much about the target that caused the reflection Section Glossary of Remote Sensing Terms 1010page 10

21 1102/04/001:19 WATCHING OVER OUR PLANET FROM SPACE REMOTE SENSING: Remote sensing is the action of collecting images or other forms of data about the surface of the Earth, from measurements made at some distance above the Earth, processing these data and analyzing them. (Related words: earth observation, environmental monitoring) RESOLUTION: Spatial resolution describes how clearly you can see detail in a picture. Consider the focussing done by a camera. If the picture is blurry and you can t see small objects, the resolution is poor (low resolution). If the picture is sharp and you can see small objects, the resolution is good (high resolution). Resolution is also used in describing colour detail (how similar colours are) and even time detail (how close in time things happen). (Related words: detail, image analysis) SATELLITE: A satellite is a natural or man made object continuously orbiting above the Earth or another planet or star. A remote sensing satellite carries one or more instruments for recording images of the Earth, which are transmitted to a receiving station using radio waves. (Related words: platform, receiving station, orbit) SCANNER: While a camera would take a picture of an area all at once, a scanner is a device that examines an area point by point until the entire area has been imaged. These points become the pixels in a digital remote sensing image. SENSOR: A sensor is the device that records a remote sensing image, much like a camera. (Related words: scanner, platform) SPECTRUM: See ELECTROMAGNETIC SPECTRUM TARGET: Targets are the features being studied in a remote sensing image. (Related words: backscatter, reflection) Queen Charlotte Islands Wind on the open water makes it appear lighter TRANSMIT: Energy that passes through an object or material is transmitted. This is in contrast to energy that may be reflected or absorbed. A window (which is not too dirty) allows light to transmit through and thus we are able to see through glass. (Related words: reflect, absorb, backscatter) Section Glossary of Remote Sensing Terms 1111page 11

22 Appendix A: Using a Dot Grid (to Measure Area) Using the dot grid technique: 1. Trace the dot grid onto a piece of acetate film. 2. Place the acetate with the dot grid, over the area that you want to measure. It doesn t matter how the acetate fits over the image, as long as all of the area to be measured is covered by the dots. 3. Count the dots that fall within the area to be measured. Once you start counting, don t move the acetate. If a dot is on the edge of the area, count it if it s more than one half inside the area, and don t count it if it s less than one half inside the area. 4. The number of dots that represent 1 square kilometre will be specified in each activity. Divide the total dot count that you made by that number to arrive at the final area in square kilometres. Appendix B: Using a Compass A "compass rose" is an illustration such as the one on this page, showing the points of the compass. The main directions: north, south, east, west are called the "cardinal points" of the compass. Always look for the compass rose, or perhaps a "north arrow", to see in which direction an image is oriented. North isn't always to the top, although that is a popular convention. Appendices A & B page 1
23 Appendix C: Using Coordinates One convenient and precise way to point to a certain spot on a picture (or a map) is by the Cartesian Coordinate method. A series of numbers (or sometimes letters) on the edge of the picture lets you identify a spot without having to put some reference mark inside the picture. If we want to talk about a feature such as a lake, road or field in a satellite image and we don t want to mark up the image itself, then we can use two numbers to identify the spot. The first number is always the horizontal distance and the second number is always the vertical distance. In the example here, the star has a horizontal coordinate of 4.4 and a vertical coordinate of 2.8, and they are often written as: (4.4, 2.8). Use a straight edge like a ruler or a piece of paper to line up the numbers. Make sure the straight edge is exactly parallel to the edge of the image. This can be done by connecting the same number (4.4 in this example) on both the top and the bottom scale. Do the same for the second number by lining up the same number (2.8 in this example) on both the left and right scales. To see if you can do this, try to find the coordinates of the centre of the circle in the diagram. They are: (, ) Appendix C page 2
 2 b) 7 c) 12 d) 9 e) 8 f) 10 g) 5 3.2 Find It 1) C: (7.7, 6.1) 2) A: (5.2, 2.6) 3) B: (4.8, 6.7) 4) A: (8.2, 4.2) h) 10 i) 4 j) 11 k) 3 l) 6 m) 1 5) D: (5.7, 8.0) 6) B: (5.5, 6.4) 7) D: (5.3, 5.")
24 An Earth Observation education kit for elementary schools from the Canada Centre for Remote Sensing, Natural Resources Canada Version: 11.0 Appendix D: Answers to the Activities 3.1 Which is Which? a) 2 b) 7 c) 12 d) 9 e) 8 f) 10 g) Find It 1) C: (7.7, 6.1) 2) A: (5.2, 2.6) 3) B: (4.8, 6.7) 4) A: (8.2, 4.2) h) 10 i) 4 j) 11 k) 3 l) 6 m) 1 5) D: (5.7, 8.0) 6) B: (5.5, 6.4) 7) D: (5.3, 5.0) 3.3a Measure This (northern Saskatchewan) 1) D: (2.0, 0.5) 2) A: light pink 3) C: less than 1km long 4) A: 17 km 5) B: less than 1 square km 6) D: 10 km 3.3b Measure This (Halifax area) 1) D: (1.4, 0.7) 2) A: south 3) C: (1.0, 1.2) 4) B: 16 km 3.4 Clearcutting in the Forest D) (0.7, 5.0) (2.4, 3.0) (6.5, 9.2) E) approximately 7.4 square km 3.5 Oil Spill Danger A) Ormond B) Canto C) June 18 (in 5 days) D) Approximately 67 barriers 3.6 Crops Types Task #1 Town: (1.4, 1.6) Village: (4.1, 5.3) River exits at: (6.0, 2.8) Railway exits at: (0.0, 5.5) Task #2 a) beans b) beans c) alfalfa d) corn e) corn f) grains g) grains Task #3 a) trees and shrubs b) approximately 32 fields 3.7 Forest Fire Task #1 Approximately 16 km Task #2 Closest Lake is at: (2.1, 2.1) Next closest lake is at: (0.7, 3.7) Appendix D Answers to Activities page 3
 The more difficult route is >9 km (red route) 3.")
 3 B) 4 C) 1 D) 2 E) 4 F) 4 Queen Charlotte City A, B) 2 C) 3 D) 4 3.12 A Different Perspective 1) H 2) D 3) F 4) A 5) C 6) G 7) B 8) E http://www.")
25 An Earth Observation education kit for elementary schools from the Canada Centre for Remote Sensing, Natural Resources Canada Version: Navigating a Ship Through Ice 3.10 Land Use Mapping Task Distance: 8.5 km (blue route) The more difficult route is >9 km (red route) 3.11 At a Mine Site 1) (4.5, 2.7) 2) (2.0, 6.0) 3) (6.5, 6.7) 4) (4.6, 3.2) 5) (3.7, 3.7) 6) (6.5, 8.1) 7) (4.1, 8.8) 3.9 You Figure it Out! Sandspit A) 3 B) 4 C) 1 D) 2 E) 4 F) 4 Queen Charlotte City A, B) 2 C) 3 D) A Different Perspective 1) H 2) D 3) F 4) A 5) C 6) G 7) B 8) E Appendix D Answers to Activities page 4
Geo/SAT 2 INTRODUCTION TO REMOTE SENSING
 Geo/SAT 2 INTRODUCTION TO REMOTE SENSING Paul R. Baumann, Professor Emeritus State University of New York College at Oneonta Oneonta, New York 13820 USA COPYRIGHT 2008 Paul R. Baumann Introduction Remote
Exploring the Earth with Remote Sensing: Tucson
 Exploring the Earth with Remote Sensing: Tucson Project ASTRO Chile March 2006 1. Introduction In this laboratory you will explore Tucson and its surroundings with remote sensing. Remote sensing is the
Important Missions. weather forecasting and monitoring communication navigation military earth resource observation LANDSAT SEASAT SPOT IRS
 Fundamentals of Remote Sensing Pranjit Kr. Sarma, Ph.D. Assistant Professor Department of Geography Mangaldai College Email: prangis@gmail.com Ph. No +91 94357 04398 Remote Sensing Remote sensing is defined
Interpreting land surface features. SWAC module 3
 Interpreting land surface features SWAC module 3 Interpreting land surface features SWAC module 3 Different kinds of image Panchromatic image True-color image False-color image EMR : NASA Echo the bat
An Introduction to Geomatics. Prepared by: Dr. Maher A. El-Hallaq خاص بطلبة مساق مقدمة في علم. Associate Professor of Surveying IUG
 An Introduction to Geomatics خاص بطلبة مساق مقدمة في علم الجيوماتكس Prepared by: Dr. Maher A. El-Hallaq Associate Professor of Surveying IUG 1 Airborne Imagery Dr. Maher A. El-Hallaq Associate Professor
RADAR (RAdio Detection And Ranging)
") RADAR (RAdio Detection And Ranging) CLASSIFICATION OF NONPHOTOGRAPHIC REMOTE SENSORS PASSIVE ACTIVE DIGITAL CAMERA THERMAL (e.g. TIMS) VIDEO CAMERA MULTI- SPECTRAL SCANNERS VISIBLE & NIR MICROWAVE Real
RADAR (RAdio Detection And Ranging) CLASSIFICATION OF NONPHOTOGRAPHIC REMOTE SENSORS PASSIVE ACTIVE DIGITAL CAMERA THERMAL (e.g. TIMS) VIDEO CAMERA MULTI- SPECTRAL SCANNERS VISIBLE & NIR MICROWAVE Real
Govt. Engineering College Jhalawar Model Question Paper Subject- Remote Sensing & GIS
 Govt. Engineering College Jhalawar Model Question Paper Subject- Remote Sensing & GIS Time: Max. Marks: Q1. What is remote Sensing? Explain the basic components of a Remote Sensing system. Q2. What is
Introduction to Remote Sensing
 Introduction to Remote Sensing Outline Remote Sensing Defined Resolution Electromagnetic Energy (EMR) Types Interpretation Applications Remote Sensing Defined Remote Sensing is: The art and science of
An Introduction to Remote Sensing & GIS. Introduction
 An Introduction to Remote Sensing & GIS Introduction Remote sensing is the measurement of object properties on Earth s surface using data acquired from aircraft and satellites. It attempts to measure something
Outline Remote Sensing Defined Resolution Electromagnetic Energy (EMR) Types Interpretation Applications 2
 Types Interpretation Applications 2") Introduction to Remote Sensing 1 Outline Remote Sensing Defined Resolution Electromagnetic Energy (EMR) Types Interpretation Applications 2 Remote Sensing Defined Remote Sensing is: The art and science
Introduction to Remote Sensing 1 Outline Remote Sensing Defined Resolution Electromagnetic Energy (EMR) Types Interpretation Applications 2 Remote Sensing Defined Remote Sensing is: The art and science
Aerial photography and Remote Sensing. Bikini Atoll, 2013 (60 years after nuclear bomb testing)
") Aerial photography and Remote Sensing Bikini Atoll, 2013 (60 years after nuclear bomb testing) Computers have linked mapping techniques under the umbrella term : Geomatics includes all the following spatial
Aerial photography and Remote Sensing Bikini Atoll, 2013 (60 years after nuclear bomb testing) Computers have linked mapping techniques under the umbrella term : Geomatics includes all the following spatial
Lecture 13: Remotely Sensed Geospatial Data
 Lecture 13: Remotely Sensed Geospatial Data A. The Electromagnetic Spectrum: The electromagnetic spectrum (Figure 1) indicates the different forms of radiation (or simply stated light) emitted by nature.
Ghazanfar A. Khattak National Centre of Excellence in Geology University of Peshawar
 INTRODUCTION TO REMOTE SENSING Ghazanfar A. Khattak National Centre of Excellence in Geology University of Peshawar WHAT IS REMOTE SENSING? Remote sensing is the science of acquiring information about
Outline Remote Sensing Defined Resolution Electromagnetic Energy (EMR) Types Interpretation Applications
 Types Interpretation Applications") Introduction to Remote Sensing Outline Remote Sensing Defined Resolution Electromagnetic Energy (EMR) Types Interpretation Applications Remote Sensing Defined Remote Sensing is: The art and science of
Introduction to Remote Sensing Outline Remote Sensing Defined Resolution Electromagnetic Energy (EMR) Types Interpretation Applications Remote Sensing Defined Remote Sensing is: The art and science of
A map says to you, 'Read me carefully, follow me closely, doubt me not.' It says, 'I am the Earth in the palm of your hand. Without me, you are alone
 A map says to you, 'Read me carefully, follow me closely, doubt me not.' It says, 'I am the Earth in the palm of your hand. Without me, you are alone and lost. Beryl Markham (West With the Night, 1946
Microwave Remote Sensing (1)
") Microwave Remote Sensing (1) Microwave sensing encompasses both active and passive forms of remote sensing. The microwave portion of the spectrum covers the range from approximately 1cm to 1m in wavelength.
Microwave Remote Sensing (1) Microwave sensing encompasses both active and passive forms of remote sensing. The microwave portion of the spectrum covers the range from approximately 1cm to 1m in wavelength.
Active and Passive Microwave Remote Sensing
 Active and Passive Microwave Remote Sensing Passive remote sensing system record EMR that was reflected (e.g., blue, green, red, and near IR) or emitted (e.g., thermal IR) from the surface of the Earth.
How can we "see" using the Infrared?
 The Infrared Infrared light lies between the visible and microwave portions of the electromagnetic spectrum. Infrared light has a range of wavelengths, just like visible light has wavelengths that range
Introduction to Remote Sensing
 Introduction to Remote Sensing 1 Outline Remote Sensing Defined Electromagnetic Energy (EMR) Resolution Interpretation 2 Remote Sensing Defined Remote Sensing is: The art and science of obtaining information
Introduction to Remote Sensing Fundamentals of Satellite Remote Sensing. Mads Olander Rasmussen
 Introduction to Remote Sensing Fundamentals of Satellite Remote Sensing Mads Olander Rasmussen (mora@dhi-gras.com) 01. Introduction to Remote Sensing DHI What is remote sensing? the art, science, and technology
746A27 Remote Sensing and GIS
 746A27 Remote Sensing and GIS Lecture 1 Concepts of remote sensing and Basic principle of Photogrammetry Chandan Roy Guest Lecturer Department of Computer and Information Science Linköping University What
Remote Sensing. Ch. 3 Microwaves (Part 1 of 2)
") Remote Sensing Ch. 3 Microwaves (Part 1 of 2) 3.1 Introduction 3.2 Radar Basics 3.3 Viewing Geometry and Spatial Resolution 3.4 Radar Image Distortions 3.1 Introduction Microwave (1cm to 1m in wavelength)
Remote Sensing Ch. 3 Microwaves (Part 1 of 2) 3.1 Introduction 3.2 Radar Basics 3.3 Viewing Geometry and Spatial Resolution 3.4 Radar Image Distortions 3.1 Introduction Microwave (1cm to 1m in wavelength)
NRS 415 Remote Sensing of Environment
 NRS 415 Remote Sensing of Environment 1 High Oblique Perspective (Side) Low Oblique Perspective (Relief) 2 Aerial Perspective (See What s Hidden) An example of high spatial resolution true color remote
Introduction to Remote Sensing
 Introduction to Remote Sensing Spatial, spectral, temporal resolutions Image display alternatives Vegetation Indices Image classifications Image change detections Accuracy assessment Satellites & Air-Photos
Microwave Remote Sensing
 Provide copy on a CD of the UCAR multi-media tutorial to all in class. Assign Ch-7 and Ch-9 (for two weeks) as reading material for this class. HW#4 (Due in two weeks) Problems 1,2,3 and 4 (Chapter 7)
Introduction to Radar
 National Aeronautics and Space Administration ARSET Applied Remote Sensing Training http://arset.gsfc.nasa.gov @NASAARSET Introduction to Radar Jul. 16, 2016 www.nasa.gov Objective The objective of this
EE 529 Remote Sensing Techniques. Introduction
 EE 529 Remote Sensing Techniques Introduction Course Contents Radar Imaging Sensors Imaging Sensors Imaging Algorithms Imaging Algorithms Course Contents (Cont( Cont d) Simulated Raw Data y r Processing
Module 3 Introduction to GIS. Lecture 8 GIS data acquisition
 Module 3 Introduction to GIS Lecture 8 GIS data acquisition GIS workflow Data acquisition (geospatial data input) GPS Remote sensing (satellites, UAV s) LiDAR Digitized maps Attribute Data Management Data
Conceptual Physics Fundamentals
 Conceptual Physics Fundamentals Chapter 13: LIGHT WAVES This lecture will help you understand: Electromagnetic Spectrum Transparent and Opaque Materials Color Why the Sky is Blue, Sunsets are Red, and
Uses of Electromagnetic Waves
 Uses of Electromagnetic Waves 1 of 42 Boardworks Ltd 2016 Uses of Electromagnetic Waves 2 of 42 Boardworks Ltd 2016 What are radio waves? 3 of 42 Boardworks Ltd 2016 The broadcast of every radio and television
Electromagnetic (Light) Waves Electromagnetic Waves
 Waves Electromagnetic Waves") Physics R Date: Review Questions 1. An ocean wave traveling at 3 m/s has a wavelength of 1.6 meters. a. What is the frequency of the wave? b. What is the period of the wave? Electromagnetic (Light) Waves
Physics R Date: Review Questions 1. An ocean wave traveling at 3 m/s has a wavelength of 1.6 meters. a. What is the frequency of the wave? b. What is the period of the wave? Electromagnetic (Light) Waves
Land Cover Analysis to Determine Areas of Clear-cut and Forest Cover in Olney, Montana. Geob 373 Remote Sensing. Dr Andreas Varhola, Kathry De Rego
 1 Land Cover Analysis to Determine Areas of Clear-cut and Forest Cover in Olney, Montana Geob 373 Remote Sensing Dr Andreas Varhola, Kathry De Rego Zhu an Lim (14292149) L2B 17 Apr 2016 2 Abstract Montana
Final Examination Introduction to Remote Sensing. Time: 1.5 hrs Max. Marks: 50. Section-I (50 x 1 = 50 Marks)
") Final Examination Introduction to Remote Sensing Time: 1.5 hrs Max. Marks: 50 Note: Attempt all questions. Section-I (50 x 1 = 50 Marks) 1... is the technology of acquiring information about the Earth's
Final Examination Introduction to Remote Sensing Time: 1.5 hrs Max. Marks: 50 Note: Attempt all questions. Section-I (50 x 1 = 50 Marks) 1... is the technology of acquiring information about the Earth's
Copernicus Introduction Lisbon, Portugal 13 th & 14 th February 2014
 Copernicus Introduction Lisbon, Portugal 13 th & 14 th February 2014 Contents Introduction GMES Copernicus Six thematic areas Infrastructure Space data An introduction to Remote Sensing In-situ data Applications
Remote Sensing for Rangeland Applications
 Remote Sensing for Rangeland Applications Jay Angerer Ecological Training June 16, 2012 Remote Sensing The term "remote sensing," first used in the United States in the 1950s by Ms. Evelyn Pruitt of the
Microwave remote sensing. Rudi Gens Alaska Satellite Facility Remote Sensing Support Center
 Microwave remote sensing Alaska Satellite Facility Remote Sensing Support Center 1 Remote Sensing Fundamental The entire range of EM radiation constitute the EM Spectrum SAR sensors sense electromagnetic
Int n r t o r d o u d c u ti t on o n to t o Remote Sensing
 Introduction to Remote Sensing Definition of Remote Sensing Remote sensing refers to the activities of recording/observing/perceiving(sensing)objects or events at far away (remote) places. In remote sensing,
Viewing New Hampshire from Space
 Viewing New Hampshire from Space A Bird s-eye View of the Granite State! Introduction Environmental changes are a major concern for researchers and policy makers today since these changes have both human
FOR 353: Air Photo Interpretation and Photogrammetry. Lecture 2. Electromagnetic Energy/Camera and Film characteristics
 FOR 353: Air Photo Interpretation and Photogrammetry Lecture 2 Electromagnetic Energy/Camera and Film characteristics Lecture Outline Electromagnetic Radiation Theory Digital vs. Analog (i.e. film ) Systems
INTRODUCTORY REMOTE SENSING. Geob 373
 INTRODUCTORY REMOTE SENSING Geob 373 Landsat 7 15 m image highlighting the geology of Oman http://www.satimagingcorp.com/gallery-landsat.html ASTER 15 m SWIR image, Escondida Mine, Chile http://www.satimagingcorp.com/satellite-sensors/aster.html
Active and Passive Microwave Remote Sensing
 Active and Passive Microwave Remote Sensing Passive remote sensing system record EMR that was reflected (e.g., blue, green, red, and near IR) or emitted (e.g., thermal IR) from the surface of the Earth.
Visualizing a Pixel. Simulate a Sensor s View from Space. In this activity, you will:
 Simulate a Sensor s View from Space In this activity, you will: Measure and mark pixel boundaries Learn about spatial resolution, pixels, and satellite imagery Classify land cover types Gain exposure to
Blacksburg, VA July 24 th 30 th, 2010 Remote Sensing Page 1. A condensed overview. For our purposes
 A condensed overview George McLeod Prepared by: With support from: NSF DUE-0903270 in partnership with: Geospatial Technician Education Through Virginia s Community Colleges (GTEVCC) The art and science
1. Theory of remote sensing and spectrum
 1. Theory of remote sensing and spectrum 7 August 2014 ONUMA Takumi Outline of Presentation Electromagnetic wave and wavelength Sensor type Spectrum Spatial resolution Spectral resolution Mineral mapping
ACTIVE SENSORS RADAR
 ACTIVE SENSORS RADAR RADAR LiDAR: Light Detection And Ranging RADAR: RAdio Detection And Ranging SONAR: SOund Navigation And Ranging Used to image the ocean floor (produce bathymetic maps) and detect objects
earthobservation.wordpress.com
 Dirty REMOTE SENSING earthobservation.wordpress.com Stuart Green Teagasc Stuart.Green@Teagasc.ie 1 Purpose Give you a very basic skill set and software training so you can: find free satellite image data.
Some Basic Concepts of Remote Sensing. Lecture 2 August 31, 2005
 Some Basic Concepts of Remote Sensing Lecture 2 August 31, 2005 What is remote sensing Remote Sensing: remote sensing is science of acquiring, processing, and interpreting images and related data that
Making NDVI Images using the Sony F717 Nightshot Digital Camera and IR Filters and Software Created for Interpreting Digital Images.
 Making NDVI Images using the Sony F717 Nightshot Digital Camera and IR Filters and Software Created for Interpreting Digital Images Draft 1 John Pickle Museum of Science October 14, 2004 Digital Cameras
17-1 Electromagnetic Waves
 17-1 Electromagnetic Waves transfers energy called electromagnetic radiation no medium needed transverse some electrical, some magnetic properties speed is 300,000,000 m/s; nothing is faster; at this speed
COMPARISON OF INFORMATION CONTENTS OF HIGH RESOLUTION SPACE IMAGES
 COMPARISON OF INFORMATION CONTENTS OF HIGH RESOLUTION SPACE IMAGES H. Topan*, G. Büyüksalih*, K. Jacobsen ** * Karaelmas University Zonguldak, Turkey ** University of Hannover, Germany htopan@karaelmas.edu.tr,
Lecture Series SGL 308: Introduction to Geological Mapping Lecture 8 LECTURE 8 REMOTE SENSING METHODS: THE USE AND INTERPRETATION OF SATELLITE IMAGES
 LECTURE 8 REMOTE SENSING METHODS: THE USE AND INTERPRETATION OF SATELLITE IMAGES LECTURE OUTLINE Page 8.0 Introduction 114 8.1 Objectives 115 115 8.2 Remote Sensing: Method of Operation 8.3 Importance
Chapter 8. Remote sensing
 1. Remote sensing 8.1 Introduction 8.2 Remote sensing 8.3 Resolution 8.4 Landsat 8.5 Geostationary satellites GOES 8.1 Introduction What is remote sensing? One can describe remote sensing in different
Electromagnetic Waves
 Electromagnetic Waves What is an Electromagnetic Wave? An EM Wave is a disturbance that transfers energy through a field. A field is a area around an object where the object can apply a force on another
NON-PHOTOGRAPHIC SYSTEMS: Multispectral Scanners Medium and coarse resolution sensor comparisons: Landsat, SPOT, AVHRR and MODIS
 NON-PHOTOGRAPHIC SYSTEMS: Multispectral Scanners Medium and coarse resolution sensor comparisons: Landsat, SPOT, AVHRR and MODIS CLASSIFICATION OF NONPHOTOGRAPHIC REMOTE SENSORS PASSIVE ACTIVE DIGITAL
First Exam: Thurs., Sept 28
 8 Geographers Tools: Gathering Information Prof. Anthony Grande Hunter College Geography Lecture design, content and presentation AFG 0917. Individual images and illustrations may be subject to prior copyright.
Light and Applications of Optics
 UNIT 4 Light and Applications of Optics Topic 4.1: What is light and how is it produced? Topic 4.6: What are lenses and what are some of their applications? Topic 4.2 : How does light interact with objects
Due Date: September 22
 Geography 309 Lab 1 Page 1 LAB 1: INTRODUCTION TO REMOTE SENSING Due Date: September 22 Objectives To familiarize yourself with: o remote sensing resources on the Internet o some remote sensing sensors
Wonderlab The Statoil Gallery
 Wonderlab The Statoil Gallery and maths s Age (s) Topic 7 11 LIGHT INFORMATION 11-14 Location WONDERLAB: THE STATOIL GALLERY LEVEL 3, SCIENCE MUSEUM LONDON 1 What s the science? What more will you wonder?
Satellite Remote Sensing: Earth System Observations
 Satellite Remote Sensing: Earth System Observations Land surface Water Atmosphere Climate Ecosystems 1 EOS (Earth Observing System) Develop an understanding of the total Earth system, and the effects of
A (very) brief introduction to Remote Sensing: From satellites to maps!
 brief introduction to Remote Sensing: From satellites to maps!") Spatial Data Analysis and Modeling for Agricultural Development, with R - Workshop A (very) brief introduction to Remote Sensing: From satellites to maps! Earthlights DMSP 1994-1995 https://wikimedia.org/
Spatial Data Analysis and Modeling for Agricultural Development, with R - Workshop A (very) brief introduction to Remote Sensing: From satellites to maps! Earthlights DMSP 1994-1995 https://wikimedia.org/
remote sensing? What are the remote sensing principles behind these Definition
 Introduction to remote sensing: Content (1/2) Definition: photogrammetry and remote sensing (PRS) Radiation sources: solar radiation (passive optical RS) earth emission (passive microwave or thermal infrared
APPLICATION OF REMOTE SENSING DATA FOR OIL SPILL MONITORING IN THE GUANABARA BAY, RIO DE JANEIRO, BRAZIL
 APPLICATION OF REMOTE SENSING DATA FOR OIL SPILL MONITORING IN THE GUANABARA BAY, RIO DE JANEIRO, BRAZIL CRISTINA MARIA BENTZ 1 FERNANDO PELLON DE MIRANDA 1 1 PETROBRAS/CEGEQ (Center of Excellence in Geochemistry
Lecture Notes Prepared by Prof. J. Francis Spring Remote Sensing Instruments
 Lecture Notes Prepared by Prof. J. Francis Spring 2005 Remote Sensing Instruments Material from Remote Sensing Instrumentation in Weather Satellites: Systems, Data, and Environmental Applications by Rao,
GIS Data Collection. Remote Sensing
 GIS Data Collection Remote Sensing Data Collection Remote sensing Introduction Concepts Spectral signatures Resolutions: spectral, spatial, temporal Digital image processing (classification) Other systems
REMOTE SENSING. Topic 10 Fundamentals of Digital Multispectral Remote Sensing MULTISPECTRAL SCANNERS MULTISPECTRAL SCANNERS
 REMOTE SENSING Topic 10 Fundamentals of Digital Multispectral Remote Sensing Chapter 5: Lillesand and Keifer Chapter 6: Avery and Berlin MULTISPECTRAL SCANNERS Record EMR in a number of discrete portions
First Exam. Geographers Tools: Gathering Information. Photographs and Imagery. SPIN 2 Image of Downtown Atlanta, GA 1995 REMOTE SENSING 9/19/2016
 First Exam Geographers Tools: Gathering Information Prof. Anthony Grande Hunter College Geography Lecture design, content and presentation AFG 0616. Individual images and illustrations may be subject to
Dr. P Shanmugam. Associate Professor Department of Ocean Engineering Indian Institute of Technology (IIT) Madras INDIA
 Madras INDIA") Dr. P Shanmugam Associate Professor Department of Ocean Engineering Indian Institute of Technology (IIT) Madras INDIA Biography Ph.D (Remote Sensing and Image Processing for Coastal Studies) - Anna University,
Dr. P Shanmugam Associate Professor Department of Ocean Engineering Indian Institute of Technology (IIT) Madras INDIA Biography Ph.D (Remote Sensing and Image Processing for Coastal Studies) - Anna University,
Image interpretation. Aliens create Indian Head with an ipod? Badlands Guardian (CBC) This feature can be found 300 KMs SE of Calgary.
 This feature can be found 300 KMs SE of Calgary.") Image interpretation Aliens create Indian Head with an ipod? Badlands Guardian (CBC) This feature can be found 300 KMs SE of Calgary. 50 1 N 110 7 W Milestones in the History of Remote Sensing 19 th century
Image interpretation Aliens create Indian Head with an ipod? Badlands Guardian (CBC) This feature can be found 300 KMs SE of Calgary. 50 1 N 110 7 W Milestones in the History of Remote Sensing 19 th century
10 Radar Imaging Radar Imaging
 10 Radar Imaging Active sensors provide their own source of energy to illuminate the target. Active sensors are generally divided into two distinct categories: imaging and non-imaging. The most common
How to Access Imagery and Carry Out Remote Sensing Analysis Using Landsat Data in a Browser
 How to Access Imagery and Carry Out Remote Sensing Analysis Using Landsat Data in a Browser Including Introduction to Remote Sensing Concepts Based on: igett Remote Sensing Concept Modules and GeoTech
9/12/2011. Training Course Remote Sensing Basic Theory & Image Processing Methods September 2011
 Training Course Remote Sensing Basic Theory & Image Processing Methods 19 23 September 2011 Introduction to Remote Sensing Michiel Damen (September 2011) damen@itc.nl 1 Overview Some definitions Remote
RGB colours: Display onscreen = RGB
 RGB colours: http://www.colorspire.com/rgb-color-wheel/ Display onscreen = RGB DIGITAL DATA and DISPLAY Myth: Most satellite images are not photos Photographs are also 'images', but digital images are
Make a Refractor Telescope
 Make a Refractor Telescope In this activity students will build, and observe with, simple refractory telescope providing an interactive introduction to light, lenses and refraction. LEARNING OBJECTIVES
Outline. Introduction. Introduction: Film Emulsions. Sensor Systems. Types of Remote Sensing. A/Prof Linlin Ge. Photographic systems (cf(
 GMAT x600 Remote Sensing / Earth Observation Types of Sensor Systems (1) Outline Image Sensor Systems (i) Line Scanning Sensor Systems (passive) (ii) Array Sensor Systems (passive) (iii) Antenna Radar
Course overview; Remote sensing introduction; Basics of image processing & Color theory
 GEOL 1460 /2461 Ramsey Introduction to Remote Sensing Fall, 2018 Course overview; Remote sensing introduction; Basics of image processing & Color theory Week #1: 29 August 2018 I. Syllabus Review we will
Lidar stands for light detection and ranging. Lidar imagery is created with a laser beam composed of a very narrow light band.
 Lidar stands for light detection and ranging. Lidar imagery is created with a laser beam composed of a very narrow light band. This light can be transmitted over large distances. Normal light is composed
AR M. Sc. (Rural Technology) II Semester Fundamental of Remote Sensing Model Paper
 II Semester Fundamental of Remote Sensing Model Paper") 1. Multiple choice question ; AR- 7251 M. Sc. (Rural Technology) II Semester Fundamental of Remote Sensing Model Paper 1. Chlorophyll strongly absorbs radition of : (b) Red and Blue wavelength (ii) Which
1. Multiple choice question ; AR- 7251 M. Sc. (Rural Technology) II Semester Fundamental of Remote Sensing Model Paper 1. Chlorophyll strongly absorbs radition of : (b) Red and Blue wavelength (ii) Which
GEOG432: Remote sensing Lab 3 Unsupervised classification
 GEOG432: Remote sensing Lab 3 Unsupervised classification Goal: This lab involves identifying land cover types by using agorithms to identify pixels with similar Digital Numbers (DN) and spectral signatures
Longitudinal No, Mechanical wave ~340 m/s (in air) 1,100 feet per second More elastic/denser medium = Greater speed of sound
 1,100 feet per second More elastic/denser medium = Greater speed of sound") Type of wave Travel in Vacuum? Speed Speed vs. Medium Light Sound vs. Sound Longitudinal No, Mechanical wave ~340 m/s (in air) 1,100 feet per second More elastic/denser medium = Greater speed of sound
Type of wave Travel in Vacuum? Speed Speed vs. Medium Light Sound vs. Sound Longitudinal No, Mechanical wave ~340 m/s (in air) 1,100 feet per second More elastic/denser medium = Greater speed of sound
Introduction to Remote Sensing
 Introduction to Remote Sensing Daniel McInerney Urban Institute Ireland, University College Dublin, Richview Campus, Clonskeagh Drive, Dublin 14. 16th June 2009 Presentation Outline 1 2 Spaceborne Sensors
Remote Sensing. in Agriculture. Dr. Baqer Ramadhan CRP 514 Geographic Information System. Adel M. Al-Rebh G Term Paper.
 Remote Sensing in Agriculture Term Paper to Dr. Baqer Ramadhan CRP 514 Geographic Information System By Adel M. Al-Rebh G199325390 May 2012 Table of Contents 1.0 Introduction... 4 2.0 Objective... 4 3.0
Introductory Physics, High School Learning Standards for a Full First-Year Course
 Introductory Physics, High School Learning Standards for a Full First-Year Course I. C ONTENT S TANDARDS 4.1 Describe the measurable properties of waves (velocity, frequency, wavelength, amplitude, period)
Sommersemester Prof. Dr. Christoph Kleinn Institut für Waldinventur und Waldwachstum Arbeitsbereich Fernerkundung und Waldinventur.
 Basics of Remote Sensing Some literature references Franklin, SE 2001 Remote Sensing for Sustainable Forest Management Lewis Publishers 407p Lillesand, Kiefer 2000 Remote Sensing and Image Interpretation
Outline for today. Geography 411/611 Remote sensing: Principles and Applications. Remote sensing: RS for biogeochemical cycles
 Geography 411/611 Remote sensing: Principles and Applications Thomas Albright, Associate Professor Laboratory for Conservation Biogeography, Department of Geography & Program in Ecology, Evolution, & Conservation
Fundamentals of Remote Sensing
 Climate Variability, Hydrology, and Flooding Fundamentals of Remote Sensing May 19-22, 2015 GEO-Latin American & Caribbean Water Cycle Capacity Building Workshop Cartagena, Colombia 1 Objective To provide
Image interpretation I and II
 Image interpretation I and II Looking at satellite image, identifying different objects, according to scale and associated information and to communicate this information to others is what we call as IMAGE
Remote sensing in archaeology from optical to lidar. Krištof Oštir ModeLTER Scientific Research Centre of the Slovenian Academy of Sciences and Arts
 Remote sensing in archaeology from optical to lidar Krištof Oštir ModeLTER Scientific Research Centre of the Slovenian Academy of Sciences and Arts Introduction Optical remote sensing Systems Search for
GEOG432: Remote sensing Lab 3 Unsupervised classification
 GEOG432: Remote sensing Lab 3 Unsupervised classification Goal: This lab involves identifying land cover types by using agorithms to identify pixels with similar Digital Numbers (DN) and spectral signatures
Monitoring agricultural plantations with remote sensing imagery
 MPRA Munich Personal RePEc Archive Monitoring agricultural plantations with remote sensing imagery Camelia Slave and Anca Rotman University of Agronomic Sciences and Veterinary Medicine - Bucharest Romania,
Synthetic aperture RADAR (SAR) principles/instruments October 31, 2018
 principles/instruments October 31, 2018") GEOL 1460/2461 Ramsey Introduction to Remote Sensing Fall, 2018 Synthetic aperture RADAR (SAR) principles/instruments October 31, 2018 I. Reminder: Upcoming Dates lab #2 reports due by the start of next
GEOL 1460/2461 Ramsey Introduction to Remote Sensing Fall, 2018 Synthetic aperture RADAR (SAR) principles/instruments October 31, 2018 I. Reminder: Upcoming Dates lab #2 reports due by the start of next
Light. In this unit: 1) Electromagnetic Spectrum 2) Properties of Light 3) Reflection 4) Colors 5) Refraction
 Electromagnetic Spectrum 2) Properties of Light 3) Reflection 4) Colors 5) Refraction") Light In this unit: 1) Electromagnetic Spectrum 2) Properties of Light 3) Reflection 4) Colors 5) Refraction Part 1 Electromagnetic Spectrum and Visible Light Remember radio waves are long and gamma rays
Light In this unit: 1) Electromagnetic Spectrum 2) Properties of Light 3) Reflection 4) Colors 5) Refraction Part 1 Electromagnetic Spectrum and Visible Light Remember radio waves are long and gamma rays
Spectral Signatures. Vegetation. 40 Soil. Water WAVELENGTH (microns)
") Spectral Signatures % REFLECTANCE VISIBLE NEAR INFRARED Vegetation Soil Water.5. WAVELENGTH (microns). Spectral Reflectance of Urban Materials 5 Parking Lot 5 (5=5%) Reflectance 5 5 5 5 5 Wavelength (nm)
Spectral Signatures % REFLECTANCE VISIBLE NEAR INFRARED Vegetation Soil Water.5. WAVELENGTH (microns). Spectral Reflectance of Urban Materials 5 Parking Lot 5 (5=5%) Reflectance 5 5 5 5 5 Wavelength (nm)
Co-ReSyF RA lecture: Vessel detection and oil spill detection
 This project has received funding from the European Union s Horizon 2020 Research and Innovation Programme under grant agreement no 687289 Co-ReSyF RA lecture: Vessel detection and oil spill detection
MSB Imagery Program FAQ v1
 MSB Imagery Program FAQ v1 (F)requently (A)sked (Q)uestions 9/22/2016 This document is intended to answer commonly asked questions related to the MSB Recurring Aerial Imagery Program. Table of Contents
CHAPTER 7: Multispectral Remote Sensing
 CHAPTER 7: Multispectral Remote Sensing REFERENCE: Remote Sensing of the Environment John R. Jensen (2007) Second Edition Pearson Prentice Hall Overview of How Digital Remotely Sensed Data are Transformed
First Exam: New Date. 7 Geographers Tools: Gathering Information. Photographs and Imagery REMOTE SENSING 2/23/2018. Friday, March 2, 2018.
 First Exam: New Date Friday, March 2, 2018. Combination of multiple choice questions and map interpretation. Bring a #2 pencil with eraser. Based on class lectures supplementing chapter 1. Review lecture
Passive Microwave Sensors LIDAR Remote Sensing Laser Altimetry. 28 April 2003
 Passive Microwave Sensors LIDAR Remote Sensing Laser Altimetry 28 April 2003 Outline Passive Microwave Radiometry Rayleigh-Jeans approximation Brightness temperature Emissivity and dielectric constant
Unit 1.5 Waves. The number waves per second. 1 Hz is 1waves per second. If there are 40 waves in 10 seconds then the frequency is 4 Hz.
 Unit 1.5 Waves Basic information Transverse: The oscillations of the particles are at right angles (90 ) to the direction of travel (propagation) of the wave. Examples: All electromagnetic waves (Light,
Chapter 1 Overview of imaging GIS
 Chapter 1 Overview of imaging GIS Imaging GIS, a term used in the medical imaging community (Wang 2012), is adopted here to describe a geographic information system (GIS) that displays, enhances, and facilitates
to Geospatial Technologies
 What s in a Pixel? A Primer for Remote Sensing What s in a Pixel Development UNH Cooperative Extension Geospatial Technologies Training Center Shane Bradt UConn Cooperative Extension Geospatial Technology