USA / Canada / Mexico Phone Fax Toll-Free (USA / CDN): Phone Fax
|
|
|
- Judith Baldwin
- 6 years ago
- Views:
Transcription

1
2 2 Rel. May 2005 USA / Canada / Mexico Phone Fax Toll-Free (USA / CDN): Phone Fax

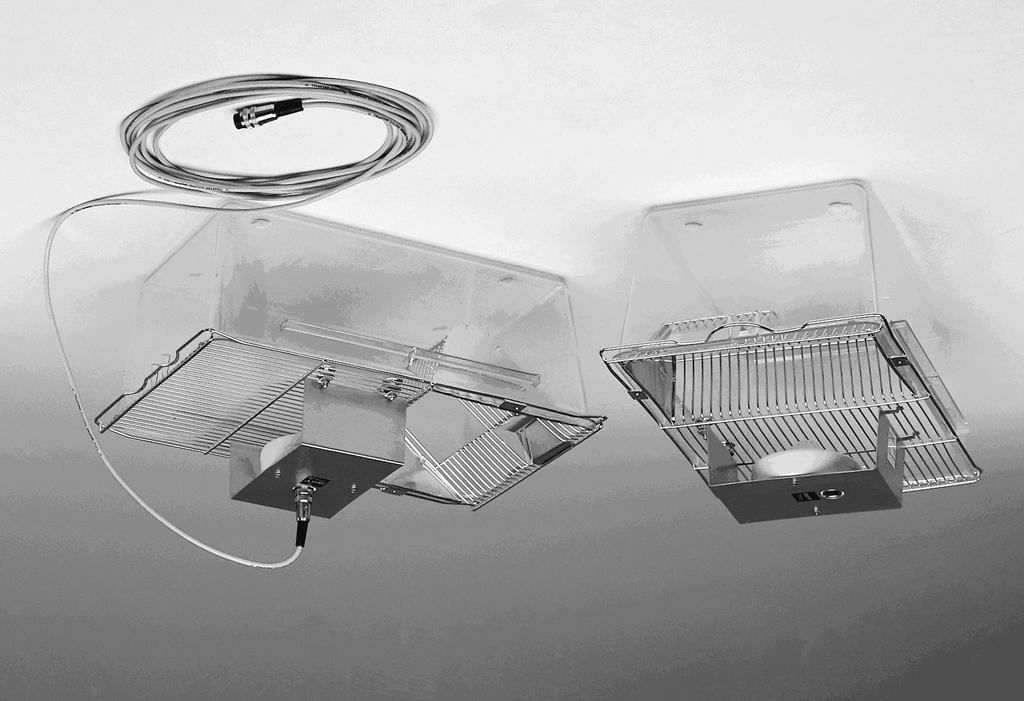
3 3 TSE InfraMot TSE InfraMot is a system for rapidly and easily determining the activity of mice, rats and other small laboratory animals. The system uses so-called "passive infrared sensors". These sensors register the activity of one or more subjects by sensing the body-heat image, i.e. the infrared radiation, and its spatial displacement over time. In this way movement within the cage can be reliably determined. This even includes brief movement events of only a few milliseconds duration! The wide angle detector means that rearing events are also included in the activity data. Activity can be measured under any lighting conditions. Measurements can even be made in complete darkness. The standard sensor assembly is designed to be mounted on top of a home cage but it can also be configured for any other arena such as an operant cage or an open field. The recorded area depends on the height at which the sensor unit is mounted. The recording sensitivity is virtually unaffected by grid-shaped materials such as a grid cover. Closed materials prevent heat detection. This means that provided that the assembly height is suitable animals (=sources of heat) in neighboring cages do not interfere with the recording. The user-friendly TSE InfraMot software records the counter totals at adjustable intervals. This measuring data provides a relative measure of the duration and intensity of the activity. The scanning interval can be defined by the operator. In order to be able to use the InfraMot program the spread-sheet program MS-Excel must be installed on the computer. This allows the marked individual values to be transferred directly into an Excel worksheet in order for statistical calculations to be carried out. System components N x sensor units for home cages, one or more control units, a special control interface, and the TSE InfraMot software package. Up to 512 measuring stations can be integrated in a system! Worldwide Phone +49-(0) Fax +49-(0) info@tse-systems.com
")


4 4 One control unit can control 32 sensors; several control units can be combined. The sensor units can be easily removed for cleaning purposes. Other types of attachment are available on request. Preparing the trial Control unit The system runs on a Pentium computer (at least PIII 700MHz) with the Windows operating system (98, NT, 2000 or XP not 95!). When the program has been started the following buttons are available on the main screen: Technical data Now the control parameters have to be entered in the setup: Recording range: Time constant: Recording area: 360 beneath the sensor approx. 5ms i.e. impulses 5ms are detected depends on height of sensor unit Sensor height* Recording area diameter** (cm) (cm) * Distance from lower edge of sensor to field of movement ** The given values are for guidance only If large sensor unit mounting heights are necessary it is possible to increase the sensitivity of the sensor within certain limits. However, a higher sensitivity means that the interference from other heat sources also increases. Please contact us to discuss a suitable configuration. Mounting the sensor unit In the standard configuration the sensor is supplied mounted on a U-shaped stainless steel sheet. This so-called "sensor unit" is normally placed on the metal grid cover of a standard animal cage (home cage) and fixed in position by screwing it onto the cover. The following input fields are available for controlling the trial: 1. Under Number of Counters the number of sensors used in the trial is entered. 2. Under Measuring Interval the scanning rate, i.e. the observation interval for the sensors, is entered. The movement counters are scanned every X minutes. The range is minutes (in steps of 1 minute). Values in seconds can also be entered by placing a negative sign in front of the entered value. 3. The Total Measuring Time can be entered between 0.1 and 720h (0.1 h = 6 minutes). 4. The values obtained during the measurement can be reduced by a certain factor with Factor in order to obtain a better display with high activities or large measuring intervals. A test should be carried out to determine a suitable value. Entries of are possible. USA / Canada / Mexico Phone Fax Toll-Free (USA / CDN): Phone Fax


5 5 5. Time in Columns refers to the arrangement of the data in the Excel table. The values of each counter can be stored in one column or one line. This is particularly useful when carrying out longterm trials, as it allows access to the trial data without interrupting data acquisition. Configuring an Excel sheet In order to guarantee maximum flexibility the measuring values are transferred into the Excel sheet without any additional information. Evaluating the measuring data The table below is an example of a 3-day experiment with rats. The measuring interval is 10 minutes, i.e. the activity counter has been stored every 10 minutes. In order to characterize the measurement you can create any desired sheet with all the necessary labels to fill in animal and experimental identifiers, control parameters etc. and equations. Carrying out a trial Now the EXCEL link has to be established. Clicking on the EXCEL button automatically searches out Excel and starts it. Now simply load the pre-defined Excel sheet and fill in all required descriptive parameters to characterize the following measurement. Extract of the results table Then start the measurement with the START button. 1. The first column gives the clock time, 2. the second column is the time elapsed in minutes since the start of the experiment (added by the user). 3. Columns C, D and E correspond to the measuring values of 3 animals. The animal displayed in column E is more active than the animals displayed in columns C and D. A period of very high-activity is marked with a yellow frame. If formulas and equations for statistical parameters have been added into the Excel sheet (mean value, standard deviation etc.) these parameters are calculated and displayed in real time during the measurement. The measured values are now immediately transferred to the Excel worksheet according to the measuring interval frequency! The graph below has been created in the Excel sheet using the InfraMot measuring values. 3 animals are shown: Animal in column C is shown in blue Animal in column D is shown in pink Animal in column E is shown in yellow Worldwide Phone +49-(0) Fax +49-(0) info@tse-systems.com


6 6 Animal displayed with yellow dots (column E in the table) shows increased activity. Options The results tables created by both systems can be easily combined to output both consumption and activity. The TSE InfraMot sensor units can also be used in conjunction with the TSE Drinking & Feeding Monitor that allows to evaluate liquid and food consumption in home cages. Please contact us for detailed information! USA / Canada / Mexico Phone Fax Toll-Free (USA / CDN): Phone Fax
7 7 Partial List of Users - Abbott Laboratories, Abbott Park, IL, USA - European Molecular Biology Laboratory - EMBL, Monterotondo - Scalo (RM), Italy - Korea Research Institute of Chemical Technology - KRICT, Daejeon, Korea - Novartis Pharma AG, Basel, Switzerland - Physio-Tech Co., Ltd., Tokyo, Japan - The Rowett Research Institute, Aberdeen, Great Britain - University of Aberdeen, Great Britain - University of Athens, GA, USA - University of Berlin, Germany - University of Frankfurt, Germany - University of Innsbruck, Austria - University of Leipzig, Germany - University of Semnan, Iran - University of Tuebingen, Germany - Weizmann Institute of Science, Rehovot, Israel Ordering Information Cat.No. Description 1. Sensor Units SENS InfraMot Infra-red Activity Sensor. The sensor is mounted on top of the cage. It can also be mounted inside the cage. The sensor is connected to the control unit C/X. 2. Control Units Up to 512 infra-red activity sensor units can be integrated into one system. The control unit package comes complete with a PCI interface to be mounted into the computer C/04 InfraMot Control Unit for connection of up to 4 infra-red activity sensors SENS C/08 InfraMot Control Unit for connection of up to 8 infra-red activity sensors SENS C/16 InfraMot Control Unit for connection of up to 16 infra-red activity sensors SENS C/24 InfraMot Control Unit for connection of up to 24 infra-red activity sensors SENS. Worldwide Phone +49-(0) Fax +49-(0) info@tse-systems.com

8 C/32 InfraMot Control Unit for connection of up to 32 infra-red activity sensors SENS. 3. Software S InfraMot Software Package for measuring, storing and evaluating small and large movements in three (3) dimensions via infra-red activity sensors SENS. The software package registrates the total activity in x, y and z-axis, i.e. horizontal and vertical movements are summarized. The program stores the raw data for further evaluation with standard statistic and graphics software. A complete system consists of: 1. N sensor units 2. 1 control unit suited for your number of sensors (including interface board) 3. 1 software package N= Number of measuring places USA / Canada / Mexico Phone Fax Toll-Free (USA / CDN): Phone Fax
TSE Power Meter. for small laboratory animals. No
 TSE Power Meter for small laboratory animals No. 303550 2 Power Meter Tel: +49 (0) 6172-789-0 Fax: +49 (0) 6172-789-500 E-Mail: info@tse-systems.de Internet: www.tse-systems.de Power Meter 3 Contents 1.
PhenoMaster / LabMaster Phenotyping Research Platform
 Operating Instructions PhenoMaster / LabMaster Phenotyping Research Platform SOFTWARE Operating Instructions Calibration Description of Standard Components 2 PhenoMaster/LabMaster Software Operating Instructions
NCSS Statistical Software
 Chapter 147 Introduction A mosaic plot is a graphical display of the cell frequencies of a contingency table in which the area of boxes of the plot are proportional to the cell frequencies of the contingency
Measurement Statistics, Histograms and Trend Plot Analysis Modes
 Measurement Statistics, Histograms and Trend Plot Analysis Modes Using the Tektronix FCA and MCA Series Timer/Counter/Analyzers Application Note How am I supposed to observe signal integrity, jitter or
Laboratory 1: Motion in One Dimension
 Phys 131L Spring 2018 Laboratory 1: Motion in One Dimension Classical physics describes the motion of objects with the fundamental goal of tracking the position of an object as time passes. The simplest
PRODUCT DATA. PULSE Multichannel Sound Power Type 7748 Version 1.2
 PRODUCT DATA PULSE Multichannel Sound Power Type 7748 Version 1.2 Multichannel Sound Power offers the easiest way yet to measure sound power and other important sound characteristics of products according
Resistance Apparatus EM-8812
 Instruction Manual with Experiment Guide and Teachers Notes 012-09573A Resistance Apparatus EM-8812 Resistance Apparatus Table of Contents Contents Introduction...........................................................
Relationship to theory: This activity involves the motion of bodies under constant velocity.
 UNIFORM MOTION Lab format: this lab is a remote lab activity Relationship to theory: This activity involves the motion of bodies under constant velocity. LEARNING OBJECTIVES Read and understand these instructions
Computer Tools for Data Acquisition
 Computer Tools for Data Acquisition Introduction to Capstone You will be using a computer to assist in taking and analyzing data throughout this course. The software, called Capstone, is made specifically
Level Sensors Reed Contact Chain
 Level Sensors Reed Contact Chain measuring monitoring analysing Measuring length: Measuring accuracy: 0.5% for L = 2000 mm Pressure: max. 20 bar Temperature: max. 130 C Connection: G 3 8 to G 2 flange:
Thermo Scientific SPECTRONIC 200 Education
 molecular spectroscopy Thermo Scientific SPECTRONIC 200 Education Part of Thermo Fisher Scientific Designed for the Teaching Laboratory Classroom Friendly Sample Compartment Whether you measure in 10 mm
EDDY CURRENT MEASUREMENT OF REMOTE TUBE POSITIONS IN CANDU REACTORS S.T. Craig, T.W. Krause, B.V. Luloff and J.J. Schankula Atomic Energy of Canada
 EDDY CURRENT MEASUREMENT OF REMOTE TUBE POSITIONS IN CANDU REACTORS S.T. Craig, T.W. Krause, B.V. Luloff and J.J. Schankula Atomic Energy of Canada Limited, Chalk River, Ontario, Canada Abstract: Regular
StereoSTATIKA. Main Features:
 A complete software package for 2D/3D Structural Design of Concrete Frames with advanced RC Details by Apostolos Konstandinides www.pi.gr Main Features: Single, user friendly, visual (2D&3D) input of structural
Thermo Scientific SPECTRONIC 200 Visible Spectrophotometer. The perfect. teaching instrument
 Thermo Scientific SPECTRONIC 200 Visible Spectrophotometer The perfect teaching instrument Designed for the Teaching Laboratory Thermo Scientific SPECTRONIC spectrophotometers have served as core analytical
Keysight Technologies How to Measure 5 ns Rise/Fall Time on an RF Pulsed Power Amplifier Using the 8990B Peak Power Analyzer.
 Keysight Technologies How to Measure 5 ns Rise/Fall Time on an RF Pulsed Power Amplifier Using the 8990B Peak Power Analyzer Application Note Introduction RF IN RF OUT Waveform Generator Pulse Power Amplifier
MicroLab 500-series Getting Started
 MicroLab 500-series Getting Started 2 Contents CHAPTER 1: Getting Started Connecting the Hardware....6 Installing the USB driver......6 Installing the Software.....8 Starting a new Experiment...8 CHAPTER
Thermo Scientific SPECTRONIC 200
 molecular spectroscopy Thermo Scientific SPECTRONIC 200 Part of Thermo Fisher Scientific The New Standard for Routine Measurements Robust, Multifunction Sample Compartment Whether you measure in 10 mm
Experiment P55: Light Intensity vs. Position (Light Sensor, Motion Sensor)
") PASCO scientific Vol. 2 Physics Lab Manual: P55-1 Experiment P55: (Light Sensor, Motion Sensor) Concept Time SW Interface Macintosh file Windows file illuminance 30 m 500/700 P55 Light vs. Position P55_LTVM.SWS
PASCO scientific Vol. 2 Physics Lab Manual: P55-1 Experiment P55: (Light Sensor, Motion Sensor) Concept Time SW Interface Macintosh file Windows file illuminance 30 m 500/700 P55 Light vs. Position P55_LTVM.SWS
4GHz / 6GHz Radiation Measurement System
 4GHz / 6GHz Radiation Measurement System The MegiQ Radiation Measurement System (RMS) is a compact test system that performs 3-axis radiation pattern measurement in non-anechoic spaces. With a frequency
This manual describes the Motion Sensor hardware and the locally written software that interfaces to it.
 Motion Sensor Manual This manual describes the Motion Sensor hardware and the locally written software that interfaces to it. Hardware Our detectors are the Motion Sensor II (Pasco CI-6742). Calling this
Statistics 101: Section L Laboratory 10
 Statistics 101: Section L Laboratory 10 This lab looks at the sampling distribution of the sample proportion pˆ and probabilities associated with sampling from a population with a categorical variable.
SUPER RGB Sensor. Lustre Detection Sensor Head. is newly developed. CZ-V20 Series. It can detect lustre without being affected by colours CZ-V20
 NEW Digital RGB Sensors CZ-V20 Series Lustre Detection Sensor Head CZ-H2 NEW SUPER RGB Sensor Lustre Detection Sensor Head is newly developed Glossy objects Digital RGB Sensor Amplifier CZ-V20 Matt objects
Experiment 10. Diffraction and interference of light
 Experiment 10. Diffraction and interference of light 1. Purpose Perform single slit and Young s double slit experiment by using Laser and computer interface in order to understand diffraction and interference
Keysight Technologies Precise Current Profile Measurements of Bluetooth Low Energy Devices using the CX3300. Application Brief
 Keysight Technologies Precise Current Profile Measurements of Bluetooth Low Energy Devices using the CX3300 Application Brief Introduction New information technology, the Internet of Things (IoT) is changing
LCI. Inductive Conductivity/ Concentration and Temperature Transmitter. Compact or separate version
 Inductive Conductivity/ Concentration and Temperature Transmitter measuring monitoring analysing LCI or separate version Activation of up to four measuring ranges (up to 2000 ms/cm) Concentration measurement
6.1 - Introduction to Periodic Functions
 6.1 - Introduction to Periodic Functions Periodic Functions: Period, Midline, and Amplitude In general: A function f is periodic if its values repeat at regular intervals. Graphically, this means that
MODEL INFORMATION. AccuLoss MODELS ALMS 2100, ALMS 4100, ALMS 4200, ALMS 6200 & ALMS 4300
 AccuLoss MODELS ALMS 2100, ALMS 4100, ALMS 4200, ALMS 6200 & ALMS 4300 The measurement of electric power and energy at high voltages and currents at low power factors is becoming increasingly important
Page 21 GRAPHING OBJECTIVES:
 Page 21 GRAPHING OBJECTIVES: 1. To learn how to present data in graphical form manually (paper-and-pencil) and using computer software. 2. To learn how to interpret graphical data by, a. determining the
University of Tennessee at. Chattanooga
 University of Tennessee at Chattanooga Step Response Engineering 329 By Gold Team: Jason Price Jered Swartz Simon Ionashku 2-3- 2 INTRODUCTION: The purpose of the experiments was to investigate and understand
SPECIFICATION FOR A 7.0 TESLA/400MM ROOM TEMPERATURE BORE MAGNET SYSTEM
 SPECIFICATION FOR A 7.0 TESLA/400MM ROOM TEMPERATURE BORE MAGNET SYSTEM Prepared by:- Magnex Scientific Limited The Magnet Technology Centre 6 Mead Road Oxford Industrial Park Yarnton, Oxford OX5 1QU,
The introduction and background in the previous chapters provided context in
 Chapter 3 3. Eye Tracking Instrumentation 3.1 Overview The introduction and background in the previous chapters provided context in which eye tracking systems have been used to study how people look at
SONOMETER TM 1100 Ultrasonic compact energy meter
 Data sheet SONOMETER TM 1100 Ultrasonic compact energy meter Description/Application MID examination certificate no. : DE-10-MI004-PTB003 The SONOMETER 1100 is an ultrasonic static compact energy meter
Keysight Technologies N6850A Broadband Omnidirectional Antenna. Data Sheet
 Keysight Technologies N6850A Broadband Omnidirectional Antenna Data Sheet 02 Keysight N6850A Broadband Omnidirectional Antenna - Data Sheet Industries and Applications Spectrum monitoring and signal location,
... frequency, f speed, v......
 PhysicsAndMathsTutor.com 1 1. Define the terms wavelength, frequency and speed used to describe a progressive wave. wavelength, λ... frequency, f... speed, v... Hence derive the wave equation v = fλ which
Chromatic X-Ray imaging with a fine pitch CdTe sensor coupled to a large area photon counting pixel ASIC
 Chromatic X-Ray imaging with a fine pitch CdTe sensor coupled to a large area photon counting pixel ASIC R. Bellazzini a,b, G. Spandre a*, A. Brez a, M. Minuti a, M. Pinchera a and P. Mozzo b a INFN Pisa
GCMS-3 GONIOSPECTROPHOTOMETER SYSTEM
 MURAKAMI Color Research Laboratory 11-3 Kachidoki 3-Chome Chuo-Ku Tokyo 104 Japan Tel: +81 3 3532 3011 Fax: +81 3 3532 2056 GCMS-3 GONIOSPECTROPHOTOMETER SYSTEM GSP-1 Main System Overview The colour and
3.2 Measuring Frequency Response Of Low-Pass Filter :
 2.5 Filter Band-Width : In ideal Band-Pass Filters, the band-width is the frequency range in Hz where the magnitude response is at is maximum (or the attenuation is at its minimum) and constant and equal
Sensor Calibration Lab
 Sensor Calibration Lab The lab is organized with an introductory background on calibration and the LED speed sensors. This is followed by three sections describing the three calibration techniques which
Appendix III Graphs in the Introductory Physics Laboratory
 Appendix III Graphs in the Introductory Physics Laboratory 1. Introduction One of the purposes of the introductory physics laboratory is to train the student in the presentation and analysis of experimental
Keysight Technologies
 Keysight Technologies Easily Create Power Supply Output Sequences with Data Logging Application Brief 02 Keysight Easily Create Power Supply Output Sequences with Data Logging - Application Brief Why is
WFS Fork Sensors. Agile and flexible ideal mounting for labeling applications. P r o d u c t I n f o r m at i o n
 P r o d u c t I n f o r m at i o n Fork Sensors Agile and flexible ideal mounting for labeling applications Agile and flexible ideal mounting for labeling applications Product description At a glance Optimized
CLAIRE: Microbiological Safety Cabinet (certified in accordance with DIN12980 and EN12469 and NSF49)
") 1 CLAIRE: Microbiological Safety Cabinet (certified in accordance with DIN12980 and EN12469 and NSF49) 2 Premium Quality: You will never be satisfied with a standard piece of equipment again! "Made in
1 CLAIRE: Microbiological Safety Cabinet (certified in accordance with DIN12980 and EN12469 and NSF49) 2 Premium Quality: You will never be satisfied with a standard piece of equipment again! "Made in
W 160T: With the smallest LED light spot
 W 0T: With the smallest LED light spot BGS Photoelectric proximity switches Photoelectric proximity switches mark sensor Photoelectric proximity switches energetic Photoelectric reflex switches SSystem
Visualizing, recording and analyzing behavior. Viewer
 Visualizing, recording and analyzing behavior Europe: North America: GmbH Koenigswinterer Str. 418 2125 Center Ave., Suite 500 53227 Bonn Fort Lee, New Jersey 07024 Tel.: +49 228 20 160 20 Tel.: 201-302-6083
12.5 Gb/s PatternPro Programmable Pattern Generator PPG1251 Series Datasheet
 12.5 Gb/s PatternPro Programmable Pattern Generator PPG1251 Series Datasheet The Tektronix PPG1251 PatternPro programmable pattern generator provides pattern generation for high-speed Datacom testing.
Using Optics to Optimize Your Machine Vision Application
 Expert Guide Using Optics to Optimize Your Machine Vision Application Introduction The lens is responsible for creating sufficient image quality to enable the vision system to extract the desired information
12 Projectile Motion 12 - Page 1 of 9. Projectile Motion
 12 Projectile Motion 12 - Page 1 of 9 Equipment Projectile Motion 1 Mini Launcher ME-6825A 2 Photogate ME-9498A 1 Photogate Bracket ME-6821A 1 Time of Flight ME-6810 1 Table Clamp ME-9472 1 Rod Base ME-8735
Peak Detection with the Model 2001 DMM
 Application Note Series Number 601 Peak Detection with the Model 2001 DMM Introduction Keithley Instruments Model 2001 Digital Multimeter offers a variety of functions not available in any other DMM. These
Graphing Techniques. Figure 1. c 2011 Advanced Instructional Systems, Inc. and the University of North Carolina 1
 Graphing Techniques The construction of graphs is a very important technique in experimental physics. Graphs provide a compact and efficient way of displaying the functional relationship between two experimental
AUTOMATIC LEVEL CROSSING WITH REAL SOUND FOR 2 GATES/BARRIERS LCS6B
 AUTOMATIC LEVEL CROSSING WITH REAL SOUND FOR 2 GATES/BARRIERS LCS6B Fully Flexible Controller with Sound and Servo Motors for Barriers or Gates Automatically detects traction current drawn by scale model
Physics 131 Lab 1: ONE-DIMENSIONAL MOTION
 1 Name Date Partner(s) Physics 131 Lab 1: ONE-DIMENSIONAL MOTION OBJECTIVES To familiarize yourself with motion detector hardware. To explore how simple motions are represented on a displacement-time graph.
MODEL INFORMATION. MODEL AccuLoss ALMS 1058, 2058 and Capabilities. Measurements
 MODEL AccuLoss ALMS 1058, 2058 and 4058 The measurement of electric power and energy at high voltages and currents at low power factors is becoming increasingly important economically as a way to reduce
Demonstration of a Ferrimagnetic Ceramic Application for Position Sensor Using a Visual Basic-based Measurement System
 Demonstration of a Ferrimagnetic Ceramic Application for Position Sensor Using a Visual Basic-based Measurement System Thongchai Panmatarith and Sudarat Innoi Materials Physics Laboratory, Department of
XI. Rotary Attachment Setups
 XI. Rotary Attachment Setups 1) Turn off the laser. 2) Put the rotary attachment onto the engraving table. Ensure the two screw holes on right side of rotary attachment match the two corresponding holes
KickStart Instrument Control Software Datasheet
 KickStart Instrument Control Software Datasheet Key Features Built-in I-V characterizer, datalogger, and precision DC power applications Optional high resistivity measurement application that complies
Copies of the Color by Pixel template sheets (included in the Resources section). Colored pencils, crayons, markers, or other supplies for coloring.
. Colored pencils, crayons, markers, or other supplies for coloring.") This offline lesson plan covers the basics of computer graphics. After learning about how graphics work, students will create their own Color by Pixel programs. The lesson plan consists of four parts,
This offline lesson plan covers the basics of computer graphics. After learning about how graphics work, students will create their own Color by Pixel programs. The lesson plan consists of four parts,
Visual Triggering. Technical Brief
 Visual Triggering Technical Brief Capturing and finding the right characteristic of a complex signal can require hours of collecting and sorting through thousands of acquisitions for the event of interest.
CHAPTER 2. v-t CHARACTERISTICS FOR STANDARD IMPULSE VOLTAGES
 23 CHAPTER 2 v-t CHARACTERISTICS FOR STANDARD IMPULSE VOLTAGES 2.1 INTRODUCTION For reliable design of power system, proper insulation coordination among the power system equipment is necessary. Insulation
Supplementary Figure 1
 Supplementary Figure 1 Technical overview drawing of the Roadrunner goniometer. The goniometer consists of three main components: an inline sample-viewing microscope, a high-precision scanning unit for
Time and Frequency Measurements for Oscillator Manufacturers
 Time and Frequency Measurements for Oscillator Manufacturers Using the FCA3000 and FCA3100 Series Timer/Counter/Analyzers Application Note Application Note Introduction Designing and manufacturing oscillators
Charge-Sensing Particle Detector PN 2-CB-CDB-PCB
 Charge-Sensing Particle Detector PN 2-CB-CDB-PCB-001-011 Introduction The charge-sensing particle detector (CSPD, Figure 1) is a highly charge-sensitive device intended to detect molecular ions directly.
Excel Tool: Plots of Data Sets
 Excel Tool: Plots of Data Sets Excel makes it very easy for the scientist to visualize a data set. In this assignment, we learn how to produce various plots of data sets. Open a new Excel workbook, and
Keysight Technologies Essential Capabilities of EMI Receivers. Application Note
 Keysight Technologies Essential Capabilities of EMI Receivers Application Note Contents Introduction... 3 CISPR 16-1-1 Compliance... 3 MIL-STD-461 Compliance... 4 Important features not required by CISPR
KDS. All Metal Variable Area Flowmeter. for Liquids and Gases
 All Metal Variable Area Flowmeter for Liquids and Gases measuring monitoring analysing : 0.1-1... 20-200 water 3-30 Nm3/h... 600-6000 Accuracy: ±3 % of full p max : 420 bar; t max : 130 C Connection: ¼"
Keysight Technologies Understanding the Importance of Maximum Power Point Tracking Efficiency for Solar Inverters.
 Keysight Technologies Understanding the Importance of Maximum Power Point Tracking Efficiency for Solar Inverters Application Note 02 Keysight Understanding the Importance of Maximum Power Point Tracking
30 A AC/DC Current Probe TCP0030A Datasheet
 30 A AC/DC Current Probe TCP0030A Datasheet Split-core construction allows easy circuit connection High accuracy with typically less than 1% DC gain error Low noise and DC drift 3rd party safety certification
Passive High Voltage Probes P5100A-TPP0850-P5122-P5150-P6015A Datasheet
 Passive High Voltage Probes P5100A-TPP0850-P5122-P5150-P6015A Datasheet P5150 DC to 500 MHz 2500 V Peak, 1000 V RMS CAT II 50 X Floatable up to 600 V RMS CAT II or 300 V RMS CAT III For TPS2000 and THS3000
Thermo Scientific SPECTRONIC 200 Visible Spectrophotometer. The perfect tool. for routine measurements
 Thermo Scientific SPECTRONIC 200 Visible Spectrophotometer The perfect tool for routine measurements The Standard for Routine Measurements Thermo Scientific SPECTRONIC spectrophotometers have served as
Harmonic Current emission EN :2014 Class A Pass. Voltage Fluctuation and Flicker EN :2013 Clause 5 Pass
 Reference No.: WTS15F0323845E Page 2 of 33 1 Test Summary Test Item Mains Terminal Disturbance Voltage, 148.5kHz to 30MHz Disturbance Power, 30MHz to 300MHz Discontinuous Disturbance (Click) Radiated Emission,
Through-beam ring sensors
 Throughbeam ring sensors Features Wide range of sizes: ring diameters of 10, 15 and 20 mm Metal housings Separate evaluation unit Connection by means of S8 connector Degree of protection IP 63 Adjustable
Graphing Guidelines. Controlled variables refers to all the things that remain the same during the entire experiment.
 Graphing Graphing Guidelines Graphs must be neatly drawn using a straight edge and pencil. Use the x-axis for the manipulated variable and the y-axis for the responding variable. Manipulated Variable AKA
Free vibration of cantilever beam FREE VIBRATION OF CANTILEVER BEAM PROCEDURE
 FREE VIBRATION OF CANTILEVER BEAM PROCEDURE AIM Determine the damped natural frequency, logarithmic decrement and damping ratio of a given system from the free vibration response Calculate the mass of
EMC Test Report. Report Number: M030826
 Page 1 of 36 EMC Technologies Pty Ltd ABN 82 057 105 549 57 Assembly Drive Tullamarine Victoria Australia 3043 Ph: + 613 9335 3333 Fax: + 613 9338 9260 email: melb@emctech.com.au EMC Test Report Report
Keysight Technologies How to Take Fast, Simultaneous Measurements of Two or More Signals Using BenchVue Software. Application Note
 Keysight Technologies How to Take Fast, Simultaneous Measurements of Two or More Signals Using BenchVue Software Application Note 02 Keysight How to Take Fast, Simultaneous Measurements of Two or More
Frame through-beam sensors
 Frame through-beam sensors Features Wide range of sizes: passage sizes from 25 x 23 mm to 300 x 397.5 mm Metal housings Integrated evaluation unit Connection by means of connector Degree of protection
Keysight Technologies
 Keysight Technologies Easily Create Power Supply Output Sequences with Data Logging Application Brief 02 Keysight Easily Create Power Supply Output Sequences with Data Logging - Application Brief Why is
EDS-400A COMPACT RECORDER. New KYOWA ELECTRONIC INSTRUMENTS CO., LTD.
 KYOWA ELECTRONIC INSTRUMENTS CO., LTD. COMPACT RECORDER EDS-400A Compact Dynamic Strain Recorder Entering the scene in advanced measurement of strain, vibration, pressure, load, etc. New www.kyowa-ei.co.jp
Advanced Test Equipment Rentals ATEC (2832)
") Established 1981 Advanced Test Equipment Rentals www.atecorp.com 800-404-ATEC (2832) Electric and Magnetic Field Measurement For Isotropic Measurement of Magnetic and Electric Fields Evaluation of Field
Established 1981 Advanced Test Equipment Rentals www.atecorp.com 800-404-ATEC (2832) Electric and Magnetic Field Measurement For Isotropic Measurement of Magnetic and Electric Fields Evaluation of Field
An Activity in Computed Tomography
 Pre-lab Discussion An Activity in Computed Tomography X-rays X-rays are high energy electromagnetic radiation with wavelengths smaller than those in the visible spectrum (0.01-10nm and 4000-800nm respectively).
SONOMETER TM 1100 Ultrasonic compact energy meter
 Data sheet SONOMETER TM 1100 Ultrasonic compact energy meter Description/Application MID examination certificate no. : DE-10-MI004-PTB003 The SONOMETER 1100 is an ultrasonic static compact energy meter
Programmable Pulse Generators PSPL10050A, PSPL10060A, PSPL10070A Datasheet
 Programmable Pulse Generators PSPL10050A, PSPL10060A, PSPL10070A Datasheet Applications University education and research UWB signal source Semiconductor characterization Laser driver The PSPL10000 Series
An Activity in Computed Tomography
 Pre-lab Discussion An Activity in Computed Tomography X-rays X-rays are high energy electromagnetic radiation with wavelengths smaller than those in the visible spectrum (0.01-10nm and 4000-800nm respectively).
Evaluation of laser-based active thermography for the inspection of optoelectronic devices
 More info about this article: http://www.ndt.net/?id=15849 Evaluation of laser-based active thermography for the inspection of optoelectronic devices by E. Kollorz, M. Boehnel, S. Mohr, W. Holub, U. Hassler
MiniCoder GEL 2444T Sensor with square-wave signals and internal interpolation
 MiniCoder GEL 2444T Sensor with square-wave signals and internal interpolation Technical Information Version 2. General The measuring unit consists of a sensor and a precision target wheel for mounting
Mayer Tunnel Lighting Control System
 Mayer Tunnel Lighting Control System About us: TLA Controls Ltd is an independent UK company which manufactures and distributes the Mayer Tunnel Lighting Control System. This system provides automatic
Physics 253 Fundamental Physics Mechanic, September 9, Lab #2 Plotting with Excel: The Air Slide
 1 NORTHERN ILLINOIS UNIVERSITY PHYSICS DEPARTMENT Physics 253 Fundamental Physics Mechanic, September 9, 2010 Lab #2 Plotting with Excel: The Air Slide Lab Write-up Due: Thurs., September 16, 2010 Place
BME/ISE 3511 Laboratory One - Laboratory Equipment for Measurement. Introduction to biomedical electronic laboratory instrumentation and measurements.
 BME/ISE 3511 Laboratory One - Laboratory Equipment for Measurement Learning Objectives: Introduction to biomedical electronic laboratory instrumentation and measurements. Supplies and Components: Breadboard
Operating instructions Diffuse reflection sensor with background suppression. OJ51xx laser / / 2010
 Operating instructions Diffuse reflection sensor with background suppression OJ51xx laser 704811 / 00 05 / 2010 Contents 1 Preliminary note3 1.1 Symbols used 3 2 Safety instructions 3 3 Functions and features
Measuring Distance Using Sound
 Measuring Distance Using Sound Distance can be measured in various ways: directly, using a ruler or measuring tape, or indirectly, using radio or sound waves. The indirect method measures another variable
BRIDLE & STILLING WELL LEVEL MEASUREMENT. FEATURING THE VEGAflex 60 SERIES
 BRIDLE & STILLING WELL LEVEL MEASUREMENT FEATURING THE VEGAflex 60 SERIES PIPE MEASUREMENT WHY USE GUIDED MICROWAVE? Level measurement that requires using a pipe comes with a set of conditions that can
Wind Direction Transmitter - compact - with serial output x0.x00
 THE WORLD OF WEATHER DATA - THE WORLD OF WEATHER DATA - THE WORLD OF WEATHER DATA Instruction for Use 021450/11/05 Wind Direction Transmitter - compact - with serial output - 4.3129.x0.x00 ADOLF THIES
Keysight Technologies E1834E/G/J/M/Z Mounted Beam Delivery Optics. Preliminary Data Sheet
 Keysight Technologies E1834E/G/J/M/Z Mounted Beam Delivery Optics Preliminary Data Sheet The Keysight Technologies, Inc. E1834 family of beam delivery optics uses high performance mounts to meet the pointing
Thorough Small Angle X-ray Scattering analysis of the instability of liquid micro-jets in air
 Supplementary Information Thorough Small Angle X-ray Scattering analysis of the instability of liquid micro-jets in air Benedetta Marmiroli a *, Fernando Cacho-Nerin a, Barbara Sartori a, Javier Pérez
Capacitive levels controllers
 Capacitive levels controllers for automatic control, regulation and signalling of levels of conductive and non-conductive liquids or pourable bulk goods Jola Spezialschalter GmbH & Co. KG Klostergartenstr.
Lab 1. Motion in a Straight Line
 Lab 1. Motion in a Straight Line Goals To understand how position, velocity, and acceleration are related. To understand how to interpret the signed (+, ) of velocity and acceleration. To understand how
Bohunt School (Wokingham) Internet of Things (IoT) and Node-RED
 Internet of Things (IoT) and Node-RED") This practical session should be a bit of fun for you. It involves creating a distance sensor node using the SRF05 ultrasonic device. How the SRF05 works Here s a photo of the SRF05. The silver metal cans
This practical session should be a bit of fun for you. It involves creating a distance sensor node using the SRF05 ultrasonic device. How the SRF05 works Here s a photo of the SRF05. The silver metal cans
Momentum and Impulse. Objective. Theory. Investigate the relationship between impulse and momentum.
 [For International Campus Lab ONLY] Objective Investigate the relationship between impulse and momentum. Theory ----------------------------- Reference -------------------------- Young & Freedman, University
V 18 Laser No frills performance: long ranges, high speeds with precision
 V 8 Laser No frills performance: long ranges, high speeds with precision VTE 8 L photoelectric proximity switches: energetic type, scr. 00 mm (90 % remission). Additional standard features: very short
PASS Sample Size Software
 Chapter 945 Introduction This section describes the options that are available for the appearance of a histogram. A set of all these options can be stored as a template file which can be retrieved later.
sensors ISSN
 Sensors,, 7-; DOI: 1.9/s17 Article OPEN ACCESS sensors ISSN 1- www.mdpi.com/journal/sensors Measurements of Impedance and Attenuation at CENELEC Bands for Power Line Communications Systems I. Hakki Cavdar