FINOLEX INDUSTRIES LIMITED Q4FY18 RESULTS
|
|
|
- Jane Osborne
- 5 years ago
- Views:
Transcription


1 FINOLEX INDUSTRIES LIMITED Q4FY18 RESULTS
2 Business Performance Q4FY18 * Including inter segment transfer 2
3 Trend in Key Ratios FY Gross Debt (INR Mn) EBITDA Margin* % 16.7% 16.2% 16.3% 21.6% 17.7% % 8.5% FY11 FY12 FY13 FY14 FY15 FY16 FY17 FY18 FY11 FY12 FY13 FY14 FY15 FY16 FY17 FY Debt/Equity (x) FY11 FY12 FY13 FY14 FY15 FY16 FY17 FY18 *Standalone EBITDA Margin (EBITDA before Exceptional item and other income) 3
 Volumes (MT)")
 (INR Mn) EBITDA (INR Mn) PAT (INR Mn) Notes:")

4 Q4FY18 and FY18 Results Summary 20.4% Pipes and Fittings volume growth (FY18 over FY17) Volumes (MT) Pipes & Fittings Volumes (MT) PVC Resin * Revenue (excl. duties and taxes) (INR Mn) EBITDA (INR Mn) PAT (INR Mn) Notes: Results for the quarter are better compared to the last three quarters mainly on account of rise in PVC resin prices by around 10% during * Including inter segment transfer the quarter. 4
5 Profit & Loss Account Q4FY18 Particulars (INR Mn) Q4FY18 Q4FY17 Total Income from operations * 8,091 8,876 EBIDTA 1,879 1, 785 EBIDTA margin (%) 23.22% 20.11% Depreciation EBIT 1,723 1,646 EBIT % 21.30% 18.54% Other Income Finance costs PBT 1,717 1,729 PBT % 21.22% 19.48% Tax PAT 1,209 1,233 PAT % 14.94% 13.89% * excluding duties and taxes 5
6 Profit & Loss Account - FY18 Particulars (INR Mn) FY18 FY17 Total Income from operations * ,024 EBIDTA 4,839 5,630 EBIDTA margin (%) 17.67% 21.63% Depreciation EBIT 4,233 5,080 EBIT % 15.46% 19.52% Other Income Finance costs PBT 4,388 5,170 PBT % 16.03% 19.87% Tax 1,403 1,648 PAT 2,985 3,522 PAT % 10.90% 13.53% * excluding duties and taxes 6
7 EBITDA Bridge Chart Q4FY18 (INR Mn) 1,879 1,785 IND AS 1,153 EBIDTA Q4FY17 Sales Cost of material consumed Employee benefit expenses Other expenses EBIDTA Q4FY
8 Oct-15 Nov-15 Dec-15 Jan-16 Feb-16 Mar-16 Apr-16 May-16 Jun-16 Jul-16 Aug-16 Sep-16 Oct-16 Nov-16 Dec-16 Jan-17 Feb-17 Mar-17 Apr-17 May-17 Jun-17 Jul-17 Aug-17 Sep-17 Oct-17 Nov-17 Dec-17 Jan-18 Feb-18 Mar-18 Source: Platts Polymerscan weekly reports Oct-15 Nov-15 Dec-15 Jan-16 Feb-16 Mar-16 Apr-16 May-16 Jun-16 Jul-16 Aug-16 Sep-16 Oct-16 Nov-16 Dec-16 Jan-17 Feb-17 Mar-17 Apr-17 May-17 Jun-17 Jul-17 Aug-17 Sep-17 Oct-17 Nov-17 Dec-17 Jan-18 Feb-18 Mar-18 Business Performance Trends Q4FY16 Q1FY17 Q2FY17 Q3FY17 Q4FY17 Q1FY18 Q2FY18 Q3FY18 Q4FY18 Pipes & Fittings Volumes (MT) 900 PVC (USD/MT) Q4FY16 Q1FY17 Q2FY17 Q3FY17 Q4FY17 Q1FY18 Q2FY18 Q3FY18 Q4FY PVC Volumes (MT) PVC/EDC Delta (USD/MT) 8
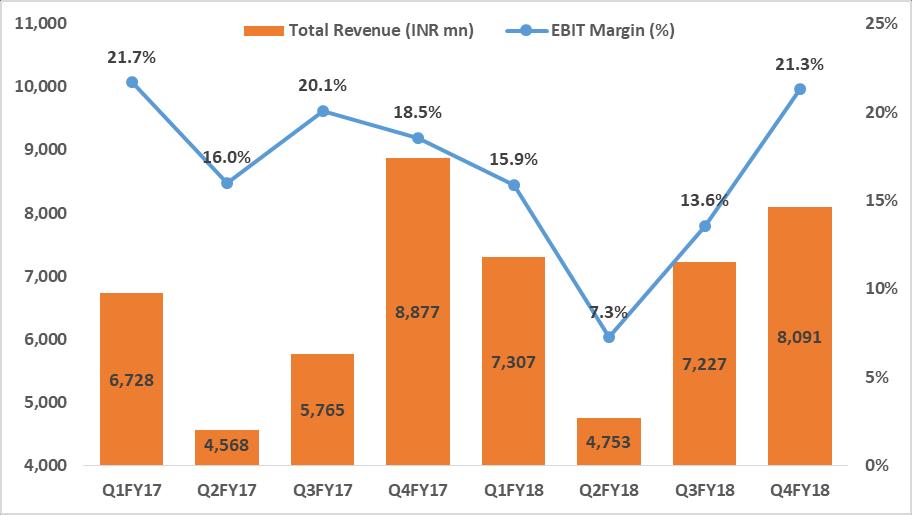
9 Quarterly - Profit & Loss Particulars (INR Mn) Q1FY17 Q2FY17 Q3FY17 Q4FY17 Q1FY18 Q2FY18 Q3FY18 Q4FY18 Total income from operations * 6,728 4,568 5,765 8,877 7,307 4,753 7,227 8,091 EBIDTA 1, ,296 1,785 1, ,133 1,879 EBIDTA margins (%) 23.7% 19.0% 22.5% 20.1% 17.9% 10.4% 15.7% 23.2% Depreciation Other Income Finance costs (4) 34 PBT 1, ,126 1,729 1, ,086 1,717 PBT margins (%) 21.4% 17.3% 19.5% 19.5% 16.0% 8.8% 15.0% 21.2% Tax PAT , ,209 EPS * excluding duties and taxes 9
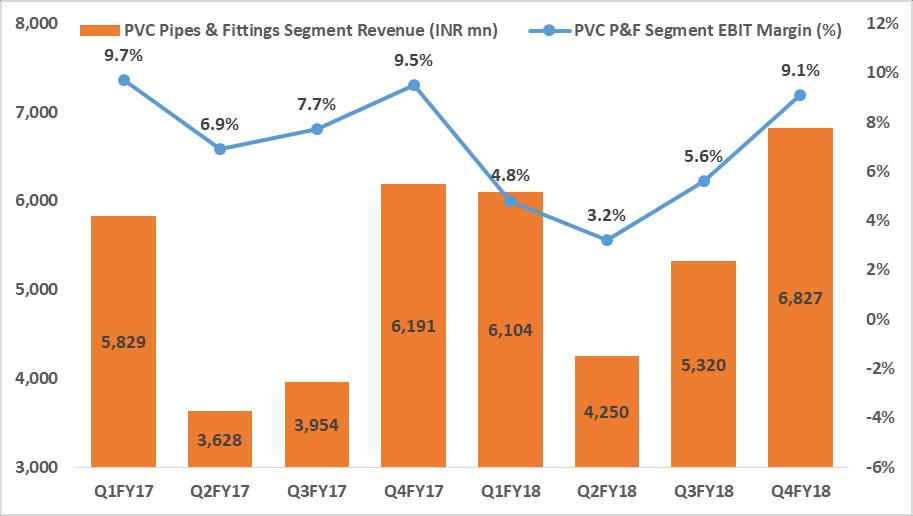
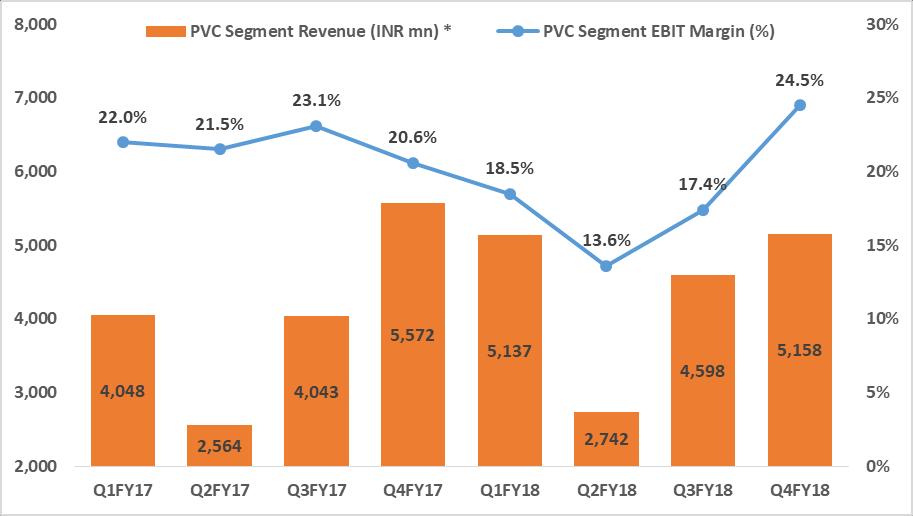
10 Quarterly segmental - Profit & Loss Particulars (INR Mn) Q1FY17 Q2FY17 Q3FY17 Q4FY17 Q1FY18 Q2FY18 Q3FY18 Q4FY18 Segmental revenues * PVC 4,048 2,564 4,043 5,572 5,137 2,742 4,598 5,158 PVC pipes & fittings 5,829 3,628 3,954 6,191 6,104 4,250 5,320 6,827 Power Segmental profits PVC , ,263 % of Revenues 22.0% 21.5% 23.1% 20.6% 18.5% 13.6% 17.4% 24.5% PVC pipes & fittings % of Revenues 9.7% 6.9% 7.7% 9.5% 4.8% 3.2% 5.6% 9.1% Power (7) % of Revenues 33.3% 18.1% 22.8% 15.5% 13.1% (2.7%) 5.3% 3.7% Capital employed PVC 5,214 5,056 6,354 5,623 5,660 4,007 3,858 5,239 PVC pipes & fittings 5,210 5,218 5,860 5,683 5,449 5,939 5,946 6,690 Power 2,674 2,374 2,375 2,170 2,328 2,138 2,124 2,161 *excluding duties and taxes 10
11 Profit & Loss - Key Indicators Profit & loss account (INR Mn) FY13 FY14 FY15 FY16* FY17* FY18* Revenue from Operations (excl. excise duty) 21,448 24,531 24,762 24,819 26,024 27,378 Growth in sales (YoY %) 2.15% 14.37% 0.94% 0.23% 4.85% 5.20% EBIDTA before exceptional items 3,587 3,966 2,111 4,044 5,630 4,839 EBIDTA margins before exceptional items (%) 16.72% 16.17% 8.53% 16.29% 21.63% 17.67% EBIDTA after exceptional items 2,626 3,268 1,896 4,289 5,630 4,839 PBT 1,902 2, ,733 5,170 4,388 PBT Margin (%) 8.87% 9.86% 3.26% 15.04% 19.87% 16.03% PAT 1,361 1, ,544 3,522 2,985 PAT Margin (%) 6.35% 6.93% 1.93% 10.25% 13.53% 10.90% *Figures as per IndAS 11
12 Balance sheet - Key Indicators Balance Sheet (INR Mn) FY12 FY13 FY14 FY15 FY16* FY17* FY18* Equity and liabilities Share capital 1,241 1,241 1,241 1,241 1,241 1,241 1,241 Reserves and surplus 5,381 5,971 6,656 6,633 14,458 21,673 26,405 Long term borrowings 1,896 1,397 2,322 1, Short term borrowings (incl. loans repayable in one year) 8,528 6,997 4,812 4,534 1, ,007 Total borrowings 10,424 8,394 7,134 6,371 1, ,007 Assets Fixed assets (Net block) 7,840 8,795 9,052 8,678 8,496 8,551 8,842 Capital WIP Non current investments 1,221 1,274 1,274 1,246 6,485 11,656 14,896 Current investments 3,711 2, , *Figures as per IndAS 12


13 Key Strategies EXPANDING FOOTPRINT CAPACITY EXPANSION CASH-N-CARRY BRANDING Expand distribution network in all geographies with higher focus in the northern and eastern regions Increase installed capacities of PVC pipes and fittings in order to capture expected increase in demand. Follow Cash-n-carry model to keep the balance sheet light. Promote brand and quality consciousness amongst consumer. 13

 a project of Rs. 2,300 crores to be undertaken. Irrigation projects of Rs.")
14 Opportunities Agriculture sector continues to be thrust area Total allocation for Rural, Agriculture sector is Rs lakh crore. Institutional credit for agriculture sector raised to Rs. 11 lakh crore for Scope of Long Term Irrigation Fund to be expanded to cover specified command area development projects. An Agri- Market Infrastructure Fund with a corpus of Rs. 2,000 crore to be set up for developing and upgrading agricultural marketing infrastructure. Under the Pradhan Mantri Krishi Sinchai Yojana, 48 AIBP priority projects of Rs. 15,000 crore to be completed by December 2019 and utilisation of irrigation potential of 15 lakh hectares (har khet ko pani) a project of Rs. 2,300 crores to be undertaken. Irrigation projects of Rs. 4,000 crore covering 17.2 lakh hectares to be implemented Niti Ayog, in consultation with Central and State Governments, will put in place a fool proof mechanism so that farmers to get adequate price for their produce. Extend facility of Kisan Credit cards to farmers to help them meet their working capital needs. Small and marginal farmers to benefit, 14


15 Opportunities - Non - Agriculture sector i.e. housing and infrastructure also continues to be thrust area Under the Prime Minister Awas Scheme it is proposed to complete construction of one crore houses by 2019 in the rural areas. In urban areas 37 lakh houses has been sanctioned for construction. A dedicated Affordable Housing Fund in NHB to be established. Smart Cities Mission to build 100 smart cities with state-of-art amenities and the AMRUT program to During the year, the Company tied-up with the American company Lubrizol Corporation, inventors and the largest manufacturers of the CPVC compound worldwide. The tie-up will strengthen the Company s track record of providing superior products for the domestic market. The products have been highly appreciated and has brought renewed interest among the existing and new dealers. Swachh Bharat Mission (Gramin) has benefited all. Sanitation coverage in rural India has increased and government is focussed on covering a wider area.


16 Distribution reach Offices, Works and Warehouses FIL is on track in terms of expanding its scale of operations by increasing production capacity and distribution reach Wide network of 18,000 retail touch points Delhi Masar Indore Cu ack Pune Ratnagiri Urse Corporate Office at Pune Works Warehouse Branch Office 16


 and fetched a cumulative social")


17 Branding & advertisements in Q4FY18 some snapshots FIL was the Presenting Sponsor at NDTV Property Awards with exclusive branding rights for on-ground, outdoor, television and social media Felicitation of Mr. Saurabh Dhanorkar at the Brand Vision Summit in Mumbai. The 2- episode series was covered on Times Now News Channel and also featured interviews of senior management focusing on growth philosophy of FIL FIL was the proud sponsor of south pop star Antony Dasan s music video. The video was launched on Sony Music s south channel (digital) and fetched a cumulative social media reach of 13 Lakhs views FIL merchandise store launch on corporate website along with the new Summer Splash collection. Since launch more than 100 orders from channel partners and employees have been catered to FIL was special event partner at Arijit Singh show that took place at 5 metro cities across India. FIL invited 600+ top MEP consultants, builders, dealers and architects to the event as a relationship building initiative


18 Branding & advertisements in Q4FY18 some snapshots Festive greetings to channel partners and employees Participation in Agri Expo 2018 at Baramati, Pune Participation in Constro 2018 International Fair at Agricultural Ground, Pune Participation at ISH India - International trade fair for plumbing, sanitation, bathroom & kitchen, renewable energy and home automation systems held in Bengaluru


19 MMF activities in Q4FY18 some snapshots FIL was awarded in the prestigious category of Best CSR Practices and Sustainability at the ET NOW World CSR Day Awards event in Mumbai FIL and Sassoon Hospital, Pune alongside Concern for Mental Health organised a 2 day workshop for physicians, psychologists, nurses, special teachers, health visitors, primary school teachers and other mental health care professionals FIL and MMF partnered with Sassoon Hospital, Pune to upgrade the Endoscopy unit and inaugurated the Gastroenterology unit FIL and MMF with the support of Kherwadi Social Welfare Association inaugurated 50 toilets and funded 50 beneficiaries with solar lights at Sonale village at Palghar district


20 Accolades and awards Finolex Pipes and Mukul Madhav Foundation was recently awarded Best CSR Integrated Business under National Excellence for CSR and Sustainability at the National CSR Leadership Congress & Awards held in Bengaluru, September Recently Awarded with The Supply Chain Enterprise Icon of the Year 2017 by Global Logistics Excellence Awards. The National Record certificate by The Limca Book of Records for conducting the largest number of plumbers meets organised simultaneously across 26 states and 58 cities on 11 March, Global CSR Excellence & Leadership Award at the 5th edition of Blue Dart World CSR day initiative. India s most Trusted Brand in the category Manufacturing Pipes awarded by Brand Trust Report
21 Shareholding Pattern as on March 31, 2018 Others Promoters 34.63% 52.47% Foreign Portfolio Investors 4.36% 4.02% 8.54% Mutual Funds 21


")
22 Agri Pipes and Fittings Column Pipes Casing Pipes ASTM Pipes and Fittings CPVC Pipes and Fittings Sewerage Pipes Solvent Cement SAFE HARBOR STATEMENT: No part of this presentation is to be circulated, quoted, or reproduced for any distribution without prior written approval from Finolex Industries Limited, Chinchwad, Pune , India. Certain part of this presentation describing estimates, objectives and projections may be a forward looking statement within the meaning of applicable laws and regulations. Actual results might differ materially from those either expressed or implied. FINOLEX INDUSTRIES LIMITED Mr. S. Krishnamoorthy (GM - Accounts & Finance) sk@finolexind.com D-1/10, M.I.D.C. Chinchwad, Pune
23 Finolex Industries Ltd. Volume Data Sr. No. Particulars Q1FY16 Q2FY16 Q3FY16 Q4FY16 Q1FY17 Q2FY17 Q3FY17 Q4FY17 Q1FY18 Q2FY18 Q3FY18 Q4FY18 1 Production in MT a PVC Resin 60,048 38,815 67,892 80,147 59,756 40,937 83,266 67,143 63,805 34,528 81,839 82,672 b PVC pipes & fittings 57,129 41,801 45,089 63,144 66,693 40,416 44,844 57,071 74,054 52,672 61,887 71,774 2 Sales in MT a PVC Resin External 17,866 17,535 29,952 41,418 12,751 13,080 25,281 36,124 15,725 6,494 27,967 17,126 PVC Resin Inhouse 45,164 23,977 30,590 41,675 49,684 26,822 30,945 40,417 59,273 34,045 43,140 54,997 Total PVC 63,030 41,512 60,542 83,093 62,435 39,902 56,226 76,541 74,998 40,539 71,107 72,123 b PVC Pipes 54,451 37,194 39,163 63,387 62,255 34,218 37,652 59,865 68,171 43,032 56,842 66,753 c PVC Fittings 3,487 3,494 3,282 4,306 3,870 4,048 3,314 4,117 3,347 4,214 4,672 5,005 Total Pipes and Fittings 57,938 40,688 42,445 67,693 66,125 38,266 40,966 63,982 71,518 47,246 61,514 71,758 In MWH 1 Power generated ,243 46,909 55,710 53,640 57,999 36,277 56,559 57,912
Q4 & FY18 PERFORMANCE HIGHLIGHTS JUNE 2018
 Q4 & FY18 PERFORMANCE HIGHLIGHTS JUNE 2018 Index Result Highlights 3 Operational Metrics 7 Financial Summary 10 New product offerings 14 Awards & Accolades 17 Annexure 19 Safe Harbour Statement The documents
Bayport Securitisation (RF) Ltd Investor Report February 2013
 Ltd Investor Report February 2013") Bayport Securitisation (RF) Ltd Investor Report February 2013 Financial statistics for the period ended February 2013 Feb 13 Jan 13 Dec 12 Nov 12 Oct 12 Sep 12 Aug 12 Jul 12 Jun 12 May 12 Apr 12 Mar 12
Bayport Securitisation (RF) Ltd Investor Report February 2013 Financial statistics for the period ended February 2013 Feb 13 Jan 13 Dec 12 Nov 12 Oct 12 Sep 12 Aug 12 Jul 12 Jun 12 May 12 Apr 12 Mar 12
Bayport Securitisation (RF) Ltd Investor Report May 2013
 Ltd Investor Report May 2013") Bayport Securitisation (RF) Ltd Investor Report May 2013 Financial statistics for the period ended May 2013 May 13 Apr 13 Mar 13 Feb 13 Jan 13 Dec 12 Nov 12 Oct 12 Sep 12 Aug 12 Jul 12 Jun 12 Performance
Bayport Securitisation (RF) Ltd Investor Report May 2013 Financial statistics for the period ended May 2013 May 13 Apr 13 Mar 13 Feb 13 Jan 13 Dec 12 Nov 12 Oct 12 Sep 12 Aug 12 Jul 12 Jun 12 Performance
BAYPORT SECURITISATION (RF) LTD INVESTOR REPORT DECEMBER 2014
 LTD INVESTOR REPORT DECEMBER 2014") BAYPORT SECURITISATION (RF) LTD INVESTOR REPORT DECEMBER 2014 Financial statistics for the period ended December 2014 Dec 14 Nov 14 Oct 14 Sept 14 Aug 14 Jul 14 Jun 14 May 14 Apr 14 Mar 14 Feb 14 Jan 14
BAYPORT SECURITISATION (RF) LTD INVESTOR REPORT DECEMBER 2014 Financial statistics for the period ended December 2014 Dec 14 Nov 14 Oct 14 Sept 14 Aug 14 Jul 14 Jun 14 May 14 Apr 14 Mar 14 Feb 14 Jan 14
Ltd.) is India s leading manufacturer of PVC-U Pipes & Fittings. Our pipes & fittings are available in a vast range of sizes.
 is India s leading manufacturer of PVC-U Pipes & Fittings. Our pipes & fittings are available in a vast range of sizes.") +91-8042952415 Finolex Pipes & Fittings (Unit Of Finolex Industries Limited) https://www.indiamart.com/finolex-pipes-fittings/ Finolex Pipes & Fittings (Unit Of Finolex Industries Ltd.) is India s leading
+91-8042952415 Finolex Pipes & Fittings (Unit Of Finolex Industries Limited) https://www.indiamart.com/finolex-pipes-fittings/ Finolex Pipes & Fittings (Unit Of Finolex Industries Ltd.) is India s leading
Lupin Limited Annual Results FY12. Investor Presentation May being
 Lupin Limited Annual Results FY12 Investor Presentation May 2012 Vision: To be an innovation led transnational company Journey over the last decade 5th largest generics player in US Gross Revenues INR
LUPIN LIMITED Q3FY17 Investor Presentation February 09, 2017
 LUPIN LIMITED Investor Presentation February 09, 2017 Safe Harbor Statement Materials and information provided during this presentation may contain forward-looking statements. These statements are based
Interim Report January March
 Report on 1996 Operations 97 Interim Report January March Continued stable earnings during first quarter of 1997. Higher operating income despite modest decline in sales. Decline in cigarette sales in
LUPIN LIMITED. Q2 FY18 Investor Presentation. October 30, 2017
 LUPIN LIMITED Q2 FY18 Investor Presentation October 30, 2017 Lupin is a Dominant Force in Global Generics Globally 8 th 6 th 2 nd #1 largest generic globally (by market cap 1 ) largest generic company
Srei consolidated top line crosses
 Srei consolidated top line crosses ` 1,000 crore. Srei Quippo Amalgamation scheme approved by the Court. Record date for purpose of issuance of Bonus shares announced. KOLKATA, JANUARY 25, 2011 Srei Results
Interim Report. 1 January 31 March Sales reached 3,006 MSEK (3,317) Sales were flat in local currencies. Continued volume growth for snuff
 Sales were flat in local currencies. Continued volume growth for snuff") Interim Report 1 January 31 March 2003 Sales reached 3,006 MSEK (3,317) Sales were flat in local currencies Continued volume growth for snuff Operating income declined to 516 MSEK (605) or by 15 percent
Interim Report 1 January 31 March 2003 Sales reached 3,006 MSEK (3,317) Sales were flat in local currencies Continued volume growth for snuff Operating income declined to 516 MSEK (605) or by 15 percent
Interim Report. 1 January 30 September Sales declined by 6 percent and reached 9,692 MSEK (10,317) Sales were up 2 percent in local currencies
 Sales were up 2 percent in local currencies") Interim Report 1 January 30 September 2003 Sales declined by 6 percent and reached 9,692 MSEK (10,317) Sales were up 2 percent in local currencies Operating income declined to 1,693 MSEK (1,797) or by
Interim Report 1 January 30 September 2003 Sales declined by 6 percent and reached 9,692 MSEK (10,317) Sales were up 2 percent in local currencies Operating income declined to 1,693 MSEK (1,797) or by
1Q 2016 Results. Mermaid Maritime Plc. May 23, 2016
 Mermaid Maritime Plc 1Q 2016 Results May 23, 2016 Disclaimer: The information contained in this document is intended only for use during the presentation and should not be disseminated or distributed to
2Q 2017 Results. 11 Aug 2017 MERMAID MARITIME PUBLIC COMPANY LIMITED
 MERMAID MARITIME PUBLIC COMPANY LIMITED 2Q 2017 Results 11 Aug 2017 1 Disclaimer: The information contained in this document is intended only for use during the presentation and should not be disseminated
August 7, 2014 Heiwa Corporation
 August 7, 2014 Heiwa Corporation Contents Overview 3 1 st Quarter Results of FY Ending March 2015 4 Full-year Plan for FY2015 12 < Supplementary Information > Market Environment (Pachinko and Pachislot
Fortis Malar Hospitals Ltd BSE Scrip Code:
 Fortis Malar Hospitals Ltd BSE Scrip Code: 523696 Healthcare Services September 13, 2012 Current Market Price Rs. 52 Week High / Low Rs. Market Capitalisation Free Float Dividend Yield % One Year Regression
For personal use only
 ASX Announcement 18 July 2017 Crowd Mobile Limited (ASX:CM8) Crowd Mobile Achieves Record Fourth Quarter Revenue Supporting Strong Performance Fourth Quarter Financial Highlights Revenue of $11.6 million
2Q 2016 Results. Mermaid Maritime Plc. August 2016
 Mermaid Maritime Plc 2Q 2016 Results August 2016 Disclaimer: The information contained in this document is intended only for use during the presentation and should not be disseminated or distributed to
A company where growth and returns go hand in hand
 Breath to your Investment Tarun Aggarwal s Sanjivani Stock E-Mail id- sanjivanistock@gmail.com July 21, 2011 CMP-Rs.305/- Target Price Rs.1000/- (Time Frame 3-4 yrs) Research report on Selan Exploration
9MFY17 RESULTS: Indo Count Industries Ltd. has reported its unaudited standalone results for the quarter and nine month ended December 31, 2016.
 P R E S S R E L E A S E: 11 th F E B R U A R Y 2 0 1 7, M U M B A I INDO COUNT INDUSTRIE S LTD. 9MFY17 RESULTS:. has reported its unaudited standalone results for the quarter and nine month ended December
Confirms 2013 Financial Guidance
 Confirms 2013 Financial Guidance PROVIDENCE, R.I.--(BUSINESS WIRE)--Jul. 17, 2013-- Textron Inc. (NYSE: TXT) today reported second quarter 2013 income from continuing operations of $0.40 per share, compared
Report on Operations 1999
 Report on Operations 1999 Sales increased 15 percent to MSEK 9,420 Operating income, before items affecting comparability, increased 13 percent to MSEK 1,689 (1,489) Operating income, including capital
SMEs are a strategic segment for the Group
 SME GLOBAL STRATEGY SMEs are a strategic segment for the Group They are the driving force of the economies where we operate: 24 million SMEs in the markets where we operate. Contribute between 30% (e.g.
Annual Shareholders' Meeting. Stuttgart May 14th 2009
 Annual Shareholders' Meeting Stuttgart May 14th 2009 HUGO BOSS in 2008 in EUR mill. Net Sales 1.686 + 6% (fx-adj.) + 3% Gross Profit 1.011 + 7% EBIT before extraordinary items 226 + 9% Cash Flow from operating
Paints Industry. October 27, 2017 I Industry Research
 Paints Industry Contact: Madan Sabnavis Chief Economist madan.sabnavis@careratings.com 91-022-6754 3489 Bhagyashree C. Bhati Research Analyst bhagyashree.bhati@careratings.com 91-022-6754 3490 Mradul Mishra
Capcom Co., Ltd. (Tokyo Stock Exchange, First Section, 9697) 3rd Quarter Report Fiscal year ending March 31, 2018
 3rd Quarter Report Fiscal year ending March 31, 2018") Capcom Co., Ltd. (Tokyo Stock Exchange, First Section, 9697) 3rd Quarter Report Fiscal year ending March 31, 2018 0 Forward-looking Statements Strategies, plans, outlooks and other statements that are
Capcom Co., Ltd. (Tokyo Stock Exchange, First Section, 9697) 3rd Quarter Report Fiscal year ending March 31, 2018 0 Forward-looking Statements Strategies, plans, outlooks and other statements that are
Textron Reports Third Quarter 2014 Income from Continuing Operations of $0.57 per Share, up 62.9%; Revenues up 18.1%
 Textron Reports Third Quarter Income from Continuing Operations of $0.57 per Share, up 62.9%; Revenues up 18.1% 10/17/ PROVIDENCE, R.I.--(BUSINESS WIRE)-- Textron Inc. (NYSE: TXT) today reported third
Textron Reports Second Quarter 2014 Income from Continuing Operations of $0.51 per Share, up 27.5%; Revenues up 23.5%
 Textron Reports Second Quarter 2014 Income from Continuing Operations of $0.51 per Share, up 27.5%; Revenues up 23.5% 07/16/2014 PROVIDENCE, R.I.--(BUSINESS WIRE)-- Textron Inc. (NYSE: TXT) today reported
Q Interim Report
 Interim Report Aug 15, Today s presenter: Lars Wingefors Co-Founder & Group CEO 1 highlights Net sales SEK 837m EBITDA SEK 207m EBIT SEK 53m YoY growth 878% YoY growth 421% YoY growth 73% 10 releases in
3Q 2016 Results. Mermaid Maritime Plc. 14 November 2016
 Mermaid Maritime Plc 3Q 2016 Results 14 November 2016 Disclaimer: The information contained in this document is intended only for use during the presentation and should not be disseminated or distributed
The partner of choice for self-care products
 The partner of choice for self-care products Venture Life Group plc Full Year Results Presentation 2017 22 March 2018 2017 highlights Revenues up 12% to 16.1m (2016: 14.3m) Gross profit increased 18% to
DOLLAR INDUSTRIES LIMITED ONE OF INDIA S FASTEST GROWING LIFESTYLE INNERWEAR COMPANY. Earniings Call Q
 DOLLAR INDUSTRIES LIMITED ONE OF INDIA S FASTEST GROWING LIFESTYLE INNERWEAR COMPANY Earniings Call Q4 2017-18 2 Background Established in 1972 as a small family-run body-wear company having more than
Do Mid-Cap Private Equity Funds Have an Advantage in Today s Markets?
 Do Mid-Cap Private Equity Funds Have an Advantage in Today s Markets? Richard Cashin, Managing Partner, One Equity Partners Ellis Jones, CEO, Wasserstein & Co. John Mapes, Managing Partner, Aurora Capital
Capcom Co., Ltd. (Tokyo Stock Exchange, First Section, 9697) Financial Highlights for the Fiscal Year ended March 31, 2018
 Financial Highlights for the Fiscal Year ended March 31, 2018") Capcom Co., Ltd. (Tokyo Stock Exchange, First Section, 9697) Financial Highlights for the Fiscal Year ended March 31, 2018 0 0 Forward-looking Statements Strategies, plans, outlooks and other statements
Capcom Co., Ltd. (Tokyo Stock Exchange, First Section, 9697) Financial Highlights for the Fiscal Year ended March 31, 2018 0 0 Forward-looking Statements Strategies, plans, outlooks and other statements
IR Presentation. March 2014
 IR Presentation March 2014 1 Table of Contents 1. 4Q13 Earnings Summary - Financial Highlights 2. Service & Business Strategy 3. Mobile 4. PC - Developing Quality Contents - Growth Strategy - Expanding
August 5, 2016 Heiwa Corporation. Securities Code : 6412
 August 5, 2016 Heiwa Corporation Securities Code : 6412 Contents Overview 3 Results for the 1st Quarter of FY ending March 31, 2017 4 Full-year Plan for FY ending March 31, 2017 13 Supplementary Information
Textron Reports First Quarter 2016 Income from Continuing Operations of $0.55 per Share, up 19.6%; Reaffirms 2016 Financial Outlook
 Textron Reports First Quarter 2016 Income Continuing Operations of $0.55 per Share, up 19.6%; Reaffirms 2016 Financial Outlook April 20, 2016 06:30 AM Eastern Daylight Time PROVIDENCE, R.I.--(BUSINESS
Srei Infrastructure Finance Limited
 Srei Infrastructure Finance Limited Vision and Mission Statement Vision To be the most inspiring global holistic infrastructure institution Mission To be an Indian multinational company providing innovative
Opportunity in Small & Mid Cap
 Opportunity in Small & Mid Cap - A Private Equity Investing approach Presentation by Hiren Ved Alchemy Capital Management October 20 Presentation ti Path Investment Life Cycle Private equity opportunities
Second Quarter CY 2012 Results. August 2, 2012
 Second Quarter CY 2012 Results August 2, 2012 1 Safe Harbor Disclosure Please review our SEC filings on Form 10-K and Form 10-Q The statements contained in this presentation that are not historical facts
Praj Industries Limited. Q4 and FY18 Results. Praj Industries Ltd
 Praj Industries Limited Q4 and FY18 Results Praj Industries Ltd www.praj.net Safe Harbor Certain statements in this communication concerning our future growth prospects are forward-looking statements,
Cairn Oil & Gas FACT SHEET
 Cairn Oil & Gas FACT SHEET Key Player in Indian E&P sector Largest private crude oil producer In 2004 discovered the Mangala field in Rajasthan; largest onshore oil discovery in India in more than two
Investment Highlights. Revenue Distribution
 Stock Profile Investment Highlights Sector ITes Niche in running innovative operations for large portfolios of complex BSE 532927 NSE ECLERX Listing Date December 2007 Issued Shares (Rs. mn) 386.29 Share
Fourth Quarter 2013 Results. February 6, 2014
 Fourth Quarter 2013 Results February 6, 2014 Safe Harbor Disclosure Please review our SEC filings on Form 10-K and Form 10-Q The statements contained in this presentation that are not historical facts
Investor Presentation & Financial Highlights. May 2018
 Investor Presentation & Financial Highlights May 2018 Forward Looking Statements Certain statements in this release are "forward-looking" and as such are subject to numerous risks and uncertainties. Actual
Quarterly presentation Q DOF Subsea Group
 Quarterly presentation Q1 2016 DOF Subsea Group DOF Subsea Group DOF Subsea Group in brief Fleet One of the largest subsea vessel owners in the world Owns and operates a fleet of 21 vessels, plus 4 newbuilds
Q Presentation. DOF Subsea Group
 Q4 2015 Presentation DOF Subsea Group DOF Subsea Group DOF Subsea Group In brief Fleet One of the largest subsea vessel owners in the world Owns and operates a fleet of 21 vessels, plus 4 newbuilds on
Reference Materials Nine Month Period Ended December 31, 2018
 Reference Materials Nine Month Period Ended December 31, 2018 February 5, 2019 SQUARE ENIX HOLDINGS CO., LTD. Statements made in this document with respect to SQUARE ENIX HOLDINGS CO., LTD. and its consolidated
SMALL ENTERPRISE ASSISTANCE FUNDS
 SMALL ENTERPRISE ASSISTANCE FUNDS AFGHANISTAN: ACHIEVING SECURITY THROUGH SUSTAINABLE INVESTMENT BERT VAN DER VAART EXECUTIVE CHAIRMAN & COFOUNDER, SEAF MARCH 25, 2010 www.seaf.com www.afghangrowthfinance.com
Cherry AB. Investing in a broad gaming portfolio. CEO Anders Holmgren GP Bullhound 6 December 2017
 Cherry AB Investing in a broad gaming portfolio CEO Anders Holmgren GP Bullhound 6 December 2017 The game is on Cherry is investing in a broad portfolio of online gaming companies Cherry s strategy is
NOTICE OF THE 5TH ANNUAL GENERAL MEETING OF SHAREHOLDERS
 Note: This document is a translation of a part of the Japanese original. The translation is prepared and provided for the purpose of the readers convenience only. All readers are strongly recommended to
Tainan Enterprises Co., LTD. Date: Feb. 20, 2009
 Tainan Enterprises Co., LTD Date: Feb. 20, 2009 1. Company Profile Date of Establishment: 26 August, 1961 Chairman: Mr. Yang Ching-Hon Headquarters and Plant Location: Tainan Headquarters: No.320, Sec.
INTRODUCTION OUR CLIENTS OUR STRENGTH CASE STUDIES OUR SERVICES ASSOCIATE BUSINESSES THE TEAM 7 REDWOODS IN NEWS
 REDWOODS GROUP 1 2 3 4 5 6 INTRODUCTION OUR CLIENTS OUR STRENGTH CASE STUDIES OUR SERVICES ASSOCIATE BUSINESSES THE TEAM 7 REDWOODS IN NEWS TRANSACTED THE ACQUISITION OF LAND IN THE CENTRAL BUSINESS
Joint Venture Announcement. 27 August 2018
 Joint Venture Announcement 27 August 2018 1 JV Stake - 51:49 51% 49% Combine Initial Total Investment of Rs. 60 Crores 2 Specialized Products to address High End Category Rough Terrain Crane Truck Cranes
Financial Results Briefing Session
 Financial Results Briefing Session Six-Month Period Ended September 30, 2017 November 8, 2017 SQUARE ENIX HOLDINGS CO., LTD. Statements made in this document with respect to SQUARE ENIX HOLDINGS CO., LTD.
Real Estate Business Community Meet Under One Roof.
 2018. September 19, 20 & 21 Bombay Exhibition Centre - MUMBAI www.iipm.asia Associate Pa ners Sma Industrial Park Pa ner THE SHOW IIPM is India's first global B2B event for the real estate sector. It will
Third Quarter 2014 Results
 Third Quarter 204 Results November 4, 204 Safe Harbor Disclosure Please review our SEC filings on Form 0-K and Form 0-Q The statements contained in this presentation that are not historical facts are forward-looking
STRATEGIC ISSUES FOR BUSINESS
 CHAPTER - 7 STRATEGIC ISSUES FOR BUSINESS EXCELLENCE CASE STUDY OF HERO HONDA MOTORS LTD. Chapter 7 Hero Honda Motors Limited Case Study Hero Group Hero, the brand name symbolizing the steely ambition
Capcom Co., Ltd. (Tokyo and Osaka Exchanges, First Section, 9697) 1st Quarter Report Fiscal year ending March 31, 2013
 1st Quarter Report Fiscal year ending March 31, 2013") Capcom Co., Ltd. (Tokyo and Osaka Exchanges, First Section, 9697) 1st Quarter Report Fiscal year ending March 31, 2013 0 Forward-looking Statements Information in these materials concerning strategies,
Capcom Co., Ltd. (Tokyo and Osaka Exchanges, First Section, 9697) 1st Quarter Report Fiscal year ending March 31, 2013 0 Forward-looking Statements Information in these materials concerning strategies,
Preferred partner. Aker Solutions. Nordic Energy Summit 2013, 21 March Leif Borge CFO
 Aker Solutions Nordic Energy Summit 213, 21 March Leif Borge CFO 212 Aker Solutions Slide 1 This is Aker Solutions Employees: 19 5 Contract staff: 5 5 Revenues: 45 bn EBITDA: 4.7 bn Market Cap: 32. bn
Redefining the future for people and places 1
 Redefining the future for people and places 1 Strategic Development HY2015 Significantly enhanced Group 2015 Headline EPS 67.9p +68% vs 2010 (40.3p) Headline EBIT +72% (c50% of this growth organic) Attractive
Corporate Presentation
 Corporate Presentation 1 PTC: Vision and Core Values Vision To be a Frontrunner in developing a vibrant Power Market and striving to correct market distortions Core Values Transparency The Customer is
Investing in Regional Sustainability Norris Lozano, PDC
 Investing in Regional Sustainability Norris Lozano, PDC Regional Leaders Seminar Series Institute of Metropolitan Studies Portland, OR May 10, 2004 1 The Portland Development Commission Housing Infrastructure
DBS GROUP HOLDINGS LTD. 15 th Annual General Meeting & Extraordinary General Meeting. 28 April 2014
 DBS GROUP HOLDINGS LTD 15 th Annual General Meeting & Extraordinary General Meeting 28 April 2014 1 Creating Shared Value Piyush Gupta, Chief Executive Officer April 28, 2014 Disclaimer: The information
Second Quarter 2013 Results August 1, 2013
 Second Quarter 203 Results August, 203 2 Safe Harbor Disclosure Please review our SEC filings on Form 0-K and Form 0-Q The statements contained in this presentation that are not historical facts are forward-looking
Entertainment Network India Ltd Re-Initiating Coverage BUY
 26-Dec-13 26-Jan-14 26-Feb-14 26-Mar-14 26-Apr-14 26-May-14 26-Jun-14 26-Jul-14 26-Aug-14 26-Sep-14 26-Oct-14 26-Nov-14 26-Dec-14 STOCK POINTER Entertainment Network India Ltd Re-Initiating Coverage BUY
Suzlon Energy - Q2 Results
 News Release Saturday, October 31, 2009 For Immediate Release Suzlon Energy - Q2 Results Suzlon orderbook: 1,488 MW, with 1,365 MW in international orders and 123 MW in domestic orders Suzlon Energy consolidated
 FOR IMMEDIATE RELEASE EARNINGS RELEASE Date: November 14, 2017 Advanced Enzyme Technologies Limited announces Financial Results for Second Quarter ended September 2017 Mumbai, India: November 14, 2017
Active Cable TV Connections. Active Residential Cable Modem Customers. Page FIRST QUARTER REPORT
 21-22 FIRST QUARTER REPORT Active Cable TV Connections AFN Cable connections in the business plan are projected to be 2,44 by July 22. As of October 31, 21, there are 1,895 connections, which means AFN
First Quarter 2013 Results May 8, 2013
 First Quarter 2013 Results May 8, 2013 Safe Harbor Disclosure Please review our SEC filings on Form 10-K and Form 10-Q The statements contained in this presentation that are not historical facts are forward-looking
BNP Paribas India Solutions Pvt Ltd CSR Policy
 BNP Paribas India Solutions Pvt Ltd CSR Policy About BNP Paribas India Solutions Pvt Ltd Established in 2005, BNP Paribas India Solutions Pvt Ltd is a wholly owned subsidiary of BNP Paribas SA, which is
Introduction to Istithmar World Capital. October 2008
 Introduction to Istithmar World Capital October 2008 INTRODUCTION Istithmar World Capital ( IWC ) is a private equity and alternative investment house based in Dubai, UAE Established in 2003, IWC is part
Financial Presentation (First Half of the Year Ending March 31, 2014) FIELDS CORPORATION. (November 7, 2013) JASDAQ Standard 2767
 FIELDS CORPORATION. (November 7, 2013) JASDAQ Standard 2767") FIELDS CORPORATION 2nd quarter (7. 2013 9. 2013) Financial Presentation (First Half of the Year Ending March 31, 2014) FIELDS CORPORATION (November 7, 2013) JASDAQ Standard 2767 The Greatest Leisure for
FIELDS CORPORATION 2nd quarter (7. 2013 9. 2013) Financial Presentation (First Half of the Year Ending March 31, 2014) FIELDS CORPORATION (November 7, 2013) JASDAQ Standard 2767 The Greatest Leisure for
Q1 FY18 Performance Highlights
 PRESS RELEASE August 13, 2017 Q1 FY18 Performance Highlights GST transition causing short-term disruption in growth momentum; New product pipeline, profitability, free cash-flows and order book remained
3 rd Annual Global Automotive Conference Goldman Sachs. London, December 8, 2011
 3 rd Annual Global Automotive Conference Goldman Sachs London, December 8, 2011 1 3rd Annual Global Automotive Conference Goldman Sachs London, December 8, 2011 Outline Net sales: Sustained firm growth
Textron Reports Third Quarter 2018 Results; Narrows Full-Year EPS and Cash Guidance
 Corporate Communications Department NEWS Release Textron Reports Third Quarter 2018 Results; Narrows Full-Year EPS and Cash Guidance $468 million returned to shareholders through share repurchases Completed
First Quarter 2014 Results
 First Quarter 04 Results May 6, 04 Safe Harbor Disclosure Please review our SEC filings on Form 0-K and Form 0-Q The statements contained in this presentation that are not historical facts are forward-looking
Table of Contents. 1. 4Q13 Earnings Summary - Financial Highlights. 2. Service & Business Strategy. 3. Mobile 4. PC. 5. Appendix
 1 Table of Contents 1. 4Q13 Earnings Summary - Financial Highlights 2. Service & Business Strategy 3. Mobile 4. PC - Developing Quality Contents - Growth Strategy - Expanding Development - CGP & Investment
Erratum to the Press Release 2017 annual results - NRJ Group. dated March 15, 2018
 Paris, March 20, 2018 5:45 pm Erratum to the Press Release 2017 annual results - NRJ Group dated March 15, 2018 An editorial error was made in the press release dated March 15, 2018 (English version only)
WRITTEN SUBMISSION OF GE CAPITAL TO THE FINANCIAL CRISIS INQUIRY COMMISSION
 WRITTEN SUBMISSION OF GE CAPITAL TO THE FINANCIAL CRISIS INQUIRY COMMISSION MICHAEL A. NEAL CHAIRMAN AND CEO OF GE CAPITAL AND VICE CHAIRMAN OF GE May 6, 2010 Chairman Angelides, Vice-Chairman Thomas,
Quarterly Presentation Q DOF Subsea Group
 Quarterly Presentation Q4 2016 DOF Subsea Group DOF Subsea Group DOF Subsea Group in Brief DOF ASA (51%) First Reserve Corporation (49%) DOF Subsea Holding (100%) DOF Subsea 2005 Established 20 526 NOK
 RESULTS FOR THE QUARTER ENDING 30 th SEPTEMBER 2018 12% DOMESTIC CONSUMER GROWTH, 10% UNDERLYING VOLUME GROWTH Mumbai, October 12 th, 2018: Hindustan Unilever Limited announced its results for the quarter
COLUMBUS 2020 A REGIONAL GROWTH STRATEGY FOR CENTRAL OHIO
 COLUMBUS 2020 A REGIONAL GROWTH STRATEGY FOR CENTRAL OHIO Vision To achieve the strongest decade of growth in the Columbus Region s history Mission To strengthen the economic base of the 11-county Columbus
Board of Directors. Non-Executive Chairman (Independent Director) Mr. Anil Baijal
 Mr. Anil Baijal") IDFC BANK Board of Directors Mr. Anil Baijal Non-Executive Chairman (Independent Director) Dr. Rajiv B. Lall Ms. Veena Mankar (Director with Special knowledge of agriculture, rural economy, co-operation
IDFC BANK Board of Directors Mr. Anil Baijal Non-Executive Chairman (Independent Director) Dr. Rajiv B. Lall Ms. Veena Mankar (Director with Special knowledge of agriculture, rural economy, co-operation
Property right statement: Copyright of charts, tables and sentences in this report belongs to
 The Vertical Portal for China Business Intelligence. Semiconductor Equipment Industry Report, 2009 Nov/2009 Property right statement: Copyright of charts, tables and sentences in this report belongs to
4Q February 2011
 4Q 2010 28 February 2011 2 Disclaimer forward looking statements This presentation contains forward-looking statements that involve risks and uncertainties. All statements other than statements of historical
Praj Industries Limited. Q4 and FY17 Results. Praj Industries Ltd
 Praj Industries Limited Q4 and FY17 Results Praj Industries Ltd www.praj.net Safe Harbor Certain statements in this communication concerning our future growth prospects are forward-looking statements,
New Medium-Term Management Plan Maximize Value Proposition 2022 (MVP-22)
") New Medium-Term Management Plan Maximize Value Proposition 2022 (MVP-22) Establishes the Kurita Group Philosophy System From 21st Century Vision to Kurita Group Philosophy System Corporate Philosophy Corporate
New Medium-Term Management Plan Maximize Value Proposition 2022 (MVP-22) Establishes the Kurita Group Philosophy System From 21st Century Vision to Kurita Group Philosophy System Corporate Philosophy Corporate
NATIONAL INSTITUTE OF ECONOMIC AND SOCIAL RESEARCH ESTIMATES OF MONTHLY GDP. Embargo until hours on 11 th January 2013
 NATIONAL INSTITUTE OF ECONOMIC AND SOCIAL RESEARCH ESTIMATES OF MONTHLY GDP Embargo until 15.00 hours on 11 th January 2013 Our monthly estimates of GDP suggest that output declined by 0.3 per cent in
Second Quarter 2014 Results
 Second Quarter 2014 Results August 5, 2014 Safe Harbor Disclosure Please review our SEC filings on Form 10-K and Form 10-Q The statements contained in this presentation that are not historical facts are
FINANCE REPORT. April 2014 to December 2014
 FINANCE REPORT April 2014 to December 2014 This report summarises the financial position of Rushcliffe CCG for the 9 months ending 31 December 2014. The table below summarises the statutory financial duties
February 9, 2017 Heiwa Corporation. Securities Code : 6412
 February 9, 2017 Heiwa Corporation Securities Code : 6412 Contents Overview 3 Results for the 3rd Quarter of FY ending March 31, 2017 4 Full-year Plan for FY ending March 31, 2017 13 Supplementary Information
Alf a Lav al Slide 1
 Alf a Lav al Slide 1 www.alfalaval.com Interim Report Q2 2007 - Orders received and margins - Highlights - Development per segment - Geographical development - Financials - Outlook Mr. Lars Renström President
CONVOCATION NOTICE OF THE 22ND ANNUAL SHAREHOLDERS MEETING
 CONVOCATION NOTICE OF THE 22ND ANNUAL SHAREHOLDERS MEETING Date and Time: Friday, June 23, 2017 10:00 a.m. Venue: Keidanren Kaikan Conference Rooms #401 402 1 3 2 Otemachi, Chiyoda ku, Tokyo Shareholders
PE Monthly Roundup July 2017
 PE Monthly Roundup y 20 PE/VC headline trends Monthly US$ mn # Investments,000 0 0 9,000 0 9 2 0 2,000 0 0,000 9,00,2, 92,02,9 9 2,,920,,0, 20-0 - Aug- Sep- Oct- Nov- Dec- Jan- Feb- Mar- - - - -,00,000
Q1 Financial Presentation 2018 DOF ASA
 Q1 Financial Presentation 2018 DOF ASA Highlights Group 2 Highlights EBITDA Q1 MNOK 520 (excl hedge accounting) Average utilisation Group fleet 72% in Q1 Improved markets and signs of higher activity in
In the quarter, Textron returned $344 million to shareholders through share repurchases, compared to $186 million in the first quarter of 2017.
 Corporate Communications Department NEWS Release Textron Reports First Quarter 2018 Income from Continuing Operations of $0.72 per Share; Signs Agreement to Sell Tools & Test Business for $810 Million
Conference Call Q2 2013
 Conference Call Düsseldorf, July 30, GEA Group Aktiengesellschaft Disclaimer Forward-looking statements are based on our current assumptions and forecasts. These statements naturally entail risks and uncertainties,
Capcom Co., Ltd. (Tokyo Exchanges, First Section, 9697) 3rd Quarter Report Fiscal year ending March 31, 2014
 3rd Quarter Report Fiscal year ending March 31, 2014") Capcom Co., Ltd. (Tokyo Exchanges, First Section, 9697) 3rd Quarter Report Fiscal year ending March 31, 2014 0 Forward-looking Statements Strategies, plans, outlooks and other statements that are not historical
Capcom Co., Ltd. (Tokyo Exchanges, First Section, 9697) 3rd Quarter Report Fiscal year ending March 31, 2014 0 Forward-looking Statements Strategies, plans, outlooks and other statements that are not historical
STARBREEZE investor Presentation
 STARBREEZE investor Presentation GP Bullhound Nordic Tech Tour, 7 December 2017 Slide / 1 Introduction to starbreeze outline Starbreeze games and publishing Virtual reality Slide / 2 Financial overview