Population A Review of Census Data Related to the Population of Allen County, Indiana
|
|
|
- Luke Smith
- 6 years ago
- Views:
Transcription

1 A Demographic and Socio Economic Profile of Allen County, Indiana based on the 2010 Census and the American Community Survey Population A Review of Census Data Related to the Population of Allen County, Indiana Prepared by The at IPFW May 2012
2 Table of Contents Growth Rates and Comparisons... 1 Geographic Distribution in Allen County: Places and Townships... 2 Source: 2010 Census... 2 Census Tracts... 6 Change in Population in Census Tracts... 9 By Race Minorities by Census Tract Hispanic (Not a Race) Age Age Distribution Race by Age Dependency Ratios Population Projections Selected Data on the Allen County Foreign Born Population Financial support for this project is provided by the John S. and James L. Knight Foundation Fund held at the Community Foundation of Greater Fort Wayne. Without the support of the Foundation this study would not have been possible. The also wishes to thank Paul Spoelhof, Senior Planner with the City of Fort Wayne Community Development Division, for his assistance on this project.
3 Population 1 POPULATION Source: 2010 Decennial Census Key Points: From 2000 to 2010, Allen County s population increased 7.1 percent to 355,329. This rate of increase was higher than the state s although lower than the national increase of 9.7 percent. The Northwest suburban area, comprised of Perry, Eel River, Lake, and Washington townships, was the fastest growing area in Allen County during this past decade. Perry Township took top honors this decade with a growth rate of 60.5 percent and almost 11,000 new residents. The Hispanic population grew by 66.4 percent this decade in Allen County. The Asian population grew by 109 percent, and much of this was fueled by the Burmese population arriving in Fort Wayne during this decade. A higher percentage of Allen County residents reside in an incorporated city or town in 2010 than at any time since In 2010, the Decennial Census reported that there were 355,329 residents in Allen County as of April 1, This is an increase of 23,480 since Chart ,000 Allen County Population: , , , , , ,000 50, Population 114, , , , , , , , , ,329 Growth Rates and Comparisons From 2000 to 2010, Allen County s population increased by 7.1 percent. Although Allen County has not grown as fast as the nation since pre 1970, the growth rate has been slightly higher than the state of Indiana in the last three decades.
4 Population 2 Chart % Decennial Percentage Changes in Population: Allen County, Indiana, and United States 25% 20% 15% 10% 5% 0% Allen County 28.4% 5.7% 18.5% 26.4% 20.8% 4.9% 2.2% 10.3% 7.1% Indiana 10.5% 5.8% 14.8% 18.5% 11.4% 5.7% 1.0% 9.7% 6.6% United States 16.2% 7.3% 14.5% 18.5% 13.4% 11.4% 9.8% 13.2% 9.7% Geographic Distribution in Allen County: Places and Townships Source: 2010 Census Table 1.1 below identifies the population changes for the cities and towns within Allen County. Since these areas can change their boundaries with annexation, identifying the city or town growth is not always significant. For example, Figure 1.1 identifies the changes in the City of Fort Wayne since 1950 through annexation. A review of this figure illustrates that much of the growth in recent decades is due to annexation. The city of Fort Wayne accounted for 71.4 percent of the population in Allen County in 2010, and the total of all incorporated areas (identified in Table 1.1 below) accounted for percent of county population. The unincorporated portions of Allen County total percent of Allen County s population, or 74,109 residents. Table 1.1 PLACE: Fort Wayne city 86, , , , , , , , , ,691 Grabill town NA ,113 1,053 Huntertown town NA NA NA NA NA 775 1,265 1,330 1,771 4,810 Leo Cedarville town NA NA NA NA NA NA NA NA 2,782 3,603 Monroeville town ,150 1,294 1,353 1,372 1,232 1,236 1,235 New Haven city 1,237 1,702 1,872 2,336 3,396 5,346 6,714 9,320 12,406 14,794 Woodburn city ,002 1,321 1,579 1,520 Zanesville town NA NA NA NA NA NA NA NA Note: Zanesville straddles two counties, Allen and Wells, with approximately 85 percent of the population in Allen County. Leo Cedarville and Zanesville were both incorporated in the 1990s.

5 Population 3 Figure 1.1

6 Population 4 Allen County Townships, shown in Figure 1.2, have defined boundaries which have not changed, and population totals since 1950 and the growth are shown in Table 1.2. CRI has grouped these by area (central, northwest, northeast, southwest, southeast, and eastern rural) since this adds an element of visualizing the population growth over the decades. Figure 1.2
7 Population 5 Table 1.2 Decennial Census Change Township/Area Central Wayne 142, , , , , , , % 6.6% Northeast Suburbia: Cedar Creek 2,200 3,579 4,414 5,864 6,688 10,288 12, % 22.2% Milan 1,623 1,942 2,335 3,178 3,165 3,503 3, % 7.0% St. Joseph 3,288 14,237 38,094 55,348 61,167 68,276 72, % 5.8% Total 7,111 19,758 44,843 64,390 71,020 82,067 88, % 7.9% Northwest Suburbia: Eel River 1,238 1,432 1,622 2,423 2,576 3,004 3, % 20.2% Lake 1,515 1,880 2,061 2,184 1,914 1,985 2, % 15.9% Perry 2,570 4,036 5,768 8,299 10,909 18,170 29, % 60.5% Washington 5,868 12,608 20,296 23,851 27,416 33,105 36, % 9.0% Total 11,191 19,956 29,747 36,757 42,815 56,264 71, % 26.5% Southwest Suburbia: Aboite 1,427 3,131 6,132 11,663 18,490 28,338 35, % 26.2% Lafayette 1,234 1,490 2,035 2,389 2,530 2,707 3, % 23.9% Pleasant 1,340 1,864 2,474 3,472 3,355 3,362 3, % 1.5% Total 4,001 6,485 10,641 17,524 24,375 34,407 42, % 23.3% Southeast Suburbia/New Haven: Adams 8,495 18,428 31,034 31, , % 1.3% Marion 1,425 2,326 3,221 3, , % 5.6% Total 9,920 20,754 34,255 35,497 34,552 35,049 35, % 1.8% Eastern Rural Townships: Jackson % 1.2% Jefferson 1,616 1,895 2,130 2,142 1,882 1,958 2, % 7.7% Madison 1,360 1,466 1,711 1,729 1,615 1,796 1, % 1.4% Maumee 1,305 1,435 1,781 2,408 2,459 2,619 2, % 0.0% Monroe 1,955 2,158 2,153 2,174 1,969 1,963 1, % 1.8% Scipio % 0.0% Springfield 1,606 1,875 2,608 2,987 3,169 3,697 4, % 17.6% Total 8,849 9,958 11,453 12,438 12,069 12,945 13, % 5.8% County Total 183, , , , , , , % 7.1% The population for each of these township combinations is shown in Chart 1.3, and the corresponding growth rates are in Chart 1.4.
8 Population 6 Chart ,000 Population by Census for Townships Groupings 140, , ,000 80,000 60,000 40,000 20, Central Wayne Northeast Suburbia: Northwest Suburbia: Southwest Suburbia: Southeast Suburbia: Eastern Rural Townships: Chart % Growth Rates by Decade by Township Grouping including Allen County Rate 175% 150% 125% 100% 75% 50% 25% 0% 25% Central Wayne Northeast Suburbia Northwest Suburbia Southwest Suburbia Southeast Suburbia/NH Eastern Rural Townships County Total Census Tracts There are 96 census tracts in Allen County as of the 2010 Census 1. These are one of the smallest geographical divisions 2 for which the Census provides data. Most census tracts have stable boundaries and can be compared 1 After each decennial Census, the Census Bureau can re map areas depending on population or land use changes. In 2000 there were 90 census tracts. We have to use both of these tract maps to analyze the data. Appendix D identifies the differences between the two censuses and how we reconciled these changes. 2 The U.S. Census provides data on block groups or census blocks, which are smaller areas than census tracts.
, census tracts have between 1,500 and 8,000 people, and optimally hold 4,000 people.")
9 Population 7 from census to census. The map of the 2010 Census for Allen County is shown below, and the population for each census tract in Allen County is shown in Table 1.3. Generally (nationwide), census tracts have between 1,500 and 8,000 people, and optimally hold 4,000 people. In 2010, the average number of residents in an Allen County tract is 3,701 (3,687 residents in 2000). The ranges for the population in census tracts in Allen County range from a maximum of 6,752 to a low of either 81 or 1,079 depending on whether you wish to consider the population in tracts and tracts that were established for special purposes other than residency. See Appendix D for more on census tracts including a map of the 2000 and notes on the changes in the boundaries between 2000 and Figure 1.3
10 Population 8 Table 1.3 Population by Census Tract Tract Population Tract Population Census Tract 1 2,358 Census Tract 104 3,612 Census Tract 3 3,298 Census Tract 105 2,301 Census Tract 4 2,569 Census Tract ,586 Census Tract 5 2,945 Census Tract ,583 Census Tract 6 1,975 Census Tract ,620 Census Tract ,108 Census Tract ,744 Census Tract ,419 Census Tract ,019 Census Tract 8 4,113 Census Tract ,701 Census Tract 9 3,166 Census Tract ,803 Census Tract 10 1,247 Census Tract ,227 Census Tract 11 1,559 Census Tract ,918 Census Tract 12 1,079 Census Tract ,394 Census Tract 13 2,277 Census Tract ,213 Census Tract 16 2,206 Census Tract ,210 Census Tract 17 2,177 Census Tract ,422 Census Tract 20 3,321 Census Tract ,148 Census Tract 21 2,344 Census Tract ,210 Census Tract 22 4,221 Census Tract ,484 Census Tract 23 5,180 Census Tract ,709 Census Tract 25 3,152 Census Tract ,054 Census Tract 26 3,347 Census Tract ,389 Census Tract 28 2,065 Census Tract ,581 Census Tract 29 2,368 Census Tract 109 6,369 Census Tract 30 3,525 Census Tract 110 2,613 Census Tract 31 2,645 Census Tract 111 2,853 Census Tract 32 5,325 Census Tract ,940 Census Tract ,795 Census Tract ,164 Census Tract ,340 Census Tract ,093 Census Tract ,351 Census Tract ,299 Census Tract 35 4,216 Census Tract ,644 Census Tract 36 5,687 Census Tract ,079 Census Tract 37 2,779 Census Tract ,081 Census Tract 38 3,132 Census Tract ,741 Census Tract ,358 Census Tract ,602 Census Tract ,448 Census Tract ,192 Census Tract 40 3,111 Census Tract ,090 Census Tract ,251 Census Tract ,105 Census Tract ,368 Census Tract ,846 Census Tract 43 2,652 Census Tract ,920 Census Tract 44 3,223 Census Tract ,290 Census Tract 101 4,763 Census Tract ,322 Census Tract ,752 Census Tract ,354 Census Tract ,818 Census Tract ,312 Census Tract ,601 Census Tract ,858 Census Tract ,551 Census Tract ,771 Census Tract ,154 Census Tract 119 1,927 Census Tract ,298 Census Tract Census Tract ,554 Census Tract Source: US Census Bureau, 2010 Census, Redistricting Data Tables P1 and H1.

11 Population 9 Change in Population in Census Tracts Changes in population by census tract from 2000 to 2010 are shown in Figure 1.4. Some boundaries have changed for some tracts and some tracts have been completely reconfigured, and you may need to reference the conversion process we have used. This is noted in Appendix D. Figure 1.4
12 Population 10 By Race Trends in Allen County s population by race are shown in Table 1.4. Note that the Hispanic population is not shown in this table since Hispanic is an ethnicity, not a race. The Census does collect data on Hispanic ethnicity, and that is shown in Table Appendix B includes information concerning the methodology and definitions. Table 1.4 Race Totals in Allen County White 260, , , , ,653 Black or African American 19,298 26,396 30,102 37,527 41,618 Asian 1,286 2,544 4,652 9,721 American Indian and Alaska Native (AIAN) 1,187 1,246 Native Hawaiian and Other Pacific Islander (NHPI) Some Other Race (SOR) 6,716 10,455 2 or More 5,946 10,447 Other* 1,069 3,745 4,102 TOTAL 282, , , , ,329 Note: Minorities other than Black accounted for less than 0.5 percent of total population in 1970 in Allen County, and a breakout by other minority races was not available. Asians were identified in 1980 and 1990, and a more substantive breakout by race was available with the 2000 Census.*Other is not a race, but an alternative response available until more recent censuses. See Appendix B for more background on race in the censuses. The percentage changes throughout this period are shown below. Minorities, especially Asian, Native Hawaiian/Other Pacific Islander, and Two or more, have had significant growth rates, although in many cases, the percentage is based on a relatively low base number. Table 1.5 illustrates the overall changes in the race make up in the last 40 years in Allen County. Table 1.5 Change in Race White 1.1% 0.4% 4.4% 2.2% Black 36.8% 14.0% 24.7% 10.9% Asian 97.8% 82.9% 109.0% AIAN 5.0% NHPI 52.4% SOR 55.7% Two or More 75.7% Other* 250.3% 9.5% *See explanation in Table 1.4 above. Chart 1.5 at the end of this chapter gives a cursory look at the projected median ages by race in the state of Indiana. If the race by age in Allen County is similar to this data, then an analysis of birth rates will most likely indicate that most minority races will continue to grow at a faster percentage rate than older populations such as the White race. Also later in this chapter, we explain why we believe that a good percentage of the Some other race represents Hispanics, who also have a younger average population. A subset of interest locally in the Asian population relates to the Burmese population. We know that Allen County had a large influx of Burmese in the past decade, and this would most likely explain much of the growth in the Asian population. As more data is received, hopefully some of the speculation will cease and facts will be available, but the Census is not set up to identify all races. The 2010 Census data has an opportunity for Asians to identify a specific race, such as Indian, Chinese, Filipino, Japanese, Korean, or Vietnamese. If the person is Asian and from a
13 Population 11 race that is not one of these, they would check the other box. In Allen County, there were 9,721 Asians in 2010 and 5,158 checked the Other box. This would include the Burmese, but also the Laotians, Thais, Pakistanis, Hmong, Cambodians and so on. As is shown in Table 1.6, the high percentage of Other Asians in Allen County points to the population of Burmese, but we know that some of this population includes other Asian races. Table 1.6 Racial Distributions of Asians in the 2010 Census Asian Indian Chinese Filipino Japanese Korean Vietnamese Other Asian Allen County 16.0% 7.5% 7.0% 1.9% 4.1% 10.4% 53.1% Indiana 26.9% 22.0% 10.4% 4.8% 10.1% 6.7% 19.1% United States 19.4% 22.8% 17.4% 5.2% 9.7% 10.6% 14.9% The American Community Survey would be the best place to identify the number of Burmese in Allen County because the ACS collects much more detailed information, but there are at least two differences between the ACS and the Decennial Census that make it difficult to get the exact number of Burmese. First, the ACS is based on a sample, and the calculations include past years data such as adjusted Census 2000 numbers (for example, in the next paragraph, note that the 2010 ACS has five percent fewer Asians in its base than the 2010 Census does). If there is an immigration flow, this change in status quo may not be picked up right away, and the survey data would be calculated using old base numbers. Secondly, there is some concern that some groups such as some Burmese immigrants avoid government surveys, and this could be a factor also. The 2010 ACS for Allen County is using data based on a population of Asian (alone) that is 5 percent less than the number of Asians in Census This ACS indicated that there 3,676 Burmese that are Burmese Alone that is, no other race categories. There were an additional 170 Burmese who responded that they were Burmese and some other race in Allen County. Note that this is the ACS a survey, not the decennial count, and there will not be a decennial count which identifies immigrants. There have been reports that Allen County has had a number of immigrants/refugees from African nations during this past decade, but there is nothing in the current census data that would aid us in analyzing this population. We have added some analysis in the final part of this chapter on this subject as well as on the Burmese immigrants. Table 1.7 Racial Distribution in Allen County White 92.7% 89.3% 87.8% 83.1% 79.3% Black 6.9% 9.0% 10.0% 11.3% 11.7% Asian 0.0% 0.4% 0.8% 1.4% 2.7% AIAN 0.0% 0.0% 0.0% 0.4% 0.4% NHPI 0.0% 0.0% 0.0% 0.0% 0.1% Some Other Race 0.0% 0.0% 0.0% 2.0% 2.9% Two or More 0.0% 0.0% 0.0% 1.8% 2.9% Other* 0.4% 1.3% 1.4% na na *See notes on Table 1.4 above. Table 1.8 below compares the racial and Hispanic population in Indiana and the United States. As a larger urban county, it might be expected that Allen County s population is more diverse than the state of Indiana.
14 Population 12 Table Census Racial and Hispanic Composition Percent Change in Population Since 2000 Allen County Indiana U.S. Allen County Indiana U.S. White 79.27% 84.33% 72.41% 2.2% 2.8% 5.7% Black 11.71% 9.12% 12.61% 10.9% 16.0% 12.3% Asian 2.74% 1.58% 4.75% 109.0% 73.3% 43.3% AIAN 0.35% 0.28% 0.95% 5.0% 16.7% 18.4% NHPI 0.05% 0.04% 0.17% 52.4% 17.1% 35.4% SOR 2.94% 2.67% 6.19% 55.7% 77.2% 24.4% Two or More 2.94% 1.97% 2.92% 75.7% 69.0% 32.0% Hispanic 6.50% 6.01% 16.35% 66.4% 81.6% 43.0% Total Change in Population 7.1% 6.6% 9.7% Minorities by Census Tract Tables show the percentages of Blacks, Asians, Two or More, and Some other race by census tract as of 2010, and Figures 1.5 and 1.7 illustrate this graphically. Figures 1.6 and 1.8 compare changes from 2000 to 2010, using the average percentage of that race in Allen County as of The racial categories Two or more races and Some other race did not appear to have high percentages of population in tracts and were therefore not mapped.
15 Population 13 Table 1.9 Blacks or African Americans in Allen County By Census Tract, 2010 Census Tract Number Percentage Tract Number Percentage 40 2, % % 17 1, % % 28 1, % % 30 2, % % 29 1, % % 43 1, % % 23 2, % % 44 1, % % , % % 36 2, % % , % % % % % % % % % % % % % % % % % % % % % % % % % % % % % % % % % % % % % % % % % % % % % % % % % % % % % % % % % % % % % % % % % % % % % % % % % % Note: Census Tracts and are excluded from analysis. See Appendix D.

16 Population 14 Figure 1.5


17 Population 15 Figure 1.6 There were large percentage decreases in Black population in census tracts 17, 28, 29, and 30 from 2000 to 2010, but these tracts are still are well above the 11.7% criterion used in Figure 1.6 above.
18 Population 16 Table 1.10 Asians in Allen County By Census Tract, 2010 Census Tract Number Percentage Tract Number Percentage , % % % % % % % % % % % % % % % % % % % % % % % % % % % % % % % % % % % % % % % % % % % % % % % % % % % % % % % % % % % % % % % % % % % % % % % % % % % % % % % % % % % % % % % % % % % % % % Note: Census Tracts and are excluded from analysis. See Appendix D.
19 Population 17 Figure 1.7

20 Population 18 Figure 1.8 This map serves as a good example of viewing the probable change in population related to the arrival of Burmese immigrants in the 2000s. In 2000, tract was comprised of only 1 percent Asian, and 10 years later it was 26.8 percent. With this much change occurring within a small defined area, what changes have occurred within this census tract? Blacks or African Americans have moved from the neighborhood they represented 56 percent of the tract population in 2000, and now that percentage is 45 percent (See Appendix D for data). Similar statistics can be given for tract : Asians now represent 23.2 percent of the tract population (up from zero in 2000), and there was a reduction in the Black population although the total population in that tract grew. From the Community Development Division of the City of Fort Wayne, the rationale for a dominant Asian presence in tracts , , 5, 23, 35, and was explained. Those tracts house certain apartment complexes in which Burmese refugees initially settled, and other tracts are home to many of the Burmese who were able to move to different housing arrangements after they found work in this area. Newspaper articles reflect some of the social impact caused by the change in demographics, but look at the difference in perspectives from the Fort Wayne article (Journal Gazette) compared to The New York Times article: Buddhists find home in Fort Wayne Fort Wayne has always embraced immigrants 3 compared with New York Times: Buddhist temples find uneasy home in Indiana I was appalled. said neighbor X who lives next door. 4 3 Rowand, C. (2007, January 2). Buddhists find home in Fort Wayne. Journal Gazette. Retrieved from 4 Maag, C. (2007, April 22). Buddhist temples find uneasy home in Indiana. The New York Times. Retrieved from temples html
21 Population 19 Table 1.11 Some Other Race in Allen County By Census Tract, 2010 Census Tract Number Percentage Tract Number Percentage % % % % % % % % % % % % % % % % % % % % % % % % % % % % % % % % % % % % % % % % % % % % % % % % % % % % % % % % % % % % % % % % % % % % % % % % % % % % % % % % % % % % % % % % % % % % % % Note: Census Tracts and are excluded from analysis. See Appendix D.
22 Population 20 Table 1.12 Two or More Races in Allen County By Census Tract, 2010 Census Tract Number Percentage Tract Number Percentage % % % % % % % % % % % % % % % % % % % % % % % % % % % % % % % % % % % % % % % % % % % % % % % % % % % % % % % % % % % % % % % % % % % % % % % % % % % % % % % % % % % % % % % % % % % % % % Note: Census Tracts and are excluded from analysis. See Appendix D.
23 Population 21 Hispanic (Not a Race) Hispanics or Latinos are people who classified themselves in one of the specific Spanish, Hispanic, or Latino categories on the Census surveys. Origin is the heritage, nationality, lineage or country of birth of the person or the person s parents or ancestors before their arrival in the United States. People who identify their origin as Hispanic may be of any race, and the percent that identify themselves as Hispanic are not included or added to the race totals. In the last few decades, the Census has been designing and re designing the decennial Census in order to capture information about those with Hispanic origins. Due to the evolving nature of the questions, caution is encouraged when comparing decennial data. The Census notes that the choice Some other race was included in 2000 for respondents unable to identify with the five Office of Management and Budget race categories. They note that many respondents who provided writein entries were of Hispanic origin. The Pew Hispanic Center reports that in 2008, most Hispanics nationally identified themselves as white (62.5 percent) and a sizeable percentage (30.4 percent) self identified as Some other race 5. In comparison, just 0.3 percent of non Hispanics identify with Some other race. Table 1.13 identifies this breakdown for Allen County and it appears that Some other race is a more common choice here in Allen County than nationally, with 42.4 percent of Allen County Hispanics making that choice. As was done in the CRI review of Census 2000, we believe it would not be inappropriate to analyze a majority of the Some other race responses as being heavily influenced by the Hispanic population. There were 10,455 Some other race identified in 2010 in Allen County. As Table 1.13 indicates, 94 percent of these were Hispanic. See Appendix B for additional comments on answering race questions on the survey. Table 1.13 illustrates the census data from 1980 to 2010 as it pertains to the Hispanic population. The 23,093 Hispanics represent 6.5 percent of the Allen County population in Table 1.13 Hispanics and Race Breakdown Total Hispanic, Allen County 4,743 5,663 13,877 23,093 Identified Race as: White 2,557 5,965 9,864 Black or African American Asian American Indian and Alaska Native (AIAN) Native Hawaiian and Other Pacific Islander (NHPI) Some Other Race 6,154 9,798 2 or More 1,117 2,372 Other* 2,853 Note: Census questions and even the placement of questions concerning Hispanic ethnicity have changed over the years. Data prior to 2000 should be viewed with caution. * Other was a Census option before the recent set of racial categories was adopted (see Appendix B). The Hispanic population grew by 66.4 percent this decade in Allen County. Table 1.14 identifies the population by Census tract. Figure 1.9 identifies tracts with a significant percentage of Hispanic population, and Figure 1.10 identifies the changes in Hispanic concentrations since Pew Hispanic Center. Statistical Profiles of the Hispanic and Foreign Born Populations in the U.S. March 20, Retrieved from pewhispanic.org/reports/report.php?reportid=120 on March 8, 2011.
24 Population 22 Table 1.14 Persons of Hispanic Origin in Allen County By Census Tract, 2010 Census Tract Number Percentage Tract Number Percentage 44 1, % % % % % % % % % % % % 23 1, % % % % % % % % % % % % % % % % % % % % % % % % % % % % % % % % % % % % % % % % % % % % % % % % % % % % % % % % % % % % % % % % % % % % % % % % % % % % % % % % % % Note: Census Tracts and are excluded from analysis. See Appendix D.

25 Population 23 Figure 1.9
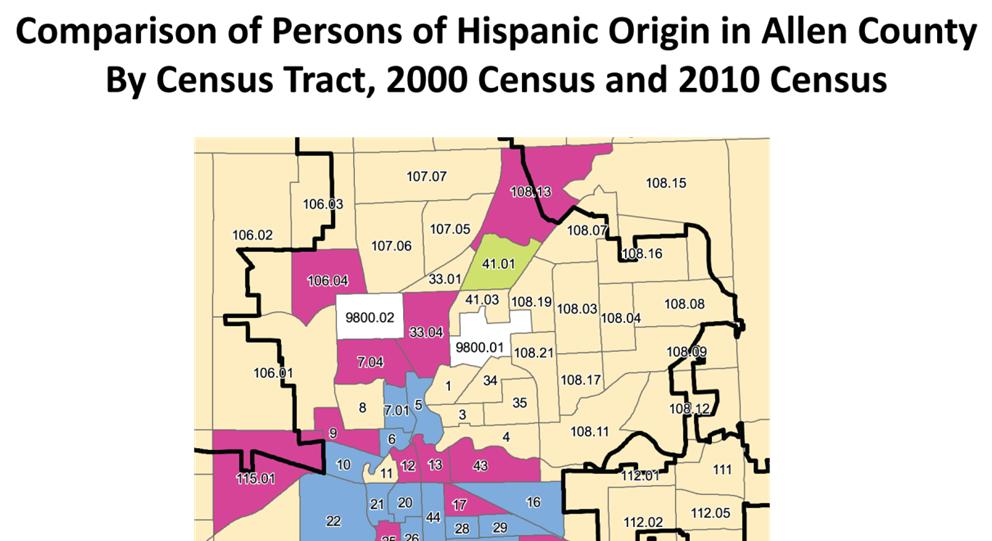
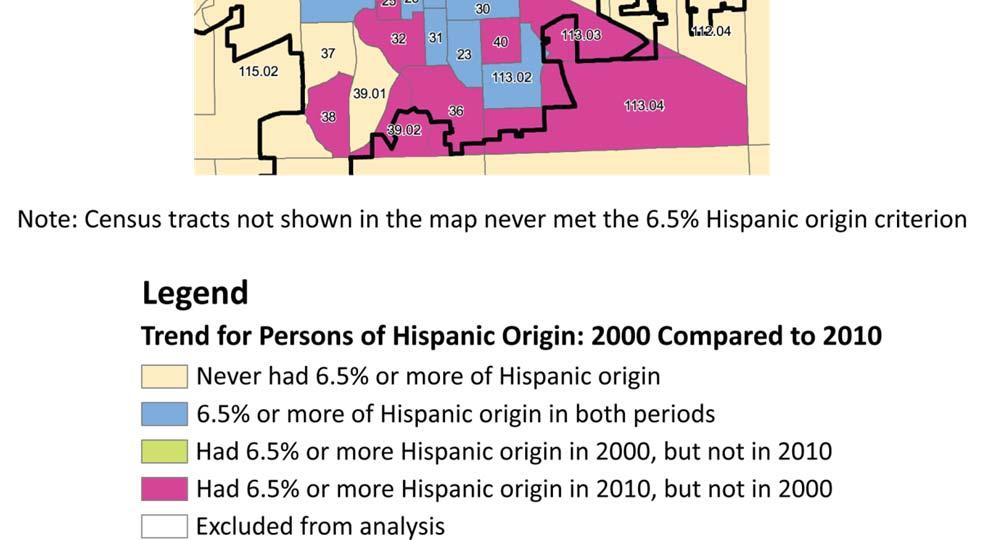
26 Population 24 Figure 1.10
27 Population 25 Age Allen County s population, along with most other populations in the state and nation, continues to age an impact of the baby boomers. The first baby boomer turned 64 in 2010, and the youngest baby boomers were 46 in that year. The median age in Allen County in 2010 was The median age of females was 36.4 in 2010, and was 34.3 for males (note that this is data corrected from the first release of the profile). The median age for Indiana was older at 37.0 years, and was 37.2 for the United States. The changes seen in median age over the past decades have finally seemed to have tapered off a little, as the median age only rose 1.2 years this decade, compared to an average 2.7 years each decade since More detailed data by median age is given later in this chapter (see Table 1.21). Table 1.15 Median Age in Allen County Year Median Age Table 1.16 identifies the location and concentration of young persons in Allen County, those age 17 and under. The largest numbers are found in the newer housing areas western Aboite township ( and ), the Huntertown and Leo Cedarville areas ( and ), census tract 109 near Woodburn (possibly an Amish influence in that area), and in census tract 23 in south central Fort Wayne. The higher concentrations are predominantly in south central Fort Wayne (CT 17,23,28,30, 44, 29) as well as one of the west Aboite census tracts. Table 1.17 identifies the location and concentration of those age 65 and older. Data on median age by race and ethnicity is in the section below Age and Race.
28 Population 26 Table 1.16 Seventeen or Under in Allen County by Census Tract, 2010 Census Tract Number Percentage Tract Number Percentage % , % 23 1, % , % % % , % , % 30 1, % % 44 1, % , % % , % 101 1, % % % % 26 1, % , % % , % , % , % , % , % , % % % % 109 2, % 34 1, % % % , % , % , % % , % % , % % , % % % , % , % 35 1, % % , % % % % % % % 32 1, % % , % % 36 1, % % , % % % % % % 22 1, % % , % , % % % % % % % % % , % % , % % % % % % , % % % % % % Note: Census Tracts and are excluded from analysis. See Appendix D.

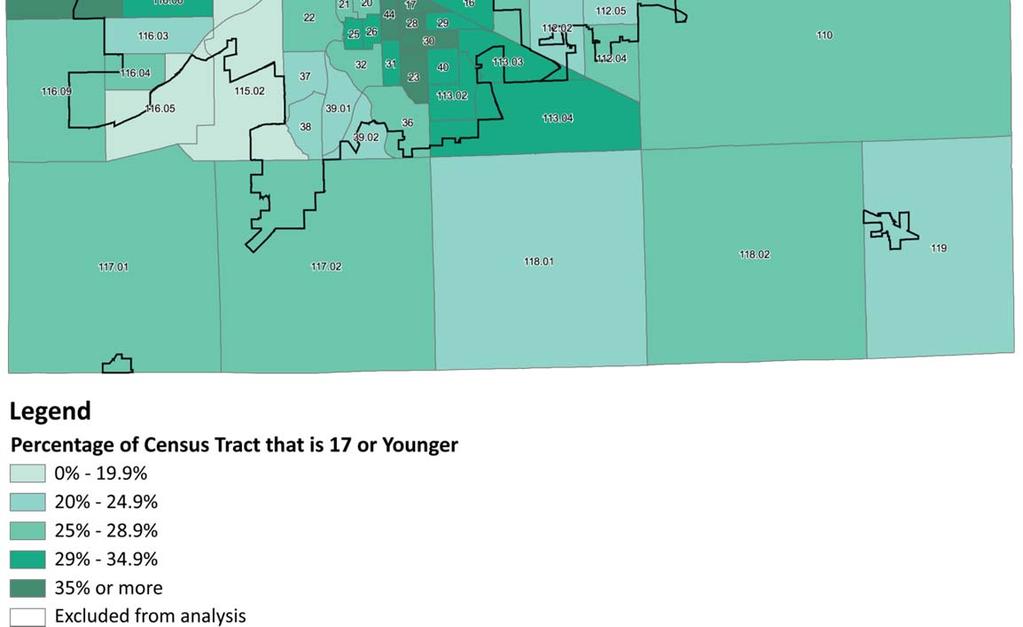
29 Population 27 Figure 1.11
30 Population 28 Table or Older in Allen County by Census Tract, 2010 Census Tract Number Percentage Tract Number Percentage % % % % % % % % % % % % % % % % % % % % % % % % % % % % % % % % % % % % % % % % % % % % % % % % % % % % % % % % % % % % % % % % % % % % % % % % % % % % % % % % % % % % % % % % % % % % % % Note: Census Tracts and are excluded from analysis. See Appendix D.

31 Population 29 Figure 1.12
32 Population 30 Age Distribution The distribution of Allen County s population by age class by census year is as follows: Table 1.18 Age Group Composition Age ,336 23,927 23,860 25,440 26, ,768 23,945 23,722 26,195 26, ,085 24,973 22,810 25,487 26, ,109 16,652 13,112 14,829 16, ,093 38,446 29,960 31,193 33, ,708 51,043 52,612 47,011 46, ,658 32,647 46,968 52,496 45, ,441 28,740 29,408 45,188 50, ,061 14,506 12,057 14,974 22, ,322 11,382 12,203 11,276 18, ,686 16,479 19,767 19,631 21, ,291 8,888 10,709 13,383 13, and over 1,897 2,707 3,648 4,746 6,243 Total 280, , , , ,329 The change in age group is shown in Table 1.19, and the change in age group as a percent of the total population is shown in Table It is interesting to note the flow of the baby boomers through the decades, both in numbers and changes in composition and changes from age group each census. Note too that although the numbers of the two younger population groups have increased from 2000 to 2010, these have decreased as a percent of the population, and in comparison to the prior decennial data, the rate of increase has slowed. Table 1.19 Change in Age Group from Prior Census Age % 0.8% 6.6% 4.3% % 0.5% 10.4% 2.3% % 9.0% 11.7% 3.9% % 22.0% 13.1% 8.9% % 22.8% 4.1% 7.4% % 3.7% 10.6% 0.4% % 45.8% 11.8% 12.8% % 0.1% 53.7% 11.1% % 17.2% 24.2% 51.2% % 7.8% 7.6% 62.0% % 22.2% 0.7% 11.5% % 19.7% 25.0% 4.6% 85 and over 42.7% 28.6% 30.1% 31.5% Total Change in Population 4.9% 2.2% 10.3% 7.1%
33 Population 31 Table 1.20 Age Group as a Percent of the Population Age % 8.1% 7.9% 7.7% 7.5% % 8.1% 7.9% 7.9% 7.5% % 8.5% 7.6% 7.7% 7.5% % 5.7% 4.4% 4.5% 4.5% % 13.1% 10.0% 9.4% 9.4% % 17.3% 17.5% 14.2% 13.2% % 11.1% 15.6% 15.8% 12.9% % 9.8% 9.8% 13.6% 14.1% % 4.9% 4.0% 4.5% 6.4% % 3.9% 4.0% 3.4% 5.1% % 5.6% 6.6% 5.9% 6.2% % 3.0% 3.6% 4.0% 3.9% 85 and over 0.7% 0.9% 1.2% 1.4% 1.8% Total 100.0% 100.0% 100.0% 100.0% 100.0% Chart 1.5 illustrates the age distribution by sex. All of the age groups are 10 year increments with the exception of the youngest and oldest populations. Chart 1.5 Age Distribution by Gender, 2010 Census 85 years and over 75 to 84 years 65 to 74 years 55 to 64 years 45 to 54 years 35 to 44 years 25 to 34 years 15 to 24 years 5 to 14 years Under 5 years 20.0% 15.0% 10.0% 5.0% 0.0% 5.0% 10.0% 15.0% 20.0% Males Females
34 Population 32 Race by Age The median age in Allen County in 2010 was The following table, 1.21, provides a view of the changing demographics over the past fifty years. The effect that the large population of baby boomers had on Allen County s median age is seen, as well as the median age differences in some of the different racial and ethnic groups in Allen County. Table 1.21 Median Age by Race and Hispanic Origin, Allen County, 2010 White, Allen White Not Black Asian AIAN NHPI County Hispanic Both Sexes Some Other Two or More Hispanic Male Female Table 1.22 Median Age by Race and Hispanic Origin, Allen County, Year Allen County White Black Asian AIAN NHPI Some Other Two or More Hispanic M/27.6F 18.2M/20.0F na na na na na na na na na na na na na na na na Note that some data from previous censuses is not available due to the methodology of race data collection, as explained in Appendix B. Dependency Ratios Sociologists use dependency ratios as a gross measure of the population who are dependent on the population who are employed. This affects a wide number of areas both at a national and local level, for example social security collections and disbursements, schools, health care, transportation, and even neighborhood upkeep. Although definitions vary, generally, a dependent is one who is younger than age 15 or older than age 64. Although The dependency ratio for Allen County data indicates that almost 30 percent of the persons older than age 64 to 74 are in the labor force (see chapter on Economic Well Being and Other Census Data ), this is a gross measure for comparison purposes. Allen County has been very stable the last four decades, although there has been a shift toward a higher older (or aged ) dependency rate and a smaller younger dependency rate, as shown in Table The Dependency Ratios by Census Tract are shown in Table Table 1.23 Age Group as a Percent of the Population Allen County Dependency Ratio 52.2% 53.3% 52.9% 52.3% Young Dependency 37.7% 35.8% 35.5% 34.2% Older Dependency 14.5% 17.5% 17.4% 18.1% Table 1.24 Comparison Dependency Ratios, 2010 Dependency Ratio Young Dependency Older Dependency Indiana 50.5% 30.9% 19.5% United States 49.0% 29.5% 19.4%
35 Population 33 Table 1.25 Dependency Ratio in Allen County by Census Tract, 2010 Census Tract Percentage Tract Percentage % % % % % % % % % % % % % % % % % % % % % % % % % % % % % % % % % % % % % % % % % % % % % % % % % % % % % % % % % % % % % % % % % % % % % % % % % % % % % % % % % % % % % % % % % % % % % % Note: Census Tracts and are excluded from analysis. See Appendix D.
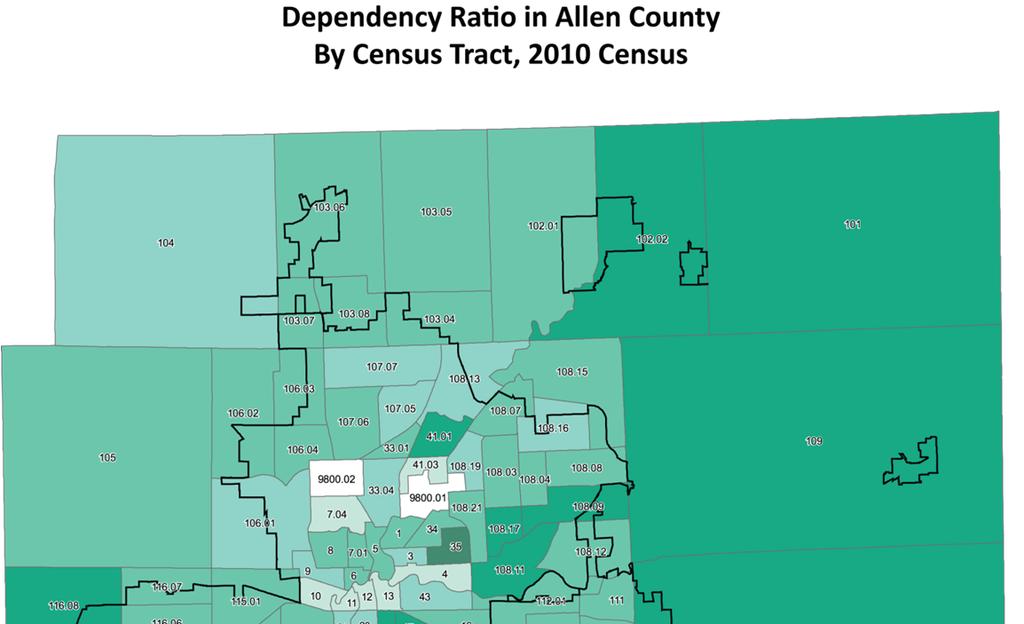
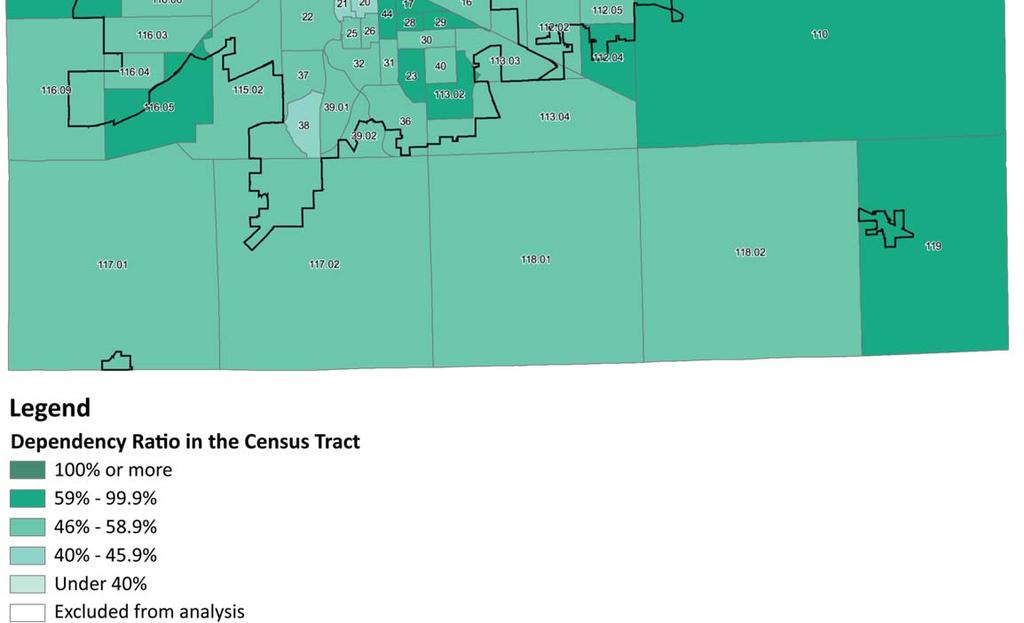
36 Population 34 Figure 1.13
37 Population 35 Dependency ratios by Race are shown in Table Dependency Ratios for the total Allen County population have been fairly consistent over the past forty years, although the trend has been toward a higher older dependency ratio and a lower ratio for the young population. As Allen County becomes more diverse, the dependency ratios by race give some insight into the age make up of the races in 2010, as shown in Table Table 1.26 Dependency Ratios by Race, Allen County, 2010 White, Allen Some Two or White Not Black Asian AIAN NHPI County Other More Hispanic Hispanic Dependency Ratio 52.3% 50.2% 49.7% 52.8% 51.4% 36.5% 30.3% 57.4% 129.2% 66.2% Young Dependency 34.2% 29.9% 28.9% 41.6% 44.5% 27.6% 27.6% 53.9% 124.2% 61.2% Older Dependency 18.1% 20.3% 20.7% 11.3% 6.9% 8.9% 2.8% 3.5% 4.9% 5.0% Population Projections Population projections for areas as small as counties cannot be reliably predicted. Even the closure of one major employer can cause unpredicted ramifications, or vice versa, the decision to locate a new company in Allen County that may employ a thousand people would impact the projections significantly. Projections for 2010 for Allen County done by state demographers prior to the 2000 Census were off by 20,000 people about 12 years later. When dealing with the near future, some projections are better, for example, the same group did a projection for Allen County in 2007 for 2010, and that projection was off by 5,000. Given this history, projections are not part of this report 6 with the exception of a discussion on age group projections. The following data is provided by Stats Indiana and the base year uses the 2010 Census data. Table 1.27 Population Projections for Allen County based on 2010 data Year Total Pre School 0 4 School Age 5 19 College Age Young Adult Older Adult Seniors * 355,329 26,524 79,545 23,380 92,609 91,134 42, ,731 27,251 80,072 24,469 93,785 92,570 49, ,731 28,175 81,488 24,056 96,363 90,730 58, ,546 28,837 83,118 24,671 98,620 87,629 68, ,134 29,036 85,436 24, ,818 86,352 75, ,342 29,233 87,216 25, ,263 87,995 79, ,573 29,628 88,269 26, ,346 90,865 81,322 *Not a projection, but based on Census data Seniors are projected to grow to be 19.3 percent of the county population by 2040 from 11.9 percent in This is a substantial change to the county population and carries with it all sort of implications, from tax bases to social services. 6 For those who want this data, see Indiana Business Research Center, Stats Indiana
38 Population 36 Table 1.28 Population Group as a Percentage of the Total Population Pre School 0 4 School Age 5 19 College Age Young Adult Older Adult Seniors % 22.4% 6.6% 26.1% 25.6% 11.9% % 21.8% 6.7% 25.5% 25.2% 13.5% % 21.5% 6.3% 25.4% 23.9% 15.5% % 21.2% 6.3% 25.2% 22.4% 17.5% % 21.2% 6.1% 25.1% 21.5% 18.9% % 21.2% 6.1% 24.9% 21.4% 19.3% % 22.4% 6.6% 26.1% 25.6% 11.9% Source: Indiana Business Research Center, by State Demographer Projected median age data by race, as released by the Indiana Business Research Center, is shown below for the state of Indiana. Typically, larger natural population rates are found in the population groups with younger median ages. Since Two or more is a relatively new designation, it is uncertain how future generations from those who are Two or more will classify their race. Note that the data behind Chart 1.6 is for the entire state of Indiana. The projected median age for Asians in Allen County may be younger given its unique mix of immigrants from Burmese with Asians from other areas, such as India, China, Philippines, Korea, and Vietnam. For example, Allen County s Asian population is 53 percent Other Asian, most likely Burmese and Laotians, compared with 19 percent of Indiana s Asian population being recorded as Other Asian. Given the different mix of Asians groups, it is possible that the median age of Asians in Allen County is different than that of Indiana. Chart 1.6 Projected Median Age by Race and Hispanic Origin for the State of Indiana American Indian White Asian Black HIspanic Two or More Races Selected Data on the Allen County Foreign Born Population Earlier in this chapter, we may have expressed some reservations that the American Community Survey will be able to paint a complete picture of Allen County residents at this time, especially in regard to those moving here from other countries. Additional information on the foreign born from other Census surveys is summarized in the
39 Population 37 paragraphs below. Some of this data may be from more recent ACS surveys in order that the most recent or most statistically significant data is given. Approximately 69 percent of all residents of Allen County were born in Indiana. Another 25 percent were born in another state (and over half of these are from a Midwestern state). One percent were born outside the United States in the U.S. Island Areas (American Samoa, Northern Mariana, Guam, US Virgin Islands) or in Puerto Rico, or born abroad of American parent(s), and 5.2 percent were foreign born. This is summarized Chart 1.7. Chart 1.7 Place of Birth for Allen County Residents Midwest State Other Than IN, 13.8% Hoosier Born, 68.8% Other US State, 11.3% Territories and Commonwealths, 1.0% Foreign Born, 5.2% Source: 2010 ACS Approximately 18,400 to 20,300 Allen County residents are foreign born. Of these foreign born, 60 percent are naturalized U.S. citizens. Of the foreign born, approximately 3,100 are under the age of 18. Of these 3,100 children, approximately 2,600 are school age, ages of Approximately 1,800 of these children may not speak English or may not speak English well. Approximately two thirds of these children who speak other languages than English are Asian, and approximately 28 percent speak Spanish. Another attempt at identifying the Asians who may have language problems is giving in Table We show the percentages rather than the numbers since the 2010 ACS has fewer Asians than the 2010 Census, which alerts us to the possibility that the Census still has to benchmark its ACS to the 2010 Census. By using those percentages, we arrive at 8,223 foreign born Asians in Allen County in By using the percentages, we calculate that the number not naturalized is 4,469. We know that naturalized citizens, in most cases, have to be able to speak and understand English. The reverse is not necessarily true that is, some non naturalized citizens may speak English, but at least we know it is less than 4,469. Table 1.29 Asians in Allen County by Age and Citizenship Status, 2010 ACS Under 18 years: 34.6% 18 years and older: 65.4% Of that age group, the percent who are native born 36.4% 4.3% Of that age group, the percent who are foreign born 63.6% 95.7% Of the foreign born, the percent who are naturalized U.S. citizens 33.6% 49.9%
Table 5 Population changes in Enfield, CT from 1950 to Population Estimate Total
 This chapter provides an analysis of current and projected populations within the Town of Enfield, Connecticut. A review of current population trends is invaluable to understanding how the community is
American Community Survey 5-Year Estimates
 DP02 SELECTED SOCIAL CHARACTERISTICS IN THE UNITED STATES 2012-2016 American Community Survey 5-Year Estimates Supporting documentation on code lists, subject definitions, data accuracy, and statistical
American Community Survey 5-Year Estimates
 DP02 SELECTED SOCIAL CHARACTERISTICS IN THE UNITED STATES 2011-2015 American Community Survey 5-Year Estimates Supporting documentation on code lists, subject definitions, data accuracy, and statistical
1 NOTE: This paper reports the results of research and analysis
 Race and Hispanic Origin Data: A Comparison of Results From the Census 2000 Supplementary Survey and Census 2000 Claudette E. Bennett and Deborah H. Griffin, U. S. Census Bureau Claudette E. Bennett, U.S.
Italian Americans by the Numbers: Definitions, Methods & Raw Data
 Tom Verso (January 07, 2010) The US Census Bureau collects scientific survey data on Italian Americans and other ethnic groups. This article is the eighth in the i-italy series Italian Americans by the
Census Pro Documentation
 Census Pro Documentation Introduction: Census Pro is our name for both our Census Demographics data, and our Data Extractor, which allows our clients to select just the data they need, in the format they
SELECTED SOCIAL CHARACTERISTICS IN THE UNITED STATES American Community Survey 5-Year Estimates
 DP02 SELECTED SOCIAL CHARACTERISTICS IN THE UNITED STATES 2010-2014 American Community Survey 5-Year Estimates Supporting documentation on code lists, subject definitions, data accuracy, and statistical
Census Response Rate, 1970 to 1990, and Projected Response Rate in 2000
 Figure 1.1 Census Response Rate, 1970 to 1990, and Projected Response Rate in 2000 80% 78 75% 75 Response Rate 70% 65% 65 2000 Projected 60% 61 0% 1970 1980 Census Year 1990 2000 Source: U.S. Census Bureau
Using Administrative Records and the American Community Survey to Study the Characteristics of Undercounted Young Children in the 2010 Census
 Using Administrative Records and the American Community Survey to Study the Characteristics of Undercounted Young Children in the 2010 Census Leticia Fernandez, Rachel Shattuck and James Noon Center for
Produced by the BPDA Research Division:
 Produced by the BPDA Research Division: Alvaro Lima Director Jonathan Lee Deputy Director Christina Kim Research Manager Phillip Granberry Senior Researcher/Demographer Matthew Resseger Senior Researcher/Economist
Quick Reference Guide
 U.S. Census Bureau Revised 07-28-13 Quick Reference Guide Demographic Program Comparisons Decennial Census o Topics Covered o Table Prefix Codes / Product Types o Race / Ethnicity Table ID Suffix Codes
Finding U.S. Census Data with American FactFinder Tutorial
 Finding U.S. Census Data with American FactFinder Tutorial Mark E. Pfeifer, PhD Reference Librarian Bell Library Texas A and M University, Corpus Christi mark.pfeifer@tamucc.edu 361-825-3392 Population
Environmental Justice Tool Guide
 Environmental Justice Tool Guide This document is intended to accompany the Environmental Justice section of MnDOT s Highway Project Development Process. This document provides additional guidance to steps
ESP 171 Urban and Regional Planning. Demographic Report. Due Tuesday, 5/10 at noon
 ESP 171 Urban and Regional Planning Demographic Report Due Tuesday, 5/10 at noon Purpose The starting point for planning is an assessment of current conditions the answer to the question where are we now.
Documentation for April 1, 2010 Bridged-Race Population Estimates for Calculating Vital Rates
 Documentation for April 1, 2010 Bridged-Race Population Estimates for Calculating Vital Rates The bridged-race April 1, 2010 population file contains estimates of the resident population of the United
Measuring Multiple-Race Births in the United States
 Measuring Multiple-Race Births in the United States By Jennifer M. Ortman 1 Frederick W. Hollmann 2 Christine E. Guarneri 1 Presented at the Annual Meetings of the Population Association of America, San
1980 Census 1. 1, 2, 3, 4 indicate different levels of racial/ethnic detail in the tables, and provide different tables.
 1980 Census 1 1. 1980 STF files (STF stands for Summary Tape File from the days of tapes) See the following WWW site for more information: http://www.icpsr.umich.edu/cgi/subject.prl?path=icpsr&query=ia1c
Demographics for Program Planning at YMCA Facilities: An Analysis of Selected 1980 Census Data
 University of Nebraska at Omaha DigitalCommons@UNO Publications Archives, 1963-2000 Center for Public Affairs Research Summer 1982 Demographics for Program Planning at YMCA Facilities: An Analysis of Selected
Redistricting San Francisco: An Overview of Criteria, Data & Processes
 Redistricting San Francisco: An Overview of Criteria, Data & Processes Karin Mac Donald Q2 Data & Research, LLC October 5, 2011 1 Criteria in the San Francisco Charter: Districts must conform to all legal
Handout Packet. QuickFacts o Frequently Asked Questions
 Census Data Immersion Infopeople Webinar August 7, 2012 Handout Packet QuickFacts o Frequently Asked Questions Demographic Program Tips o 2010 Decennial Census o Population Estimates Program (PEP) o American
THE EVALUATION OF THE BE COUNTED PROGRAM IN THE CENSUS 2000 DRESS REHEARSAL
 THE EVALUATION OF THE BE COUNTED PROGRAM IN THE CENSUS 2000 DRESS REHEARSAL Dave Phelps U.S. Bureau of the Census, Karen Owens U.S. Bureau of the Census, Mike Tenebaum U.S. Bureau of the Census Dave Phelps
The information you provide below will be used to create the legal Certificate of Death. The death certificate is a permanent document.
 Page 1 of 5 Form R-360A-09012014 Commonwealth of Massachusetts Department of Public Health Registry of Vital Records and Statistics Informant Worksheet for Certificate of Death The information you provide
2016 Census Bulletin: Age and Sex Counts
 2016 Census Bulletin: Age and Sex Counts Kingston, Ontario Census Metropolitan Area (CMA) The 2016 Census Day was May 10, 2016. On May 3, 2017, Statistics Canada released its second set of data from the
Twenty Year Forecasts of Population and Households, Louisville Economic Area
 Twenty Year Forecasts of Population and Households, Louisville Economic Area Economic Geography The U.S. Bureau of Economic Analysis (BEA) assigns every county in the nation to an economic area. BEA s
Welcome to: A Tour of Data Sources from the U.S. Census Bureau. Monday, October 19, :00 am 12:00 noon CT
 Welcome to: A Tour of Data Sources from the U.S. Census Bureau Monday, October 19, 2015 11:00 am 12:00 noon CT 1 Illinois Early Childhood Asset Map (IECAM) http://iecam.illinois.edu University of Illinois
An Overview of the American Community Survey
 An Overview of the American Community Survey Scott Boggess U.S. Census Bureau 2009 National Conference for Adult Education State Directors Washington, DC March 17, 2009 1 Overview What is the American
0-4 years: 8% 7% 5-14 years: 13% 12% years: 6% 6% years: 65% 66% 65+ years: 8% 10%
 The City of Community Profiles Community Profile: The City of Community Profiles are composed of two parts. This document, Part A Demographics, contains demographic information from the 2014 Civic Census
Follow your family using census records
 Census records are one of the best ways to discover details about your family and how that family changed every 10 years. You ll discover names, addresses, what people did for a living, even which ancestor
Victim Support volunteer demographic data April 2015-April 2016 v census data 2011
 volunteer demographic data April 2015-April 2016 v census data 2011 1 This document shows demographic data of volunteers. Data was taken from s internal workforce database. The report compares volunteer
Population and dwellings Number of people counted Total population
 Henderson-Massey Local Board Area Population and dwellings Number of people counted Total population 107,685 people usually live in Henderson-Massey Local Board Area. This is an increase of 8,895 people,
Population and dwellings Number of people counted Total population
 Whakatane District Population and dwellings Number of people counted Total population 32,691 people usually live in Whakatane District. This is a decrease of 606 people, or 1.8 percent, since the 2006
GTp- M.D. Zamojc, P. Eng., Commissioner of Environment, Transportation and Planning Services
 li;- Region d P d Wohkittq foh you GTp- REPORT General Committee For Information DATE: SUBJECT: FROM: HIGHLIGHTS FROM THE 2006 CENSUS AND PEEL DATA CENTRE UPDATE M.D. Zamojc, P. Eng., Commissioner of Environment,
My Tribal Area: Census Data Overview & Access. Eric Coyle Data Dissemination Specialist U.S. Census Bureau
 My Tribal Area: Census Data Overview & Access Eric Coyle Data Dissemination Specialist U.S. Census Bureau AGENDA Overview of Census Bureau Programs and Datasets available Census Geographies Ways to Access
Understanding the Census A Hands-On Training Workshop
 Understanding the Census A Hands-On Training Workshop Vanderbilt Census Information Center March 23, 2003 U.S. Census Bureau The world s largest and most comprehensive data collection and analysis organization!!!
Some Indicators of Sample Representativeness and Attrition Bias for BHPS and Understanding Society
 Working Paper Series No. 2018-01 Some Indicators of Sample Representativeness and Attrition Bias for and Peter Lynn & Magda Borkowska Institute for Social and Economic Research, University of Essex Some
The Demographic situation of the Traveller Community 1 in April 1996
 Statistical Bulletin, December 1998 237 Demography The Demographic situation of the Traveller Community 1 in April 1996 Age Structure of the Traveller Community, 1996 Age group Travellers Total Population
Aboriginal Demographics. Planning, Research and Statistics Branch
 Aboriginal Demographics From the 2011 National Household Survey Planning, Research and Statistics Branch Aboriginal Demographics Overview 1) Aboriginal Peoples Size Age Structure Geographic Distribution
Scenario 5: Family Structure
 Scenario 5: Family Structure Because human infants require the long term care and nurturing of adults before they can fend for themselves in often hostile environments, the family in some identifiable
Learning to Use the ACS for Transportation Planning Report on NCHRP Project 8-48
 Learning to Use the ACS for Transportation Planning Report on NCHRP Project 8-48 presented to TRB Census Data for Transportation Planning Meeting presented by Kevin Tierney Cambridge Systematics, Inc.
2016 Election Impact on Cherokee County Voter Registration
 2016 Election Impact on Cherokee County Voter Registration Frank Schieber, Future Campaign Manager August 14, 2017 Project Goals Does it matter whether Cherokee County, Georgia voter registration reflects
Proceedings of the Annual Meeting of the American Statistical Association, August 5-9, 2001
 Proceedings of the Annual Meeting of the American Statistical Association, August 5-9, 2001 COVERAGE MEASUREMENT RESULTS FROM THE CENSUS 2000 ACCURACY AND COVERAGE EVALUATION SURVEY Dawn E. Haines and
Virginia Employment Commission
 Small-Area Data and Graphs for Lancaster County Virginia Employment Commission 703 East Main Street Richmond, Virginia 23219 Tel: (804) 786-8223 www.virginialmi.com Last updated: 2/6/2017 2:03:07 PM Table
INTEGRATED COVERAGE MEASUREMENT SAMPLE DESIGN FOR CENSUS 2000 DRESS REHEARSAL
 INTEGRATED COVERAGE MEASUREMENT SAMPLE DESIGN FOR CENSUS 2000 DRESS REHEARSAL David McGrath, Robert Sands, U.S. Bureau of the Census David McGrath, Room 2121, Bldg 2, Bureau of the Census, Washington,
Finding and Using Census Data
 Finding and Using Census Data An Informational Session Presented for: 2015 CityMatCH Annual Urban MCH Leadership Conference Tuesday September 29, 2015 David Drozd, M.S. Center for Public Affairs Research
population and housing censuses in Viet Nam: experiences of 1999 census and main ideas for the next census Paper prepared for the 22 nd
 population and housing censuses in Viet Nam: experiences of 1999 census and main ideas for the next census Paper prepared for the 22 nd Population Census Conference Seattle, Washington, USA, 7 9 March
Claritas Demographic Update Methodology
 Claritas Demographic Update Methodology 2006 by Claritas Inc. All rights reserved. Warning! The enclosed material is the intellectual property of Claritas Inc. (Claritas is a subsidiary of VNU, a global
THE AP-GfK POLL August, 2012
 THE AP-GfK POLL August, 2012 Conducted by GfK Roper Public Affairs & Corporate Communications A telephone survey of the American general population (ages 18+) Interview dates: August 16 20, 2012 Number
Census Data Determines Who Gets $300 Billion Annually Are You Getting Your Share?
 Census Data Determines Who Gets $300 Billion Annually Are You Getting Your Share? Hartford Foundation for Public Giving November 13, 2009 Jim Palma, Partnership Specialist Hartford Local Census Office
2016 Census Bulletin: Families, Households and Marital Status
 2016 Census Bulletin: Families, Households and Marital Status Kingston, Ontario Census Metropolitan Area (CMA) The 2016 Census Day was May 10, 2016. On August 2, 2017, Statistics Canada released its fourth
New Mexico Demographic Trends in the 1990s
 New Mexico Demographic Trends in the 1990s WATER, GROWTH AND SUSTAINABILITY: PLANNING FOR THE 21ST CENTURY DECEMBER NEW MEXICO WATER RESOURCES RESEARCH INSTITUTE 2000 Jim Peach is a professor of economics
Census Data for Transportation Planning
 Census Data for Transportation Planning Transitioning to the American Community Survey May 11, 2005 Irvine, CA 1 Design Origins and Early Proposals Concept of rolling sample design Mid-decade census Proposed
Visible Minority and Population Group Reference Guide
 Catalogue no. 98-500-X2016006 ISBN 978-0-660-05512-1 Census of Population Reference Guide Visible Minority and Population Group Reference Guide Census of Population, 2016 Release date: October 25, 2017
How It Works and What s at Stake for Massachusetts. Wednesday, October 24, :30-10:30 a.m.
 How It Works and What s at Stake for Massachusetts Wednesday, October 24, 2018 8:30-10:30 a.m. The Original 1790 Census 1. Name of the head of the family 2. # of free white males16 y.o.+ 3. # of free
Ensuring an Accurate Count of the Nation s Latinos in Census 2020
 Ensuring an Accurate Count of the Nation s Latinos in Census 2020 February 15, 2018 Arturo Vargas Executive Director NALEO Educational Fund ARTICLE I, SECTION 2 Representatives and direct Taxes shall be
The Unexpectedly Large Census Count in 2000 and Its Implications
 1 The Unexpectedly Large Census Count in 2000 and Its Implications Reynolds Farley Population Studies Center Institute for Social Research University of Michigan 426 Thompson Street Ann Arbor, MI 48106-1248
National Population Estimates: March 2009 quarter
 Image description. Hot Off The Press. End of image description. Embargoed until 10:45am 15 May 2009 National Population Estimates: March 2009 quarter Highlights The estimated resident population of New
Virginia Employment Commission
 Small-Area Data and Graphs for New Kent County Virginia Employment Commission 703 East Main Street Richmond, Virginia 23219 Tel: (804) 786-8223 www.virginialmi.com Last updated: 2/6/2017 2:25:29 PM Table
Introduction. Uses of Census Data
 Introduction The 2020 Census will produce statistics that are used by governments, non-profit organizations and the private sector and the results of the 2020 Census will have implications for a decade.
Virginia Employment Commission
 Small-Area Data and Graphs for Mecklenburg County Virginia Employment Commission 703 East Main Street Richmond, Virginia 23219 Tel: (804) 786-8223 www.virginialmi.com Last updated: 2/6/2017 2:24:09 PM
Demystifying Census Data. Legislative Research Librarians September 18, 2013 Boise, Idaho
 Demystifying Census Data Legislative Research Librarians September 18, 2013 Boise, Idaho 1 Agenda Demographic programs Census geography Race and ethnicity Accessing the data Tips: Presenting the data Topic-driven
City of Richmond 2000 Census Data Report # Household Change by Census Tract
 City of Richmond 2000 Census Data Report #6 1990-2000 Household Change by Census Tract Prepared by Department of Community Development Division of Comprehensive Planning January 2002 Introduction The City
Event History Calendar (EHC) Between-Wave Moves File. Codebook
 Between-Wave Moves File. Codebook") 2325 Event History Calendar (EHC) BetweenWave Moves File Codebook Number of Variables 23 Thursday July 2 28 4:5 PM 2325 Event History Calendar (EHC) BetweenWave Moves File EHCV "RELEASE NUMBER" NUM(.)
2325 Event History Calendar (EHC) BetweenWave Moves File Codebook Number of Variables 23 Thursday July 2 28 4:5 PM 2325 Event History Calendar (EHC) BetweenWave Moves File EHCV "RELEASE NUMBER" NUM(.)
Employer Location file. Codebook
 232 Employer Location file Codebook Number of Variables 2 Wednesday July 8 28 :9 PM 232 Employer Location file EMPV "RELEASE NUMBER" NUM(.) Release number Release : 7/28, SAS proc geocode and proc ginside
U.S. Census Bureau. Measuring America: People, Places, and Our Economy. Community Analysis Workshop. Armando Mendoza Data Dissemination Specialist
 U.S. Census Bureau Measuring America: People, Places, and Our Economy Community Analysis Workshop Armando Mendoza Data Dissemination Specialist U.S. Census Bureau September 21, 2017 Hello, I am Armando
Geog 3340: Census Basics
 Geog 3340: Census Basics About the US Census Bureau Mandated by the U. S. Constitution to count the population Used: to apportion seats in the U.S. House of Representatives to define legislature districts,
Variance Estimation in US Census Data from Kathryn M. Coursolle. Lara L. Cleveland. Steven Ruggles. Minnesota Population Center
 Variance Estimation in US Census Data from 1960-2010 Kathryn M. Coursolle Lara L. Cleveland Steven Ruggles Minnesota Population Center University of Minnesota-Twin Cities September, 2012 This paper was
In-Office Address Canvassing for the 2020 Census: an Overview of Operations and Initial Findings
 In-Office Address Canvassing for the 2020 Census: an Overview of Operations and Initial Findings Michael Commons Address and Spatial Analysis Branch Geography Division U.S. Census Bureau In-Office Address
GRAPH P-1: YEARS OF LIFE EXPECTANCY AT BIRTH, FLORIDA AND UNITED STATES, CENSUS YEARS AND YEAR
 Population CHART P-1: YEARS OF LIFE EXPECTANCY AT BIRTH, BY RACE, ETHNICITY, AND GENDER, FOR FLORIDA RESIDENTS AND UNITED STATES, CENSUS YEARS 1970-2000 AND 2004-2014 FLORIDA UNITED STATES 1 1 2 WHITE
Census Data for Grant Writing Workshop Cowlitz-Wahkiakum Council of Governments. Heidi Crawford Data Dissemination Specialist U.S.
 Census Data for Grant Writing Workshop Cowlitz-Wahkiakum Council of Governments Heidi Crawford Data Dissemination Specialist U.S. Census Bureau Agenda Welcome and Introductions Overview of Census Data
1) Analysis of spatial differences in patterns of cohabitation from IECM census samples - French and Spanish regions
 Analysis of spatial differences in patterns of cohabitation from IECM census samples - French and Spanish regions") 1 The heterogeneity of family forms in France and Spain using censuses Béatrice Valdes IEDUB (University of Bordeaux) The deep demographic changes experienced by Europe in recent decades have resulted
1 The heterogeneity of family forms in France and Spain using censuses Béatrice Valdes IEDUB (University of Bordeaux) The deep demographic changes experienced by Europe in recent decades have resulted
Who s in Your Neighborhood? Using the American FactFinder. Salma Abadin and Carrie Koss Vallejo Data You Can Use
 Who s in Your Neighborhood? Using the American FactFinder Salma Abadin and Carrie Koss Vallejo Data You Can Use www.datayoucanuse.org Learning Objectives Learn what American FactFinder is and is not Become
Urban and rural migration
 Image description. Hot Off The Press. End of image description. Internal Migration Urban and rural migration Population change Population change has been higher for main urban s, and for rural and other
1981 CENSUS COVERAGE OF THE NATIVE POPULATION IN MANITOBA AND SASKATCHEWAN
 RESEARCH NOTES 1981 CENSUS COVERAGE OF THE NATIVE POPULATION IN MANITOBA AND SASKATCHEWAN JEREMY HULL, WMC Research Associates Ltd., 607-259 Portage Avenue, Winnipeg, Manitoba, Canada, R3B 2A9. There have
Notes on the 2014 ACS 5-Year Estimates
 Notes on the 2014 ACS 5-Year Estimates Eric Guthrie, Michigan s State Demographer December 3, 2015 The U.S. Census Bureau has released the 2014 American Community Survey (ACS) 5-year estimates. The 5-year
Dallas Regional Office US Census Bureau
 The Census Bureau: Important Data Products for Every Community Paula Wright, Information Services Specialist Suzee Privett, Information Services Assistant Willie DeBerry, Partnership Specialist Lacey Loftin,
REVISED - Census Tract Measures for Fragile Families Mothers and Fathers at Baseline. September 16, 2005
 REVISED - Census Tract Measures for Fragile Families Mothers and Fathers at Baseline September 16, 2005 The ffgeo_0b5.dta file contains tract-level census data for the tracts where the Fragile Families
County Profiles Introduction. Introduction 1/17/2013. A compendium of Demographic, Housing, Education, Economic, and Agricultural Data
 County Profiles 2013 A compendium of Demographic, Housing, Education, Economic, and Agricultural Data Jan K. Vink and Joe D. Francis Nij Tontisirin, Sutee Anantsuksomsri and Johannes Plambeck Introduction
2014 County and Economic Development Regions Population Estimates
 214 County and Economic Development Regions Population Estimates Analysis of the US Census Bureau Vintage 214 Total County Population Estimates Jan K. Vink Program on Applied Demographics Cornell University
What does the 2016 census reveal about Pacific Islands communities in Australia?
 Devpolicy Blog from the Development Policy Centre Australian aid PNG and the Pacific Global development policy http://www.devpolicy.org What does the 2016 census reveal about Pacific Islands communities
Acquiring and Using New Census Data to Understand Service Area, Gaps, and Need
 Acquiring and Using New Census Data to Understand Service Area, Gaps, and Need Agenda What types of Census data are available? Decennial, ACS, other we want mention today. Getting Census Data From American
National Population Estimates: June 2011 quarter
 National Population Estimates: June 2011 quarter Embargoed until 10:45am 12 August 2011 Highlights The estimated resident population of New Zealand was 4.41 million at 30 June 2011. Population growth was
PSC. Research Report. The Unexpectedly Large Census Count in 2000 and Its Implications P OPULATION STUDIES CENTER. Reynolds Farley. Report No.
 Reynolds Farley The Unexpectedly Large Census Count in 2000 and Its Implications Report No. 01-467 Research Report PSC P OPULATION STUDIES CENTER AT THE INSTITUTE FOR SOCIAL RESEARCH U NIVERSITY OF MICHIGAN
National Longitudinal Study of Adolescent Health. Public Use Contextual Database. Waves I and II. John O.G. Billy Audra T. Wenzlow William R.
 National Longitudinal Study of Adolescent Health Public Use Contextual Database Waves I and II John O.G. Billy Audra T. Wenzlow William R. Grady Carolina Population Center University of North Carolina
How Will the Changing U.S. Census Affect Decision-Making?
 How Will the Changing U.S. Census Affect Decision-Making? David A. Swanson University of California Riverside David.swanson@ucr.edu Prepared for the Lewis Seminar May 15, 2008 ACKNOWLEDGMENTS In addition
Lowndes County by the Numbers
 Lowndes County by the Numbers How Do We Compare With Peer and Aspirant Communities? 2011 Report DRAFT 05/06/2011 Insert a collage of blended pictures from around Valdosta This report has been prepared
An Introduction to ACS Statistical Methods and Lessons Learned
 An Introduction to ACS Statistical Methods and Lessons Learned Alfredo Navarro US Census Bureau Measuring People in Place Boulder, Colorado October 5, 2012 Outline Motivation Early Decisions Statistical
Using 2010 Census Coverage Measurement Results to Better Understand Possible Administrative Records Incorporation in the Decennial Census
 Using Coverage Measurement Results to Better Understand Possible Administrative Records Incorporation in the Decennial Andrew Keller and Scott Konicki 1 U.S. Bureau, 4600 Silver Hill Rd., Washington, DC
Become a 2010 Census Partner
 State and Local Governments Become a 2010 Census Partner In 2010, the U.S. Census Bureau will issue a call to action for every resident of our nation: Be Counted. The 2010 Census is important. It determines
Understanding and Using the U.S. Census Bureau s American Community Survey
 Understanding and Using the US Census Bureau s American Community Survey The American Community Survey (ACS) is a nationwide continuous survey that is designed to provide communities with reliable and
AN EVALUATION OF THE 2000 CENSUS Professor Eugene Ericksen Temple University, Department of Sociology and Statistics
 SECTION 3 Final Report to Congress AN EVALUATION OF THE 2000 CENSUS Professor Eugene Ericksen Temple University, Department of Sociology and Statistics Introduction Census 2000 has been marked by controversy
2016 Census Profile on the Town of Richmond Hill
 2016 Census Profile on the Town of Richmond Hill Release #3: Families, households and marital status, and language Every 5 years, Statistics Canada (on behalf of the Government of Canada) undertakes a
Working with United States Census Data. K. Mitchell, 7/23/2016 (no affiliation with U.S. Census Bureau)
") Working with United States Census Data K. Mitchell, 7/23/2016 (no affiliation with U.S. Census Bureau) Outline Types of Data Available Census Geographies & Timeframes Data Access on Census.gov website
Working with United States Census Data K. Mitchell, 7/23/2016 (no affiliation with U.S. Census Bureau) Outline Types of Data Available Census Geographies & Timeframes Data Access on Census.gov website
Children are a declining share of the population in the vast majority of New Orleans neighborhoods.
 The Loss of Children from New Orleans Neighborhoods Allison Plyer and Elaine Ortiz, Greater New Orleans Community Data Center Released: February 10, 2011 Children under 18 are a declining share of the
Rental and O wner- Occupied Housing Demand, Rolf Pendall Urban Institute
 Rental and O wner- Occupied Housing Demand, 2010-2030 Rolf Pendall Urban Institute Middle-class housing on Grove Avenue: https:/ / en.m.wikipedia.org/ wiki/ West_Hill,_Albany,_New_York#/ media / File%3AAlbany_Houses.jpg
Inuit Research Comes to the Fore
 Western University Scholarship@Western Aboriginal Policy Research Consortium International (APRCi) 2006 Inuit Research Comes to the Fore Robert M. Bone Follow this and additional works at: http://ir.lib.uwo.ca/aprci
Census Of Population 1971, Fertility Tables, Northern Ireland By Northern Ireland
 Census Of Population 1971, Fertility Tables, Northern Ireland By Northern Ireland Religious Affiliation and Demographic Variability - the religious breakdown of the Protestant population (Northern Ireland
Rewriting an All-Too-Familiar Story? The 2009 Hollywood Writers Report
 Rewriting an All-Too-Familiar Story? The 2009 Hollywood Writers Report The 2009 Hollywood Writers Report updates an all-too-familiar story about the challenges faced by diverse writers on the employment
2045 FAMPO Constrained Long Range Transportation Equity Analysis
 2045 FAMPO Constrained Long Range Transportation Equity Analysis Table of Contents Title VI Nondiscrimination Statement... 2 I. A Brief History of Environmental Justice... 3 II. Methodology... 4 III. Results...
The American Community Survey and the 2010 Census
 Portland State University PDXScholar Publications, Reports and Presentations Population Research Center 3-2011 The American Community Survey and the 2010 Census Robert Lycan Portland State University Charles
Census Records, City Directories, Maps
 This is a very high-level explanation of the complex topic, census records. An excellent source of detailed information can be found in The Source, A Guidebook of American Genealogy, Loretto Dennis Szucs,