Data Analysis. (1) Page #16 34 Column, Column (Skip part B), and #57 (A S/S)
|
|
|
- Martha Meryl Wood
- 5 years ago
- Views:
Transcription
1 H Algebra 2/Trig Unit 9 Notes Packet Name: Period: # Data Analysis (1) Page #16 34 Column, Column (Skip part B), and #57 (A S/S) (2) Page #17 32 Column, Column (Skip part B), and #60 (A S/S) (3) Page #25 49 Column, Column (Skip part B), and #70, 71 (G S/S) (4) Page #26 50 Column, Column (Skip part B), and #72, 73 (G S/S) (5) Collecting Data and Drawing Conclusions - Worksheet (6) Collecting Data and Drawing Conclusions - Worksheet (7) Line of Best Fit - Worksheet (8) Summary Statistics - Worksheet (9) Summary Statistics - Worksheet (10) Reading Graphs - Worksheet (11) Page #15-35 Column and #55, 56 and 57 (FCP and P) (12) Page #18-30 Column, #47 50 (Combinations) (13) Permutations and Combinations - Worksheet (14) Probability and Odds - Worksheet (15) Page #16-39 Column, #42 and 43 (Probability of Compound Events) (16) Page #18-40 Column, #44 46 (Probability of Compound Events) (17) Page 734 #1 11 all (Probability of Independent and Dependent Events) (18) Page #12 24 all (Probability of Independent and Dependent Events) (19) Two Way Tables and Probability - Worksheet (20) Review packet for test tomorrow 1
2 Sequences and Series General Information You can think of a as a function whose domain is a set of consecutive integers. If a domain is not specified, it is understood that the domain starts with 1. Finite sequences are ones that end. Infinite sequences continue without stopping. When the terms of a sequence are added, the resulting expression is a. A series can either be infinite or finite. You can use (aka sigma notation) to write a series 11.2 Arithmetic Sequences and Series (stress applications) (I/2) In an, the difference between consecutive terms is constant. The constant difference is called the and is denoted by d. (E1.) Decide whether each set is arithmetic. (a) -3, 1, 5, 9, 13, (b) 2, 5, 10, 17, 26, (P1.) Decide whether each set is arithmetic. (a) -10, -6, -2, 0, 2, 6, 10, (b) 5, 11, 17, 23, 29, The nth term of an arithmetic sequence with first term a 1 and common difference d is given by: a n = a 1 + (n 1)d Key: a 1-1 st term in the series or sequence n - location of a term in a series or sequence r - common ratio Σ- summation notation a n - nth term in the series or sequence d - common difference S n - sum of the 1 st to the nth term of a series *****To write a rule for the nth term in an arithmetic sequence, you must find a 1 and d.***** (E2.) (a) Write a rule for the nth term of the sequence 50, 44, 38, 32, (b) Then find a 20 (P2.) (a) Write a rule for the nth term of the sequence 32, 47, 62, 77, (b) Then find a 12 2
3 (E3.) One term of an arithmetic sequence is a 13 = 30. The common difference is d = 3. Write a rule for 2 the nth term. (P3.) One term of an arithmetic sequence is a 8=50. The common difference is d =.25. Write a rule for the nth term. The expression formed by adding the terms of an arithmetic sequence is called an arithmetic series. The sum of the first n terms of an arithmetic sequence is denoted by S n. The Sum of a Finite Arithmetic Series The sum of the first n terms of an arithmetic series is: S n = n( a 1+a n ) 2 In words, S n is the mean of the first nth terms, multiplied by the number of terms. (E4.) Consider the arithmetic series Find the sum of the first 30 terms. (P4.) Consider the arithmetic series Find the sum of the first 25 terms. (E5.) The first row of a concert hall has 25 seats, and each row after the first one has one more seat than the row before it. There are 32 rows of seats. Write a rule for the number of seats in the nth row (P5.) A construction company is laying a natural gas pipeline. Several sections of pipe have been laid in a pile at the construction site. There are 12 sections of pipe in the bottom row of the pile. Each row has 3
4 one less pipe than the row below it. There are 8 rows of pipe. Write a rule for the number of pipe sections in the nth row. (E6.) The first row of a concert hall has 25 seats, and each row after the first one has one more seat than the row before it. There are 32 rows of seats. What is the total number of seats in the concert hall? (P6.) A construction company is laying a natural gas pipeline. Several sections of pipe have been laid in a pile at the construction site. There are 12 sections of pipe in the bottom row of the pile. Each row has one less pipe than the row below it. There are 8 rows of pipe. What is the total number of pipe sections in the pile? (E7.) Find the sum of the series 10 (2 + i) i=1 (P7.) Find the sum of the series 15 3 i i=1 4
5 11.3 Geometric Sequences and Series (stress applications) (I/2) In a, the ratio of any term to the previous term is constant. This constant ratio is called the common ratio and is denoted by r. (E1.) Decide whether each sequence is geometric. (a) 1, 2, 6, 24, 120, (b) 81, 27, 9, 3, 1, (P1.) Decide whether each sequence is geometric. (a) 4, -8, 16, -32, (b) 3, 9, -27, -81, -243, Rule for a Geometric Sequence The nth term of a geometric sequence with the first term a 1 and common ratio, r, is given by: a n = a 1 (r) (n 1) (E2.) (a) Write a rule for the nth term of the sequence -8, -12, -18, -27, (b) Find a 8 (P2.) (a) Write a rule for the nth term of the sequence 5, 2, 0.8, (b) Find a 8 (E3.) One term of a geometric sequence is a 3 = 5. The common ratio is r = 2. Write a rule for the nth term. (P3.) One term of a geometric sequence is a 4 = 3. The common ratio is r = 3. Write a rule for the nth term. 5
6 The expression formed by adding the terms of a geometric sequence is called a. As with an arithmetic series, the sum of the first n terms of a geometric series is denoted by S n. The Sum of a Finite Geometric Series with Common Ratio r 1 is: s n = a 1 ( 1 rn 1 r ) (E4.) Consider the geometric series Find the sum of the first 10 terms. (P4.) Consider the geometric series Find the sum of the first 10 terms. 2 (E5.) In 1990 the average monthly bill for cellular telephone service in the United States was $ From 1990 through 1997, the average monthly bill decreased by about 8.6% per year. Source: Statistical Abstract of the United States. Write a rule for the average monthly cellular telephone bill a n (in dollars) in terms of the year. Let n = 1 represent (P5.) You buy a new car for $25,000. The value of the car decreases by 16% each year? Write a rule for the average yearly value of the car a n (in dollars) in terms of the year. Let n = the current year. (E6.) Find the sum of the series 10 2(2) i 1 i=1 (P6.) Find the sum of the series 12 3(4) i 1 i=1 6
7 Appendix 3: Collecting Data and Drawing Conclusions Vocabulary (I/2) : Facts, observations and information that come from investigations. (aka measurement data) data that has arithmetic calculations (i.e. test scores, weight) (aka categorical data) data that is organized into different groups (i.e. males/females, favorite class) : a description of a group based the data of an population : the total set of observations that can be made Example: 10% of US senators voted for a particular measure. (there are only 100 senators) : a description of a group based on the data of a population : a small portion of the entire population : the number of people in a population surveyed : a sample in which each individual is chosen entirely by chance and each member of the population has an equal chance of being included : a sample that is not a sample. It is a sample collected in such a way that some members of the intended population are less likely to be included than others Statistic or Parameter? Example: 30% of dog owners scoop poop after their dog. (E1.) 45% of Jacksonville, FL residents report that they have been to at least one Jaguars game. (E2.) 40% of 1,211 students at a particular elementary school got below a 3 on a standardized test. (E3.) 33% of 120 workers at a particular bike factory were paid less than $20,000 per year. (E4.) 60% of US residents agree with the latest health care proposal. 7
8 A statistic is an based on a population. This inference comes with a level of uncertainty. Statisticians account for this uncertainty using a variety of concepts including,, and of. : a projected range in which the actual results of a statistic should fall. The range is derived using a and a of. The confidence level is somewhat arbitrary and most commonly represented as 90%, 95% and 99%. As the margin of error increases the confidence level increases. The margin of error is expressed as +/- percent. ***You will learn to calculate a confidence interval in AP Stat and/or Stat*** (E5.) A sample of students was selected to answer a survey question changes to the athletic program. The results showed that 72% of the students agreed with the change with a margin of error of 4%. Find the upper and lower bounds of the confidence interval. (E6.) A poll found a confidence interval of 20% to 26% of county residences approve of a proposed bill. Identify the center of the interval. Identify the margin of error of the interval. (E7.) 20% of students surveyed reported that they applied to Penn State. The margin of error is 2%. Find the upper and lower bounds of the confidence interval. 8
")
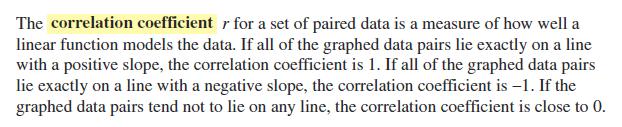
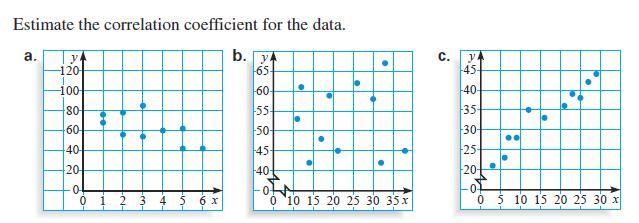
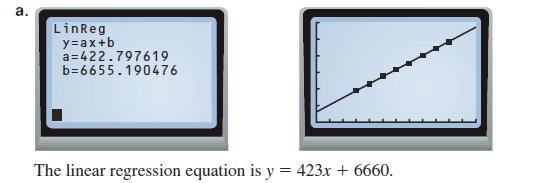
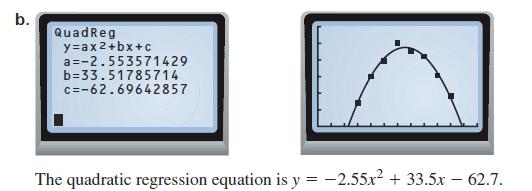
9 Appendix 2: Line Of Best Fit; Correlation; Making Predictions (R/1) (E1). 9
 (E4.) 7.")
10 (E2.) (E3.) (E4.) 7.7 Summary Statistics (R,E/3) 10
11 General Knowledge basic terminology and notation used while calculating summary statistics Data Points (n) the number of points in a set found by counting the number of points in the set Lower Quartile (Q 1 ) the 25 th percentile and is found by locating the median of the lower half of the data Upper Quartile (Q 3 ) the 75 th percentile and is found by locating the median of the upper half of the data Minimum Value (minx) the lowest value in a set of data Maximum Value (maxx) the highest value in a set of data Deviation (not generated by the calculator) the difference between each data point and the mean Outliers (not generated by the calculator) an extreme value that is more than 1.5 times the interquartile range (IQR) beyond Q 1 or Q 3. All potential outliers are all values outside of the fences : Q 1 1.5IQR and Q IQR 5-Number Summary: This summary includes the minimum, first quartile, median, third quartile and maximum Measures of Central Tendency - A number meant to convey the idea of centralness for a data set. The most commonly used measures of central tendency are the mean, median and mode. Mean (x ) the arithmetic average of the data set. It is calculated by summing all of the data points and then dividing by the number of data points. Median (Med) the 50 th percentile. It is found by locating the center data point. If there are an even number of data points. There will then be two center data points. In this case, find the median by averaging the two center data points. Mode (not generated by the calculator) the data point that occurs the most frequently. Measures of Variability - A number that is meant to convey the idea of spread for a set of data Range (not generated by the calculator) - Maximum value minus the minimum value Interquartile Range (not generated by calculator) - measures the spread of the middle 50 percent of an ordered data set. It is found by Q 3 Q 1 Variance (not generated by the calculator) - the average* of the squares of the deviations of the data from their mean. It is also referred to as the square of the standard deviation and denoted s 2. Standard Deviation (Sx) - It is a measure of how spread out or varied the data is. It is found by taking the square root of the variance and denoted s 11
12 (E1.) Geometry Unit 1 Test Scores {81, 77, 91, 90, 99, 92, 92, 84, 82, 27, 83, 99, 90, 79.5, 88.5, 76, 70, 99, 85, 56, 56, 50} Mean: Mode: Median: Minimum: Maximum: Quartile 1: Quartile 3: IQR: Range: Variance: Standard Deviation: 1.5IQR Q 1 1.5IQR: Q IQR: Outliers: (P1.) Salaries {73000, 75000, 75000, 75000, 80000, 80000, 82000, 82000, 84000, 85000, 85000, 89000, 90000, 91000, 91000, 92000, 92000, 94000, 94000,100000, , , } Mean: Mode: Median: Minimum: Maximum: Quartile 1: Quartile 3: IQR: Range: Variance: Standard Deviation: 1.5IQR Q 1 1.5IQR: Q IQR: Outliers: 12


13 Normal Distribution - a frequency distribution that results in a normal curve (aka bell curve ). The important values for sketching and using a Normal Curve are the Mean and Standard Deviation The Rule (E2.) Given the below set of quiz scores, find the mean and standard deviation, and explain what it means. You can make a simple normal distribution graph. {90, 88, 87, 95, 84, 86, 81, 99, 56, 86, 86, 88, 77, 94, 79, 74, 92, 88, 86, 95, 84, 92, 81, 85, 75, 99} Mean: Standard Deviation: (P2.) Given the below set of test scores, find the mean and standard deviation, and explain what it means. Make a normal distribution graph. {54.5, 70, 77, 36, 84, 51, 93, 90, 53.5, 89.5, 87.5, 83, 64.5, 89.5, 44, 81, 82.5, 60.5, 77, 97, 82, 48, 85, 60.5, 103, 71.5, 50, 82.5} Mean: Standard Deviation: 13
14 Applications: (P3.) A student scored an 83%, 85% and 90% on three tests. What would they have to score on a fourth test, to have an overall test average of 88%? (P4.) Suppose there were two more tests to be completed. a) What would they have to score on the fourth and fifth test to have an overall average of 88%? b) Find two possible test scores for the fourth and fifth test that would allow the overall test average to be an 88%. (P5.) Find the average of all consecutive integers from


15 Appendix 4: Reading Graphs (R/1) QUALITATIVE DATA DISPLAYS Data Displays displays data that is organized by: the of the number of that an event OR the of the number of times an event to the of on which it occur. Relative frequency can be expressed as a, or Bar Graph Vertical or horizontal bars that represent the or for each value of the variable. Pie Chart A represents the whole and each of the variable is a of the circle. ***Can only be used when comparing parts to the whole*** 15

16 QUANTITATIVE DATA DISPLAYS and Plots a graphic way to display the, and of a data set on a number line to show the of the data (E1.) Organize the following data into a Box and Whisker Plot. {4, 233, 15, 4, 197, 1, 231, 285, 278, 39} Minimum: Q 1 : Median: Q 3 : Maximum: IQR: 1.5IQR Q 1 1.5IQR: Q IQR: Outliers: (E2.) The graph represents the amount of money surveyed people spent in a month at Starbucks. Minimum: Q 1 : Median: Q 3 : Maximum: IQR: 1.5IQR Q 1 1.5IQR: Q IQR: Outliers: What percent of the data is above $45? What would be your best prediction for the mean? Why? and Plot a table in which data values are divided into either a leaf or a stem (E3.) Create a Stem and Leaf plot {81, 72, 63, 65, 80, 54, 92, 88, 72, 71, 66, 80, 83, 59, 50, 94} Histogram a frequency distribution that is drawn over an using rectangles. Each rectangle represents a (subgroup of data) and has an area that is to the of a variable and a width that is equal to the (the range of each class). Each class interval has an and value known as. If one data point falls ON a limit, it is counted in the class. 16


17 (E4.) Draw a Histogram to illustrate quiz scores. 56, 74, 75, 77, 79, 81, 81, 84, 84, 85, 86, 86, 86, 86, 87, 88, 88, 88, 90, 92, 92, 94, 95, 95, 99, 99 SPREAD OF DATA There are many ways to measure the spread of data. Statisticians often accept Interquartile range (IQR) as the best measure NOTE: COMMON MISCONCEPTION getting Left Skewed and Right Skewed flipped! TIP: The tail points towards the direction of the skew. Or on what side is the mean higher? 17
18 (E5.) Two teachers in the sociology department, Michelle and Bonnie, asked their students to record how many different websites they visited each day. The box and whisker plots below show the results. a) Which class has a higher median? b) Which class has a wider spread? c) Overall, which class is visiting more websites on a daily basis? Explain and/or support your answer. d) Describe the skewness of each class. (E6.) The below Stem-and-Leaf Plot represents the ages of tenured faculty members at Penn State University. a) What is the median age of tenured faculty members? b) Describe the skewness of the graph. 18

19 12.1 Fundamental Counting Principle and Permutations (R,E,/1) The fundamental counting principal can be extended to three or more events. For example, if three events can occur in m, n, and p ways, then the number of ways that all three events can occur is m n p. For instance, if three events can occur in 2, 5, and 7 ways, then all three events can occur in = 70 ways. (E1.) Police use photographs of various facial features to help witnesses identify suspects. One basic identification kit contains 195 hairlines, 99 eyes and eyebrows, 89 noses, 105 mouths, and 74 chins and cheeks. (a) The developer of the identification kit claims that it can produce billions of different faces. Is this claim correct? (b) A witness can clearly remember the hairline and the eyes and eyebrows of a suspect. How many different faces can be produced with this information? (P1.) In a high school there are 273 freshman, 291 sophomores, 252 juniors and 237 seniors. In how many different ways can a committee of 1 freshman, 1 sophomore, 1 junior and 1 senior be chosen? 19


20 (E2.) The standard configuration for a New York license plate is 3 digits followed by 3 letters. (a) How many different license plates are possible if digits and letters can be repeated? (b) How many different license plates are possible if digits and letters cannot be repeated? (P2.) A multiple choice test has 10 questions with 4 answer choices for each question. In how many different ways could you complete the test? 20
21 (E3.) Twelve skiers are competing in the final round of the Olympic freestyle skiing aerial competition. ties.) (a) In how many different ways can the skiers finish the competition? (Assume there are no (b) In how many different ways can 3 of the skiers finish first, second and third to win the gold, silver and bronze medals? (P3.) You have homework assignments from 5 different classes to complete this weekend. (a) In how many different ways can you complete the assignments? (b) In how many different ways can you choose 2 of the assignments to complete first and last? (E4.) You are considering 10 different colleges. Before you decide to apply to the colleges, you want to visit some or all of them. In how many orders can you visit: (a) 6 of the colleges? (b) all 10 colleges? (P4.) There are 12 books on the summer reading list. You want to read some or all of them. In how many different orders can you read: (a) 4 of the books? (b) all 12 of the books? 21

 Using the standard deck mentioned above, if the order is not important, how many different 7 card hands are possible?")
22 12.2 Combinations (R,E/1) A combination is a selection of r objects from a group of n objects where the order is not important. For instance, in most card games the order in which your cards are dealt is NOT important. For instance, the number of combinations of 2 objects taken from a group of 5 objects is 5C 2 = 5! 3! 2! = 10 (E1.) A standard deck of 52 playing cards has 4 suits with 13 different cards in each suit. If the order in which the cards are dealt is not important, how many different 5 card hands are possible? (P1.) Using the standard deck mentioned above, if the order is not important, how many different 7 card hands are possible? IMPORTANT NOTE: (1) When finding the number of ways both an event A AND an event B can occur, you need to multiply. (2) When finding the number of ways that an event A OR an event B can occur, you add instead. (E2.) A restaurant serves omelets that ban be ordered with any of the ingredients shown. Suppose you want exactly 2 vegetarian ingredients and 1 meat ingredient in your omelet. How many different types of omelets can you order? (P2.) You are taking a vacation. You can visit as many as 5 different cities and 7 different attractions. Suppose you want to visit exactly 3 different cities and 4 different attractions. How many different trips are possible? 22

23 One of the stumbling blocks that students face when dealing with permutations and combinations is knowing whether the problem requires a combination or a permutation. Here are some examples of when each is applicable. Notice, in permutations, the order IS important and in combinations, the order is NOT important. ****Some Key Words For Permutations: Arrange, Order, Line up**** ****Some Key Words For Combinations: Select, Group, Choose**** 23


24 12.3 and Supplement Introduction to Probability and Odds (R,I,E/1) The probability of an event is a number between 0 and 1 that indicates the likelihood that an event will occur. An event that is certain to occur has a probability of 1. An event that cannot occur has a probability of 0. An event that is equally likely to occur or not occur has a probability of 1 2. Theoretical probability is based on knowing all of the equally likely outcomes of an experiment. Sample Space is also another word used for the number of all possible outcomes. A probability that is based on repeated trials of an experiment is called an experimental probability. Each trial in which the event occurs is a success. (E1.) You roll a six-sided die whose sides are numbered from 1 through 6. (a) Find the probability of rolling a 4 (b) Find the probability of rolling an odd number (c) Find the probability of rolling a number less than 7 24
 You have a CD that has 8 songs in your CD player. You set the player to play the songs at random. The player plays all 8 songs without repeating any song.")
25 (P1.) A spinner has 8 equal-size sectors numbered from 1 to 8. (a) Find the probability of spinning a 6 (b) Find the probability of spinning a number greater than 5 (E2.) You have a CD that has 8 songs in your CD player. You set the player to play the songs at random. The player plays all 8 songs without repeating any song. (a) What is the probability that the songs are played in the same order they are listed on the CD? (b) You have 4 favorite songs on the CD. What is the probability that 2 of your favorite songs are played first, in any order? (P2.) There are 9 students on the math team. You draw their names one by one to determine the order in which they answer questions at a math meet. What is the probability that 3 of the 5 seniors on the team will be chosen last, in any order? (E3.) You randomly choose an integer from 0 through 9. What are the odds that the integer is 4 or more? (P3.) You randomly choose a letter from the word SUMMER. What are the odds that the letter is a vowel? 25
26 (E4.) The probability that a randomly chosen household has a cat is Source: American Veterinary Medical Association. What are the odds (a) that a household has a cat? (b) that a household does NOT have a cat? (P4.) The probability that a randomly chosen 4 digit security code contains at least one zero is What are the odds that a 4 digit security code contains at least one zero? 26
 A card is randomly selected from a standard deck of 52 cards.")
 (E2.")
 One six sided die is rolled. What is the probability of rolling a multiple of 3 or a multiple of 2?")


27 12.4 Probability of Compound Events (R,I,E/2) Probabilities of Unions and Intersections (E1.) A card is randomly selected from a standard deck of 52 cards. What is the probability that it is an ace or a face card? (MEE) (P1.) One six sided die is rolled. What is the probability of rolling a multiple of 3 or 5? (MEE) (E2.) A card is randomly selected from a standard deck of 52 cards. What is the probability that the card is a heart or a face card?(nmee) (P2.) One six sided die is rolled. What is the probability of rolling a multiple of 3 or a multiple of 2? (NMEE) (E3.) Last year a company paid overtime wages or hired temporary help during 9 months. Overtime wages were paid during 7 months and temporary help was hired during 4 months. At the end of the year, an auditor examines the accounting records and randomly selects one month to check the company's payroll. What is the probability that the auditor will select a month in which the company paid overtime wages and hired temporary help? (P3.) In a poll of high school juniors, 6 out of 15 students took a French class and 11 out of 15 took a math class. Fourteen out of 15 students took French or math. What is the probability that a student took both French and math? 27

 A card is randomly selected from a standard deck of 52 cards.")
28 (E4.) When two six sided dice are tossed, there are 36 possible outcomes as shown. Find the probability of the given event. (a) The sum is NOT 8 (b) The sum is greater than or equal to 4 (P4.) A card is randomly selected from a standard deck of 52 cards. Find the probability of the given event. (a) The card is NOT a king (b) The card is NOT an ace or a jack 28
 A game machine claims that 1 in every 15 people win.")

29 12.5 Probability of independent and Dependent Events (R,I,E/2) (E1.) You are playing a game that involves spinning the money wheel shown. During your turn you get to spin the wheel twice. What is the probability that you get more than $500 on your first spin and then go bankrupt on your second spin? (P1.) A game machine claims that 1 in every 15 people win. What is the probability that you win twice in a row? (E2.) During the 1997 baseball season, the Florida marlins won 5 out of 7 home games and 3 out of 7 away games against the San Francisco Giants. During the 1997 National League Division Series with the Giants, the Marlins played the first two games at home and the third game away. The Marlins won all three games. Estimate the probability of this happening. (P2.) In a survey 9 out 11 men and 4 out of 7 women said they were satisfied with a product. If the next three customers are 2 women and a man, what is the probability that they will all be satisfied? 29
 and the second card is a face card if (a) you replace the first card before selecting the second card (b) you do")
30 (E3.) You randomly select two cards from a standard 52-card deck. What is the probability that the first card is not a face card (a king, queen or jack) and the second card is a face card if (a) you replace the first card before selecting the second card (b) you do NOT replace the first card (P3.) You randomly select two cards from a standard 52-card deck. Find the probability that the first card is a diamond and the second card is red if (a) you replace the first card before selecting the second card (b) you do NOT replace the first card (E4.) You and two friends go to a restaurant to order a sandwich. The menu has 10 types of sandwiches and each of you is equally likely to order any type. What is the probability that each of you orders a different type? (P4.) Three children have a choice of 12 summer camps that they can attend. If they each randomly choose which camp to attend, what is the probability that they attended all different camps? 30
31 Supplement: Two-Way Tables & Probability (R,I,E/1) (Compound Events, Conditional Probability, Independent Events, Dependent Event) A two-way table is a useful way to organize data that can be categorized by two variables. E1.) Find the missing pieces of the table. E2.) What percent of people are male given that they are conservative? E3.) What percent of females are liberal? E4.) If we know someone is moderate, what is the chance (%) they are male? E5.) What percent of people that are conservative are female? E6.) What percent of people are male and liberal? E7.) What percent of people are female and conservative? E8.) A male student is surveyed randomly, what is the probability that the student is a conservative? 31
32 Warm-ups Use the provided spaces to complete any warm-up problem or activity 32
33 Warm-ups Use the provided spaces to complete any warm-up problem or activity 33
12.1 The Fundamental Counting Principle and Permutations
 12.1 The Fundamental Counting Principle and Permutations The Fundamental Counting Principle Two Events: If one event can occur in ways and another event can occur in ways then the number of ways both events
Unit Nine Precalculus Practice Test Probability & Statistics. Name: Period: Date: NON-CALCULATOR SECTION
 Name: Period: Date: NON-CALCULATOR SECTION Vocabulary: Define each word and give an example. 1. discrete mathematics 2. dependent outcomes 3. series Short Answer: 4. Describe when to use a combination.
Algebra 2 P49 Pre 10 1 Measures of Central Tendency Box and Whisker Plots Variation and Outliers
 Algebra 2 P49 Pre 10 1 Measures of Central Tendency Box and Whisker Plots Variation and Outliers 10 1 Sample Spaces and Probability Mean Average = 40/8 = 5 Measures of Central Tendency 2,3,3,4,5,6,8,9
Fundamental. If one event can occur m ways and another event can occur n ways, then the number of ways both events can occur is:.
 12.1 The Fundamental Counting Principle and Permutations Objectives 1. Use the fundamental counting principle to count the number of ways an event can happen. 2. Use the permutations to count the number
Chapter 0: Preparing for Advanced Algebra
 Lesson 0-1: Representing Functions Date: Example 1: Locate Coordinates Name the quadrant in which the point is located. Example 2: Identify Domain and Range State the domain and range of each relation.
4.1 Sample Spaces and Events
 4.1 Sample Spaces and Events An experiment is an activity that has observable results. Examples: Tossing a coin, rolling dice, picking marbles out of a jar, etc. The result of an experiment is called an
Date. Probability. Chapter
 Date Probability Contests, lotteries, and games offer the chance to win just about anything. You can win a cup of coffee. Even better, you can win cars, houses, vacations, or millions of dollars. Games
Math Exam 2 Review. NOTE: For reviews of the other sections on Exam 2, refer to the first page of WIR #4 and #5.
 Math 166 Fall 2008 c Heather Ramsey Page 1 Math 166 - Exam 2 Review NOTE: For reviews of the other sections on Exam 2, refer to the first page of WIR #4 and #5. Section 3.2 - Measures of Central Tendency
Unit 8, Activity 1, Vocabulary Self-Awareness Chart
 Unit 8, Activity 1, Vocabulary Self-Awareness Chart Vocabulary Self-Awareness Chart WORD +? EXAMPLE DEFINITION Central Tendency Mean Median Mode Range Quartile Interquartile Range Standard deviation Stem
MAT Midterm Review
 MAT 120 - Midterm Review Name Identify the population and the sample. 1) When 1094 American households were surveyed, it was found that 67% of them owned two cars. Identify whether the statement describes
2. How many different three-member teams can be formed from six students?
 KCATM 2011 Probability & Statistics 1. A fair coin is thrown in the air four times. If the coin lands with the head up on the first three tosses, what is the probability that the coin will land with the
Chapter Test Form A. mean median mode. 187 Holt Algebra 1. Name Date Class. Select the best answer.
 Select the best answer. 1. Use this bar graph to identify how many more candies are blue than red. A 3 B 6 C 9 D 15 Form A 2. Which type of graph would be best for displaying this data? Board Members Opinions
THE ALGEBRA III MIDTERM EXAM REVIEW Name
 THE ALGEBRA III MIDTERM EXAM REVIEW Name This review MUST be turned in when you take the midterm exam OR you will not be allowed to take the midterm and will receive a ZERO for the exam. ALG III Midterm
Unit 14 Probability. Target 3 Calculate the probability of independent and dependent events (compound) AND/THEN statements
 AND/THEN statements") Target 1 Calculate the probability of an event Unit 14 Probability Target 2 Calculate a sample space 14.2a Tree Diagrams, Factorials, and Permutations 14.2b Combinations Target 3 Calculate the probability
Target 1 Calculate the probability of an event Unit 14 Probability Target 2 Calculate a sample space 14.2a Tree Diagrams, Factorials, and Permutations 14.2b Combinations Target 3 Calculate the probability
Fundamentals of Probability
 Fundamentals of Probability Introduction Probability is the likelihood that an event will occur under a set of given conditions. The probability of an event occurring has a value between 0 and 1. An impossible
2. The value of the middle term in a ranked data set is called: A) the mean B) the standard deviation C) the mode D) the median
 the mean B) the standard deviation C) the mode D) the median") 1. An outlier is a value that is: A) very small or very large relative to the majority of the values in a data set B) either 100 units smaller or 100 units larger relative to the majority of the values
1. An outlier is a value that is: A) very small or very large relative to the majority of the values in a data set B) either 100 units smaller or 100 units larger relative to the majority of the values
Chapter 1: Sets and Probability
 Chapter 1: Sets and Probability Section 1.3-1.5 Recap: Sample Spaces and Events An is an activity that has observable results. An is the result of an experiment. Example 1 Examples of experiments: Flipping
November 11, Chapter 8: Probability: The Mathematics of Chance
 Chapter 8: Probability: The Mathematics of Chance November 11, 2013 Last Time Probability Models and Rules Discrete Probability Models Equally Likely Outcomes Probability Rules Probability Rules Rule 1.
ATHS FC Math Department Al Ain Remedial worksheet. Lesson 10.4 (Ellipses)
") ATHS FC Math Department Al Ain Remedial worksheet Section Name ID Date Lesson Marks Lesson 10.4 (Ellipses) 10.4, 10.5, 0.4, 0.5 and 0.6 Intervention Plan Page 1 of 19 Gr 12 core c 2 = a 2 b 2 Question
ATHS FC Math Department Al Ain Remedial worksheet Section Name ID Date Lesson Marks Lesson 10.4 (Ellipses) 10.4, 10.5, 0.4, 0.5 and 0.6 Intervention Plan Page 1 of 19 Gr 12 core c 2 = a 2 b 2 Question
Unit 11 Probability. Round 1 Round 2 Round 3 Round 4
 Study Notes 11.1 Intro to Probability Unit 11 Probability Many events can t be predicted with total certainty. The best thing we can do is say how likely they are to happen, using the idea of probability.
Algebra II. Sets. Slide 1 / 241 Slide 2 / 241. Slide 4 / 241. Slide 3 / 241. Slide 6 / 241. Slide 5 / 241. Probability and Statistics
 Slide 1 / 241 Slide 2 / 241 Algebra II Probability and Statistics 2016-01-15 www.njctl.org Slide 3 / 241 Slide 4 / 241 Table of Contents click on the topic to go to that section Sets Independence and Conditional
Algebra 2- Statistics and Probability Chapter Review
 Name Block Date Algebra 2- Statistics and Probability Chapter Review Statistics- Calculator Allowed with Applicable Work For exercises 1-4, tell whether the data that can be gathered about each variable
(Notice that the mean doesn t have to be a whole number and isn t normally part of the original set of data.)
") One-Variable Statistics Descriptive statistics that analyze one characteristic of one sample Where s the middle? How spread out is it? Where do different pieces of data compare? To find 1-variable statistics
One-Variable Statistics Descriptive statistics that analyze one characteristic of one sample Where s the middle? How spread out is it? Where do different pieces of data compare? To find 1-variable statistics
Grade 6 Math Circles Fall Oct 14/15 Probability
 1 Faculty of Mathematics Waterloo, Ontario Centre for Education in Mathematics and Computing Grade 6 Math Circles Fall 2014 - Oct 14/15 Probability Probability is the likelihood of an event occurring.
2 Event is equally likely to occur or not occur. When all outcomes are equally likely, the theoretical probability that an event A will occur is:
 10.3 TEKS a.1, a.4 Define and Use Probability Before You determined the number of ways an event could occur. Now You will find the likelihood that an event will occur. Why? So you can find real-life geometric
Finite Mathematics MAT 141: Chapter 8 Notes
 Finite Mathematics MAT 4: Chapter 8 Notes Counting Principles; More David J. Gisch The Multiplication Principle; Permutations Multiplication Principle Multiplication Principle You can think of the multiplication
Chapter 7 Homework Problems. 1. If a carefully made die is rolled once, it is reasonable to assign probability 1/6 to each of the six faces.
 Chapter 7 Homework Problems 1. If a carefully made die is rolled once, it is reasonable to assign probability 1/6 to each of the six faces. A. What is the probability of rolling a number less than 3. B.
1. For which of the following sets does the mean equal the median?
 1. For which of the following sets does the mean equal the median? I. {1, 2, 3, 4, 5} II. {3, 9, 6, 15, 12} III. {13, 7, 1, 11, 9, 19} A. I only B. I and II C. I and III D. I, II, and III E. None of the
MDM4U Some Review Questions
 1. Expand and simplify the following expressions. a) ( y 1) 7 b) ( 3x 2) 6 2x + 3 5 2. In the expansion of ( ) 9 MDM4U Some Review Questions, find a) the 6 th term b) 12 the term containing x n + 7 n +
MULTIPLE CHOICE. Choose the one alternative that best completes the statement or answers the question.
 Practice for Final Exam Name Identify the following variable as either qualitative or quantitative and explain why. 1) The number of people on a jury A) Qualitative because it is not a measurement or a
Algebra II. Slide 1 / 241. Slide 2 / 241. Slide 3 / 241. Probability and Statistics. Table of Contents click on the topic to go to that section
 Slide 1 / 241 Slide 2 / 241 Algebra II Probability and Statistics 2016-01-15 www.njctl.org Table of Contents click on the topic to go to that section Slide 3 / 241 Sets Independence and Conditional Probability
CHAPTER 6 PROBABILITY. Chapter 5 introduced the concepts of z scores and the normal curve. This chapter takes
 CHAPTER 6 PROBABILITY Chapter 5 introduced the concepts of z scores and the normal curve. This chapter takes these two concepts a step further and explains their relationship with another statistical concept
Numerical: Data with quantity Discrete: whole number answers Example: How many siblings do you have?
 Types of data Numerical: Data with quantity Discrete: whole number answers Example: How many siblings do you have? Continuous: Answers can fall anywhere in between two whole numbers. Usually any type of
Chapter 1: Stats Starts Here Chapter 2: Data
 Chapter 1: Stats Starts Here Chapter 2: Data Statistics data, datum variation individual respondent subject participant experimental unit observation variable categorical quantitative Calculator Skills:
Name: Class: Date: 6. An event occurs, on average, every 6 out of 17 times during a simulation. The experimental probability of this event is 11
 Class: Date: Sample Mastery # Multiple Choice Identify the choice that best completes the statement or answers the question.. One repetition of an experiment is known as a(n) random variable expected value
Contemporary Mathematics Math 1030 Sample Exam I Chapters Time Limit: 90 Minutes No Scratch Paper Calculator Allowed: Scientific
 Contemporary Mathematics Math 1030 Sample Exam I Chapters 13-15 Time Limit: 90 Minutes No Scratch Paper Calculator Allowed: Scientific Name: The point value of each problem is in the left-hand margin.
CHAPTER 8 Additional Probability Topics
 CHAPTER 8 Additional Probability Topics 8.1. Conditional Probability Conditional probability arises in probability experiments when the person performing the experiment is given some extra information
A B C. 142 D. 96
 Data Displays and Analysis 1. stem leaf 900 3 3 4 5 7 9 901 1 1 1 2 4 5 6 7 8 8 8 9 9 902 1 3 3 3 4 6 8 9 9 903 1 2 2 3 3 3 4 7 8 9 904 1 1 2 4 5 6 8 8 What is the range of the data shown in the stem-and-leaf
green, green, green, green, green The favorable outcomes of the event are blue and red.
 5 Chapter Review Review Key Vocabulary experiment, p. 6 outcomes, p. 6 event, p. 6 favorable outcomes, p. 6 probability, p. 60 relative frequency, p. 6 Review Examples and Exercises experimental probability,
Describing Data. Presenting Categorical Data Graphically. Describing Data 143
 Describing Data 143 Describing Data Once we have collected data from surveys or experiments, we need to summarize and present the data in a way that will be meaningful to the reader. We will begin with
Week in Review #5 ( , 3.1)
") Math 166 Week-in-Review - S. Nite 10/6/2012 Page 1 of 5 Week in Review #5 (2.3-2.4, 3.1) n( E) In general, the probability of an event is P ( E) =. n( S) Distinguishable Permutations Given a set of n objects
Math 166 Week-in-Review - S. Nite 10/6/2012 Page 1 of 5 Week in Review #5 (2.3-2.4, 3.1) n( E) In general, the probability of an event is P ( E) =. n( S) Distinguishable Permutations Given a set of n objects
Section 1.5 Graphs and Describing Distributions
 Section 1.5 Graphs and Describing Distributions Data can be displayed using graphs. Some of the most common graphs used in statistics are: Bar graph Pie Chart Dot plot Histogram Stem and leaf plot Box
STATISTICS and PROBABILITY GRADE 6
 Kansas City Area Teachers of Mathematics 2016 KCATM Math Competition STATISTICS and PROBABILITY GRADE 6 INSTRUCTIONS Do not open this booklet until instructed to do so. Time limit: 20 minutes You may use
4.3 Rules of Probability
 4.3 Rules of Probability If a probability distribution is not uniform, to find the probability of a given event, add up the probabilities of all the individual outcomes that make up the event. Example:
Intro to Algebra Guided Notes (Unit 11)
") Intro to Algebra Guided Notes (Unit 11) PA 12-1, 12-2, 12-3, 12-7 Alg 12-2, 12-3, 12-4 NAME 12-1 Stem-and-Leaf Plots Stem-and-Leaf Plot: numerical data are listed in ascending or descending order. The
Intro to Algebra Guided Notes (Unit 11) PA 12-1, 12-2, 12-3, 12-7 Alg 12-2, 12-3, 12-4 NAME 12-1 Stem-and-Leaf Plots Stem-and-Leaf Plot: numerical data are listed in ascending or descending order. The
7.1 Chance Surprises, 7.2 Predicting the Future in an Uncertain World, 7.4 Down for the Count
 7.1 Chance Surprises, 7.2 Predicting the Future in an Uncertain World, 7.4 Down for the Count Probability deals with predicting the outcome of future experiments in a quantitative way. The experiments
MAT104: Fundamentals of Mathematics II Summary of Counting Techniques and Probability. Preliminary Concepts, Formulas, and Terminology
 MAT104: Fundamentals of Mathematics II Summary of Counting Techniques and Probability Preliminary Concepts, Formulas, and Terminology Meanings of Basic Arithmetic Operations in Mathematics Addition: Generally
MATH STUDENT BOOK. 7th Grade Unit 6
 MATH STUDENT BOOK 7th Grade Unit 6 Unit 6 Probability and Graphing Math 706 Probability and Graphing Introduction 3 1. Probability 5 Theoretical Probability 5 Experimental Probability 13 Sample Space 20
Name: Spring P. Walston/A. Moore. Topic worksheet # assigned #completed Teacher s Signature Tree Diagrams FCP
 Name: Spring 2016 P. Walston/A. Moore Topic worksheet # assigned #completed Teacher s Signature Tree Diagrams 1-0 13 FCP 1-1 16 Combinations/ Permutations Factorials 1-2 22 1-3 20 Intro to Probability
Empirical (or statistical) probability) is based on. The empirical probability of an event E is the frequency of event E.
 probability) is based on. The empirical probability of an event E is the frequency of event E.") Probability and Statistics Chapter 3 Notes Section 3-1 I. Probability Experiments. A. When weather forecasters say There is a 90% chance of rain tomorrow, or a doctor says There is a 35% chance of a successful
Probability and Statistics Chapter 3 Notes Section 3-1 I. Probability Experiments. A. When weather forecasters say There is a 90% chance of rain tomorrow, or a doctor says There is a 35% chance of a successful
Algebra II Probability and Statistics
 Slide 1 / 241 Slide 2 / 241 Algebra II Probability and Statistics 2016-01-15 www.njctl.org Slide 3 / 241 Table of Contents click on the topic to go to that section Sets Independence and Conditional Probability
Section Introduction to Sets
 Section 1.1 - Introduction to Sets Definition: A set is a well-defined collection of objects usually denoted by uppercase letters. Definition: The elements, or members, of a set are denoted by lowercase
AP Statistics Composition Book Review Chapters 1 2
 AP Statistics Composition Book Review Chapters 1 2 Terms/vocabulary: Explain each term with in the STATISTICAL context. Bar Graph Bimodal Categorical Variable Density Curve Deviation Distribution Dotplot
NAME DATE PERIOD. Study Guide and Intervention
 9-1 Section Title The probability of a simple event is a ratio that compares the number of favorable outcomes to the number of possible outcomes. Outcomes occur at random if each outcome occurs by chance.
CH 13. Probability and Data Analysis
 11.1: Find Probabilities and Odds 11.2: Find Probabilities Using Permutations 11.3: Find Probabilities Using Combinations 11.4: Find Probabilities of Compound Events 11.5: Analyze Surveys and Samples 11.6:
April 10, ex) Draw a tree diagram of this situation.
 Draw a tree diagram of this situation.") April 10, 2014 12-1 Fundamental Counting Principle & Multiplying Probabilities 1. Outcome - the result of a single trial. 2. Sample Space - the set of all possible outcomes 3. Independent Events - when
April 10, 2014 12-1 Fundamental Counting Principle & Multiplying Probabilities 1. Outcome - the result of a single trial. 2. Sample Space - the set of all possible outcomes 3. Independent Events - when
Bell Work. Warm-Up Exercises. Two six-sided dice are rolled. Find the probability of each sum or 7
 Warm-Up Exercises Two six-sided dice are rolled. Find the probability of each sum. 1. 7 Bell Work 2. 5 or 7 3. You toss a coin 3 times. What is the probability of getting 3 heads? Warm-Up Notes Exercises
She concludes that the dice is biased because she expected to get only one 6. Do you agree with June's conclusion? Briefly justify your answer.
 PROBABILITY & STATISTICS TEST Name: 1. June suspects that a dice may be biased. To test her suspicions, she rolls the dice 6 times and rolls 6, 6, 4, 2, 6, 6. She concludes that the dice is biased because
Algebra 2 Notes Section 10.1: Apply the Counting Principle and Permutations
 Algebra 2 Notes Section 10.1: Apply the Counting Principle and Permutations Objective(s): Vocabulary: I. Fundamental Counting Principle: Two Events: Three or more Events: II. Permutation: (top of p. 684)
x y
 1. Find the mean of the following numbers: ans: 26.25 3, 8, 15, 23, 35, 37, 41, 48 2. Find the median of the following numbers: ans: 24 8, 15, 2, 23, 41, 83, 91, 112, 17, 25 3. Find the sample standard
Sections Descriptive Statistics for Numerical Variables
 Math 243 Sections 2.1.2-2.2.5 Descriptive Statistics for Numerical Variables A framework to describe quantitative data: Describe the Shape, Center and Spread, and Unusual Features Shape How is the data
Essential Question How can you list the possible outcomes in the sample space of an experiment?
 . TEXAS ESSENTIAL KNOWLEDGE AND SKILLS G..B Sample Spaces and Probability Essential Question How can you list the possible outcomes in the sample space of an experiment? The sample space of an experiment
Name: Class: Date: ID: A
 Class: Date: Chapter 0 review. A lunch menu consists of different kinds of sandwiches, different kinds of soup, and 6 different drinks. How many choices are there for ordering a sandwich, a bowl of soup,
18.S34 (FALL, 2007) PROBLEMS ON PROBABILITY
 PROBLEMS ON PROBABILITY") 18.S34 (FALL, 2007) PROBLEMS ON PROBABILITY 1. Three closed boxes lie on a table. One box (you don t know which) contains a $1000 bill. The others are empty. After paying an entry fee, you play the following
18.S34 (FALL, 2007) PROBLEMS ON PROBABILITY 1. Three closed boxes lie on a table. One box (you don t know which) contains a $1000 bill. The others are empty. After paying an entry fee, you play the following
LC OL Probability. ARNMaths.weebly.com. As part of Leaving Certificate Ordinary Level Math you should be able to complete the following.
 A Ryan LC OL Probability ARNMaths.weebly.com Learning Outcomes As part of Leaving Certificate Ordinary Level Math you should be able to complete the following. Counting List outcomes of an experiment Apply
Going back to the definition of Biostatistics. Organizing and Presenting Data. Learning Objectives. Nominal Data 10/10/2016. Tabulation and Graphs
 1/1/1 Organizing and Presenting Data Tabulation and Graphs Introduction to Biostatistics Haleema Masud Going back to the definition of Biostatistics The collection, organization, summarization, analysis,
Exam III Review Problems
 c Kathryn Bollinger and Benjamin Aurispa, November 10, 2011 1 Exam III Review Problems Fall 2011 Note: Not every topic is covered in this review. Please also take a look at the previous Week-in-Reviews
Get Ready for Chapter 12
 Get Ready for Chapter Statistics and Probability Diagnose Readiness You have two options for checking Prerequisite Skills. Option 2 Option Take the Quick Quiz below. Refer to the Quick Review for help.
7.1 Experiments, Sample Spaces, and Events
 7.1 Experiments, Sample Spaces, and Events An experiment is an activity that has observable results. Examples: Tossing a coin, rolling dice, picking marbles out of a jar, etc. The result of an experiment
To describe the centre and spread of a univariate data set by way of a 5-figure summary and visually by a box & whisker plot.
 Five Figure Summary Teacher Notes & Answers 7 8 9 10 11 12 TI-Nspire Investigation Student 60 min Aim To describe the centre and spread of a univariate data set by way of a 5-figure summary and visually
CCMR Educational Programs
 CCMR Educational Programs Title: Date Created: August 6, 2006 Author(s): Appropriate Level: Abstract: Time Requirement: Joan Erickson Should We Count the Beans one at a time? Introductory statistics or
SAMPLE. This chapter deals with the construction and interpretation of box plots. At the end of this chapter you should be able to:
 find the upper and lower extremes, the median, and the upper and lower quartiles for sets of numerical data calculate the range and interquartile range compare the relative merits of range and interquartile
3. A box contains three blue cards and four white cards. Two cards are drawn one at a time.
 MATH 310 FINAL EXAM PRACTICE QUESTIONS solutions 09/2009 A. PROBABILITY The solutions given are not the only method of solving each question. 1. A fair coin was flipped 5 times and landed heads five times.
Spring 2016 Math 54 Test #2 Name: Write your work neatly. You may use TI calculator and formula sheet. Total points: 103
 Spring 2016 Math 54 Test #2 Name: Write your work neatly. You may use TI calculator and formula sheet. Total points: 103 1. (8) The following are amounts of time (minutes) spent on hygiene and grooming
Notes: Displaying Quantitative Data
 Notes: Displaying Quantitative Data Stats: Modeling the World Chapter 4 A or is often used to display categorical data. These types of displays, however, are not appropriate for quantitative data. Quantitative
11-1 Practice. Designing a Study
 11-1 Practice Designing a Study Determine whether each situation calls for a survey, an experiment, or an observational study. Explain your reasoning. 1. You want to compare the health of students who
Algebra II- Chapter 12- Test Review
 Sections: Counting Principle Permutations Combinations Probability Name Choose the letter of the term that best matches each statement or phrase. 1. An illustration used to show the total number of A.
Algebra I Notes Unit One: Real Number System
 Syllabus Objectives: 1.1 The student will organize statistical data through the use of matrices (with and without technology). 1.2 The student will perform addition, subtraction, and scalar multiplication
This unit will help you work out probability and use experimental probability and frequency trees. Key points
 Get started Probability This unit will help you work out probability and use experimental probability and frequency trees. AO Fluency check There are 0 marbles in a bag. 9 of the marbles are red, 7 are
Name: Class: Date: Ver: 2
 Name: Class: Date: Ver: 2 Secondary Math 1 Unit 9 Review 1. A charity randomly selected 100 donors. The mean donation amount of those donors is calculated. Identify the sample and population. Describe
6. In how many different ways can you answer 10 multiple-choice questions if each question has five choices?
 Pre-Calculus Section 4.1 Multiplication, Addition, and Complement 1. Evaluate each of the following: a. 5! b. 6! c. 7! d. 0! 2. Evaluate each of the following: a. 10! b. 20! 9! 18! 3. In how many different
Counting Methods and Probability
 CHAPTER Counting Methods and Probability Many good basketball players can make 90% of their free throws. However, the likelihood of a player making several free throws in a row will be less than 90%. You
1. How to identify the sample space of a probability experiment and how to identify simple events
 Statistics Chapter 3 Name: 3.1 Basic Concepts of Probability Learning objectives: 1. How to identify the sample space of a probability experiment and how to identify simple events 2. How to use the Fundamental
The point value of each problem is in the left-hand margin. You must show your work to receive any credit, except on problems 1 & 2. Work neatly.
 Introduction to Statistics Math 1040 Sample Exam II Chapters 5-7 4 Problem Pages 4 Formula/Table Pages Time Limit: 90 Minutes 1 No Scratch Paper Calculator Allowed: Scientific Name: The point value of
Foundations to Algebra In Class: Investigating Probability
 Foundations to Algebra In Class: Investigating Probability Name Date How can I use probability to make predictions? Have you ever tried to predict which football team will win a big game? If so, you probably
Unit 7 Central Tendency and Probability
 Name: Block: 7.1 Central Tendency 7.2 Introduction to Probability 7.3 Independent Events 7.4 Dependent Events 7.1 Central Tendency A central tendency is a central or value in a data set. We will look at
Learning Log Title: CHAPTER 2: ARITHMETIC STRATEGIES AND AREA. Date: Lesson: Chapter 2: Arithmetic Strategies and Area
 Chapter 2: Arithmetic Strategies and Area CHAPTER 2: ARITHMETIC STRATEGIES AND AREA Date: Lesson: Learning Log Title: Date: Lesson: Learning Log Title: Chapter 2: Arithmetic Strategies and Area Date: Lesson:
Key Concepts. Theoretical Probability. Terminology. Lesson 11-1
 Key Concepts Theoretical Probability Lesson - Objective Teach students the terminology used in probability theory, and how to make calculations pertaining to experiments where all outcomes are equally
Probability of Independent Events. If A and B are independent events, then the probability that both A and B occur is: P(A and B) 5 P(A) p P(B)
 5 P(A) p P(B)") 10.5 a.1, a.5 TEKS Find Probabilities of Independent and Dependent Events Before You found probabilities of compound events. Now You will examine independent and dependent events. Why? So you can formulate
10.5 a.1, a.5 TEKS Find Probabilities of Independent and Dependent Events Before You found probabilities of compound events. Now You will examine independent and dependent events. Why? So you can formulate
Test 2 SOLUTIONS (Chapters 5 7)
") Test 2 SOLUTIONS (Chapters 5 7) 10 1. I have been sitting at my desk rolling a six-sided die (singular of dice), and counting how many times I rolled a 6. For example, after my first roll, I had rolled
Test 2 SOLUTIONS (Chapters 5 7) 10 1. I have been sitting at my desk rolling a six-sided die (singular of dice), and counting how many times I rolled a 6. For example, after my first roll, I had rolled
Intermediate Math Circles November 1, 2017 Probability I
 Intermediate Math Circles November 1, 2017 Probability I Probability is the study of uncertain events or outcomes. Games of chance that involve rolling dice or dealing cards are one obvious area of application.
AP Statistics Ch In-Class Practice (Probability)
") AP Statistics Ch 14-15 In-Class Practice (Probability) #1a) A batter who had failed to get a hit in seven consecutive times at bat then hits a game-winning home run. When talking to reporters afterward,
AP Statistics Ch 14-15 In-Class Practice (Probability) #1a) A batter who had failed to get a hit in seven consecutive times at bat then hits a game-winning home run. When talking to reporters afterward,
Chapter 4. September 08, appstats 4B.notebook. Displaying Quantitative Data. Aug 4 9:13 AM. Aug 4 9:13 AM. Aug 27 10:16 PM.
 Objectives: Students will: Chapter 4 1. Be able to identify an appropriate display for any quantitative variable: stem leaf plot, time plot, histogram and dotplot given a set of quantitative data. 2. Be
Probability --QUESTIONS-- Principles of Math 12 - Probability Practice Exam 1
 Probability --QUESTIONS-- Principles of Math - Probability Practice Exam www.math.com Principles of Math : Probability Practice Exam Use this sheet to record your answers:... 4... 4... 4.. 6. 4.. 6. 7..
Math 2 Proportion & Probability Part 3 Sums of Series, Combinations & Compound Probability
 Math 2 Proportion & Probability Part 3 Sums of Series, Combinations & Compound Probability 1 SUMMING AN ARITHMETIC SERIES USING A FORMULA To sum up the terms of this arithmetic sequence: a + (a+d) + (a+2d)
THE ALGEBRA III MIDTERM EXAM REVIEW Name. This review MUST be turned in when you take the midterm exam
 THE ALGEBRA III MIDTERM EXAM REVIEW Name This review MUST be turned in when you take the midterm exam ALG III Midterm Review Solve and graph on a number line. 1. x 6 14. 3x 1 5x 14 3. 4(x 1) (4x 3) Find
Chapter 4. Displaying and Summarizing Quantitative Data. Copyright 2012, 2008, 2005 Pearson Education, Inc.
 Chapter 4 Displaying and Summarizing Quantitative Data Copyright 2012, 2008, 2005 Pearson Education, Inc. Dealing With a Lot of Numbers Summarizing the data will help us when we look at large sets of quantitative
Name Class Date. Introducing Probability Distributions
 Name Class Date Binomial Distributions Extension: Distributions Essential question: What is a probability distribution and how is it displayed? 8-6 CC.9 2.S.MD.5(+) ENGAGE Introducing Distributions Video
Unit 5 Radical Functions & Combinatorics
 1 Unit 5 Radical Functions & Combinatorics General Outcome: Develop algebraic and graphical reasoning through the study of relations. Develop algebraic and numeric reasoning that involves combinatorics.