Continued on the Next Page
|
|
|
- Noreen Payne
- 6 years ago
- Views:
Transcription
1
2 The Candlestick X-Ray Indicator Package: State-of-the-Art Pattern Detection Page 3 An Overview of the Candlestick X-Ray Features Page 5 The Complete List of Candlestick Patterns: 92 Fibonacci-Based Patterns Page 6 Candlestick X-Ray PaintBar: Color-Coded Candlestick Patterns Page 7 - Configuring and Customizing the PaintBar Page 8 Candlestick X-Ray Indicator: Detect Any Candlestick Pattern Page 9 - Configuring and Customizing the Indicator Page 10 Automated Scanning Capabilities: Scanning for Crossovers & Divergences Page 11 - NinjaTrader Market Analyzer Page 11 - TradeStation RadarScreen Page 13 - TradeStation Scanner Tool Page 15 Frequently Occurring Intra-Day Patterns Page 16 Our Favorite Candlestick Patterns Page 17 Expert Tips & Advice: Scanning for Crossovers & Divergences Page 18 - Expert Tip #1: Candlestick Patterns Establish Strong S/R Levels Page 18 - Expert Tip #2: Incorporate Volume Analysis with Candlestick Patterns Page 19 - Expert Tip #3: Pay Close Attention to Dojis after Rallies & Selloffs Page 20 - Expert Tip #4: Use Patterns to Define Profit-Target & Stop-Loss Levels Page 21 Continued on the Next Page Fibozachi LLC All Rights Reserved. 1
3 Superior Coding, Formulas, and Indicators: Filtering Out Weak Patterns Page 22 - Problem #1: Missed Signals on Big and Small Stocks Page 22 - Problem #2: Incorrect Formulas & Labeling of Candlestick Patterns Page 24 Harnessing the Power of Fibonacci: The Science behind our Formulas Page 25 Superior Customer Support Page 27 Risk Disclosure Statement Page Fibozachi LLC All Rights Reserved. 2
4 The Candlestick X-Ray is the most comprehensive, feature-rich collection of candlestick pattern Indicators on the commercial market. Whether you're interested in the most common or advanced patterns the Indicator, PaintBar, and Scanner detect over 90 unique candlestick patterns significantly more than any other indicator or software. The Candlestick X-Ray outperforms all competitors by using strictly coded, Fibonacci-based formulas that filter out low-quality patterns. This ensures that only the strongest candlestick patterns are detected avoiding weak, unreliable patterns that plague other software and indicators. Other candlestick tools on the market lack a proper understanding of the rules behind each pattern resulting in incorrect formulas. This can have disastrous consequences if you're making trading decisions based on false patterns Fibozachi LLC All Rights Reserved. 3
5 To solve this problem, we devised each pattern's formula after studying all the candlestick-related literature that we could get our hands on. Since many candlestick patterns and their respective formulas are neither qualitatively defined nor uniformly agreed amongst candlestick "experts", we have combined their various interpretations to determine the specific rules for each pattern. We also went a step further to incorporate Fibonacci numbers and ratios into many of our formulas creating multi-faceted, extremely powerful candlestick pattern Indicators. (More detailed information on pages 22-26). The Candlestick X-Ray Indicator Package includes: Fibozachi LLC All Rights Reserved. 4

6 - Our 92 candlestick patterns is significantly more than ANY other candlestick-related Indicators or software nothing else even comes close. - Our strictly coded, Fibonacci-based formulas filter out low-quality patterns. This ensures that only the strongest candlestick patterns are detected avoiding weak, unreliable and "border-line" patterns that plague other software and indicators. - The most important and valuable aspect of any candlestick pattern software is the ability to scan for patterns and signals. We include specialized scanner Indicators and templates that are explicitly designed to scan any list of symbols for any and all candlestick patterns. - Users can enable or disable any of the candlestick patterns to reduce chart clutter and only be notified of the most important patterns. All colors and text labels are also fully customizable to give you complete control. - Users can configure alerts for any patterns, allowing for audio, visual, and alerts and notifications to ensure that you won t miss any signals Fibozachi LLC All Rights Reserved. 5
7 Abandoned Baby Bull Abandoned Baby Bear Advance Block Bullish Engulfing Bearish Engulfing Bullish Kicking Bearish Kicking Breakaway Bullish Breakaway Bearish Concealed Baby Swallow Bull Concealed Baby Swallow Bear Dark Cloud Cover Deliberation Bull Deliberation Bear Descending Hawk Descent Block Doji Perfect Doji Dragonfly Evening Doji Star Evening Star Falling Three Method Four Price Doji Gravestone Hammer Perfect Hammer Hanging Man Perfect Hang Man Inverted Hammer Perfect Inverted Hammer Harami Bullish Harami Bearish Harami Cross High Price Gap Bull High Wave Homing Pigeon Bull In Neck On Neck Ladder Bottom Ladder Top Low Price Gap Bear Marubozu White Marubozu Black Matching Low Matching High Mat Hold Bullish Mat Hold Bearish Meeting Lines Bull Meeting Lines Bear Morning Doji Star Morning Star Piercing Line Rising Three Method Separating Lines Bull Separating Lines Bear Shooting Star Perfect Shooting Star Side by Side Bull Side by Side Bear Stick Sandwich Bull Stick Sandwich Bear Squeeze Alert Bull Squeeze Alert Bear Three Inside Up Three Inside Down Three Outside Up Three Outside Down Three White Soldiers Three Identical Soldiers Three Black Crows Three Identical Crows Three Line Strike Bull Three Line Strike Bear Three Stars North Three Stars South Three River Bottom Three Mountain Top Thrusting Bull Thrusting Bear Tidal Wave Tri Star Bullish Tri Star Bearish Tweezer Top Tweezer Bottom Two Crows Two Rabbits Upside Gap Two Rabbits Downside Gap Two Crows Upside Gap Three Method Downside Gap Three Method Upside Tasuki Gap Downside Tasuki Gap Fibozachi LLC All Rights Reserved. 6

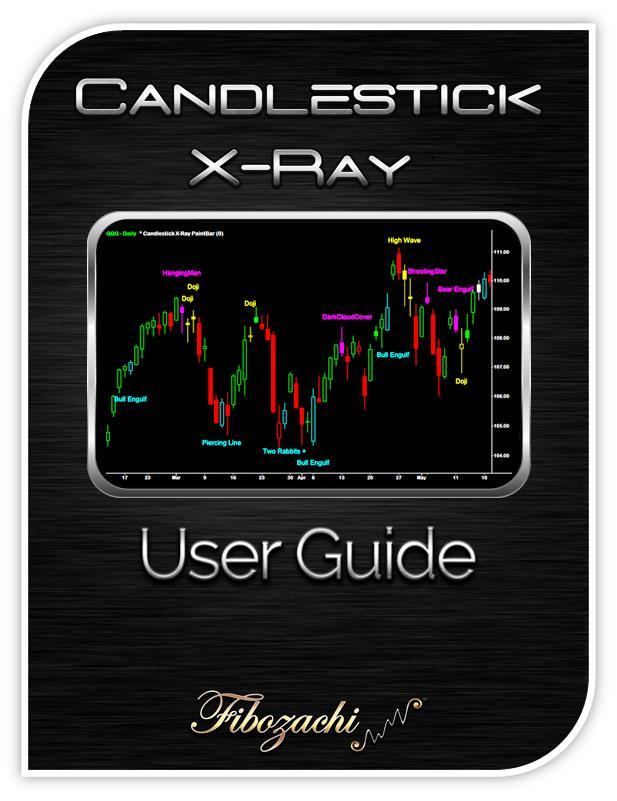
8 The Candlestick X-Ray PaintBar color-codes the price bars and provides a text label of the pattern name whenever a valid candlestick pattern is detected. It is fully customizable, allowing you to choose whether to show all patterns or only the specific patterns that you want to see. It comes with a default setting of Cyan for bullish patterns, Magenta for bearish patterns and Yellow for indecisive or neutral patterns (since most traders use green and red colored bars to display price action) Fibozachi LLC All Rights Reserved. 7
9 *** Go to Format Symbol - Scaling and make Sub-Graph Margins 10% or more on both the top and bottom so that all the patterns and text will fit on your chart. (this tip is for TradeStation and MultiCharts users only) *** To disable any of the patterns, simply go to the tool s Format / Inputs screen where you will see each pattern listed alphabetically with On/Off and a corresponding value of 1 next to it. To disable a pattern so that both its bar color and text label are no longer displayed, change the value to 0. *** To change the color of the bar or the text for any of the patterns, simply go to the tool s Format / Inputs screen where you will see each pattern listed alphabetically with a corresponding color next to it. Each pattern has two color settings: one setting for the bar color and one setting for the text color. This enables each user to deactivate or remove the text labels for any patterns that they do not want, as well as the ability to change the color of the bar when a valid pattern occurs. Choose each color you would like to use by replacing the text with your new color choice. If you would only like to remove the text labels from some patterns but want the bar to be a different color, you may do so by changing the text color to match your background (most likely black ). This is particularly useful if you decide to remove excessive engulfing or advancing patterns that can occur within small intraday timeframes Fibozachi LLC All Rights Reserved. 8
10 Candlestick X-Ray Indicator plots color-coded histogram bars (vertical bars) in the subpanel when a valid candlestick pattern is detected. It s a bit less obtrusive than the PaintBar text tool and can easily be changed to display all patterns or only the specific patterns that you want to see Fibozachi LLC All Rights Reserved. 9
11 *** To disable any of the patterns, simply go to the tool s Format / Inputs screen where you will see each pattern listed alphabetically with On/Off and a corresponding value of 1 next to it. To disable a pattern so that both its bar color and text label are no longer displayed, change the value to 0. This is particularly useful if you decide to remove excessive engulfing or advancing patterns that can occur within small intraday timeframes. For example, if you only wish to know when various dojis or marubozus occur, you can simply change the On/Off values of all the other patterns to 0. *** To change the color for any of the patterns, simply go to the tool s Format / Inputs screen where you will see each pattern listed alphabetically with a corresponding color next to it. Choose the color you would like to use for each pattern by replacing the text with your new color choice Fibozachi LLC All Rights Reserved. 10


12 The Candlestick X-Ray also includes a special pre-formatted Market Analyzer Indicator and template for all NinjaTrader users. All of the columns, colors, and text are completely customizable so that you can personalize it to your own preferences. Using the Candlestick X-Ray with the Market Analyzer allows you to quickly scan an entire list of symbols for all candlestick patterns in just seconds! Fibozachi LLC All Rights Reserved. 11
13 A special pre-formatted Market Analyzer template is included for all NinjaTrader users. If you would like to create your own templates, you must adhere to the following values when setting up your own cell conditions: Abandoned Baby Bull = 100 Abandoned Baby Bear = 99 Advance Block = 98 Bullish Engulfing = 97 Bearish Engulfing = 96 Bullish Kicking = 95 Bearish Kicking = 94 Breakaway Bullish = 93 Breakaway Bearish = 92 Conceal Baby Swallow Bull = 91 Conceal Baby Swallow Bear = 90 Dark Cloud Cover = 89 Deliberation Bull = 88 Deliberation Bear = 87 Descending Hawk = 86 Descent Block = 85 Doji = 83 Perfect Doji = 84 Dragonfly = 82 Evening Doji Star = 81 Evening Star = 80 Falling Three Method = 79 Four Price Doji = 78 Gravestone = 77 Hammer = 75 Perfect Hammer = 76 Hanging Man = 73 Perfect Hang Man = 74 Inverted Hammer = 71 Perfect Inverted Hammer = 72 Harami Bullish = 69 Harami Bearish = 68 Harami Cross = 70 High Price Gap Bull = 67 High Wave = 66 Homing Pigeon Bull = 65 In Neck = 64 On Neck = 63 Ladder Bottom = 62 Ladder Top = 61 Low Price Gap Bear = 60 Marubozu White = 59 Marubozu Black = 58 Matching Low = 57 Matching High = 56 Mat Hold Bullish = 55 Mat Hold Bearish = 54 Meeting Lines Bull = 53 Meeting Lines Bear = 52 Morning Doji Star = 51 Morning Star = 50 Piercing Line = 49 Rising Three Method = 48 Separating Lines Bull = 47 Separating Lines Bear = 46 Shooting Star = 44 Perfect Shooting Star = 45 Side by Side Bull = 43 Side by Side Bear = 42 Stick Sandwich Bull = 41 Stick Sandwich Bear = 40 Squeeze Alert Bull = 39 Squeeze Alert Bear = 38 Three Inside Up = 37 Three Inside Down = 36 Three Outside Up = 35 Three Outside Down = 34 Three White Soldiers = 33 Three Identical Soldiers = 32 Three Black Crows = 31 Three Identical Crows = 30 Three Line Strike Bull = 29 Three Line Strike Bear = 28 Three Stars South = 27 Three Stars North = 26 Three River Bottom = 25 Three Mountain Top = 24 Thrusting Bull = 23 Thrusting Bear = 22 Tidal Wave = 21 Tri Star Bullish = 20 Tri Star Bearish = 19 Tweezer Bottom = 18 Tweezer Top = 17 Two Rabbits = 16 Two Crows = 15 Downside Gap Two Crows = 14 Upside Gap Two Rabbits = 13 Up Gap Three Method = 12 Down Gap Three Method = 11 Upside Tasuki Gap = 10 Downside Tasuki Gap = Fibozachi LLC All Rights Reserved. 12

14 The Candlestick X-Ray also includes a special pre-formatted RadarScreen Indicator and template for all TradeStation users. All of the columns, colors, and text are completely customizable so that you can personalize it to your own preferences. Using the Candlestick X-Ray with the RadarScreen allows you to quickly scan an entire list of symbols for all candlestick patterns in just seconds! Fibozachi LLC All Rights Reserved. 13

15 The Candlestick X-Ray also includes a special pre-formatted Market Scanner Indicator and template for all MultiCharts users. All of the columns, colors, and text are completely customizable so that you can personalize it to your own preferences. Using the Candlestick X-Ray with the Market Scanner allows you to quickly scan an entire list of symbols for all candlestick patterns in just seconds! Fibozachi LLC All Rights Reserved. 14
16 We have found that scanning intraday for our favorite patterns can be quite useful as an early warning detection system, since the Candlestick X-Ray Scanner can display valid daily patterns before the trading day has ended. In other words, you can see which stocks exhibit valid pattern setups at 12 PM (EST) rather than having to wait for the close at the end of the trading day. *** While this screening technique allows for aggressive pre-emptive strategies, always exercise extreme caution when doing so because a pattern that appears valid at 12 PM (EST) may prove to be invalid at 4 PM on close. We prefer using the Candlestick X-Ray Scanner to keep an eye on which patterns are developing within a specific group of key issues at around 10:30 10:45 am, 2:15 2:30 pm and once again at 3:35 3:50 pm (EST) Fibozachi LLC All Rights Reserved. 15

17 To avoid excessive chart clutter and unnecessary signals when analyzing small intraday timeframes that are below 5 minute or 15 minute intervals, we recommended eliminating patterns that can occur too frequently, such as: Bullish & Bearish Engulfing; Bullish & Bearish Marubozu; Three Inside Up, Three Inside Down; Three Outside Up, Three Outside Down; Three White Soldiers / Three Black Crows; Matching High / Matching Low; Tweezer Top / Tweezer Bottom; Fibozachi LLC All Rights Reserved. 16
18 Abandoned Baby, Morning Doji Star & Evening Doji Star - High probability reversal patterns with expanding volatility and explosive price action Advance Block, Descent Block, Deliberation - These patterns often coincide with significantly overbought / oversold conditions, signaling that trend momentum is markedly waning High Wave - These patterns often coincide with significant turning points in market character, reflecting drastic changes in price action (e.g. March 6 th, 2009) Homing Pigeon & Descending Hawk - Provide extraordinary risk / reward ratios Piercing Line, Dark Cloud Cover, Thrusting - High probability reversal patterns Fibozachi LLC All Rights Reserved. 17
19 - Wait for price to revert to the support/resistance established where the pattern occurred and enter there for a greater risk/reward ratio. If price fails to revert, leaving you with a missed trade, OH WELL! There is no harm and no foul in missing a trade when it fails to meet your risk control parameters, regardless of how it plays out. By exercising technical discipline and emotional patience with your candlestick pattern trading, you can significantly increase both your success rate and risk/reward ratio Fibozachi LLC All Rights Reserved. 18


20 - It s a general rule that candlestick patterns which occur on increased volume exhibit greater probabilities for follow-through. If a valid pattern setup looks good but volume is either suspiciously lacking or utterly unconvincing, prudence warrants exercising caution. This simple, straightforward tip can greatly enhance your candlestick analysis Fibozachi LLC All Rights Reserved. 19
21 - Pay more attention to dojis which occur after prolonged or extended rallies (possible tops) rather than those occurring after extensive sell-offs (possible bottoms). While it is fundamentally correct that going up simply requires greater cumulative buying than selling, we have observed that doji signals exhibit much greater probabilistic predictive power and hence effective value for traders when they follow exhaustive rallies Fibozachi LLC All Rights Reserved. 20
 is a simple, straightforward way to effectively manage risk and minimize")
22 - You can project effective price targets and stop loss levels when employing many candlestick patterns. Placing your stop either just underneath the low or high of the respective pattern (depending on bullish or bearish character) is a simple, straightforward way to effectively manage risk and minimize time decay. For your price target, adding or subtracting the pattern s High-Low range to the top or bottom of the breakout level is another simple and straightforward way to calculate a realistically achievable price target Fibozachi LLC All Rights Reserved. 21
23 All doji-based as well as matching high or low patterns that require an equal open, high, low and/or close are simply impossible to code for both high-priced and low-priced issues when utilizing formulas which require precision; this prevents many candlestick patterns from registering valid signals on high-priced stocks, penny stocks, bonds, futures, or options. We believe that our coding has solved this problem by requiring the definition of a doji and a matching high or low to have a real body (Open - Close) that is less than approximately 13% of the current bar s trading range (High-Low). This allows for high-priced stocks (e.g. several hundred dollars) such as GOOG or PCLN to exhibit effective signals for these patterns in situations where simple coding falls short. We have also provided many of the original patterns, in addition to our custom modified patterns. *** Patterns with an = after them are the textbook codes that require exact Opens / Closes / Highs / Lows Fibozachi LLC All Rights Reserved. 22
24 GOOG opens at $ and closes at $400.00, where the Low is and the High is Simple Coding: fails to classify as a Doji day; no pattern is registered. Fibozachi Coding: recognizes that the 50-cent real body is only 6.25% of the High-Low range, thereby correctly registering as a Doji day. FNM opens at $1.10 and closes at $1.09, where the Low is 1.00 and the High is Simple Coding: fails to classify as a Doji day; no pattern is registered. Fibozachi Coding: recognizes that the 1-cent real body is only 5% of the High- Low range, thereby correctly registering as a Doji day Fibozachi LLC All Rights Reserved. 23
25 Many other candlestick pattern tools on the market have fundamental misconceptions about candlestick patterns and incorrect formulas of certain patterns; as a result, they plot invalid patterns and often miss the good ones. As systematic candlestick traders, we find such programming errors utterly unacceptable. We have painstakingly proofed every one of the 156,335 characters within each of the 4,445 specific lines of code that comprise the Candlestick X- Ray Package and take great pride in the quality of our work. Understanding the inherent price action within specific patterns adds a critical component to one s knowledge of candlesticks. Employing such valuable information to your candlestick analysis can significantly enhance the effectiveness of their predictive value. Simple Coding: incorrectly plots the hammer, inverted hammer, hanging man and shooting star, due to the lack of an added rule requiring that an uptrend or downtrend MUST be present. (Hammers that register after a selloff is much more valuable than a hammer that registers during a rally). Fibozachi Coding: includes an added rule, where the midpoint of the current bar must also be above or below the 8-day SMA, which confirms the presence of an uptrend / downtrend. This helps to properly validate candlestick pattern signals Fibozachi LLC All Rights Reserved. 24
26 We have devised each formula within our candlestick patterns in a comprehensive fashion. Since many candlestick patterns and their respective formulas are neither qualitatively defined nor uniformly agreed upon by the several seminal authors of candlestick literature, we have both manually and mathematically assessed the various interpretations to determine the formula and rules behind each pattern. Additionally, we have incorporated Fibonacci numbers and their derivative ratios into the vast majority of our uniquely coded candlestick pattern formulas, resulting in the creation of multifaceted and extremely powerful candlestick pattern Indicators. The following is a prime example of our initial frustration during the early stages of the developmental process: Author X states that a hammer s lower shadow must be at least 2 times the length of its real body, where author Y states that a hammer s lower shadow must be at least 3 times the length of its real body. If we follow the guideline of Author X we catch all signals, though they may be probabilistically weaker than those of Author Y. If we follow the guideline of Author Y we may miss some signals, though they may be probabilistically greater than those of Author X Fibozachi LLC All Rights Reserved. 25
27 Rather than relying on amorphous guidelines, our rule states that a hammer s lower shadow must be at least times the length of its real body. We also define that the Upper Shadow * < High-Low Range; in other words, the upper shadow must be less than 13.13% of the bar s entire range for the hammer pattern to verifiably confirm itself, thereby forming a valid signal. *** Our Standard Doji, Hammer, Inverted Hammer, Hanging Man, and Shooting Star Patterns employ the 13% Rule, where Open - Close <= 13% of the Range. We have also included Perfect Pattern versions (for classic candlestick pattern traders), wherever applicable, which employ a 3% Rule in order to isolate only the strongest, most textbook patterns that the market has to offer Fibozachi LLC All Rights Reserved. 26


28 Have a question about the Candlestick X-Ray Indicator Package? Contact us at support@fibozachi.com. We take great pride in our customer support and are happy to help our fellow traders! Fibozachi LLC All Rights Reserved. 27
29 The terms Company, us or we refer to Fibozachi.com, its parent company Fibozachi LLC, and all subsidiaries, affiliates, officers or employees therein. The term you refers to the user or customer of Fibozachi.com. The terms Content and Information refer to the indicators, tools, strategies, techniques, systems, manuals, data, communications and any other associated products or material of the Company. License: You are purchasing a single user license. You may not: copy, modify, publish, retransmit, participate in the transfer or sale of, distribute, perform, display, or create derivative works from, any of the Content or Information in any way. Disclaimer: All Content and Information provided is for educational purposes only. Fibozachi.com and Fibozachi LLC (the Company ) is not an investment advisory service, broker-dealer, commodity trading advisor, legal advisor, tax advisor, or registered investment advisor, and does not purport to tell or suggest which commodities, currencies or securities customers should buy or sell for themselves. The affiliates, employees or officers of the Company may hold positions in the commodities, currencies or securities discussed here. You understand and acknowledge that there is a high degree of risk involved in trading commodities, currencies or securities. You also understand and acknowledge that there is an extremely high degree of risk involved in trading leveraged vehicles such as futures or options, where you can lose more than the initial sum of your investment. The Company, its subsidiaries, affiliates, officers and employees assume no responsibility or liability for your trading or investment results. It should not be assumed that the indicators, tools, strategies, techniques, systems, manuals, data, communications or any other associated products and material of the Company, collectively the Content and Information, presented in its products or services will be profitable or that they will not result in losses. Past results of any individual trader or trading system published by Company are not indicative of future returns by that trader or system, and are not indicative of future returns, which may or may not be realized by you. In addition, the articles, blogs, chat, columns, indicators, methods, strategies, systems, techniques, tools, and all other features of Company's website (collectively, the Information ) are provided for educational purposes only and should not be construed as investment advice. Any articles, blogs, chat, columns, comments, discussions, drawings, and examples, including any other items intended to illustrate Information presented on Company's website, are for educational purposes only; such are not solicitations of any order to buy or sell. Accordingly, you should not rely solely on the Information in making any investment. Rather, you should use the Information only as a starting point for doing additional independent research in order to allow you to form your own opinion regarding any investment. You should always check with your licensed financial advisor and tax advisor to determine the suitability of any investment Fibozachi LLC All Rights Reserved. 28
30 IN CONSIDERING WHETHER TO TRADE, YOU SHOULD BE AWARE OF THE FOLLOWING: HYPOTHETICAL OR SIMULATED PERFORMANCE RESULTS HAVE CERTAIN INHERENT LIMITATIONS. UNLIKE AN ACTUAL PERFORMANCE RECORD, SIMULATED RESULTS DO NOT REPRESENT ACTUAL TRADING AND MAY NOT BE IMPACTED BY BROKERAGE AND OTHER SLIPPAGE FEES. ALSO, SINCE THE TRADES HAVE NOT ACTUALLY BEEN EXECUTED, THE RESULTS MAY HAVE UNDER- OR OVER-COMPENSATED FOR THE IMPACT, IF ANY, OF CERTAIN MARKET FACTORS, SUCH AS LACK OF LIQUIDITY. SIMULATED TRADING PROGRAMS IN GENERAL ARE ALSO SUBJECT TO THE FACT THAT THEY ARE DESIGNED WITH THE BENEFIT OF HINDSIGHT. NO REPRESENTATION IS BEING MADE THAT ANY ACCOUNT WILL OR IS LIKELY TO ACHIEVE PROFITS OR LOSSES SIMILAR TO THOSE SHOWN. TRADING IS AN EXTREMELY DIFFICULT PROBABILISTIC ENDEAVOR THAT REQUIRES TECHNICAL SKILL AND EMOTIONAL DISCIPLINE AT THE VERY MINIMUM. EVEN A GREAT TRADER WITH EXCELLENT ANALYSIS, RESOURCES, TOOLS, TECHNIQUES, STRATEGIES, PLANS, CONTINGENCIES, AND EXPLICITLY DEFINED RULES FOR MANAGING RISK EXPOSURE IS OFTEN WRONG. THERE ALWAYS REMAIN REAL AND UNQUANTIFIABLE RISKS SUCH AS GOVERNMENT INTERVENTION OF RULE / LAW CHANGES. RISK PREVENTION MEASURES SUCH AS PROTECTIVE STOPS DO NOT PREVENT THE RISK OF GAP OPENINGS OR LOCK-LIMIT MOVES. YOU AGREE THAT NEITHER FIBOZACHI LLC, NOR ITS SUBSIDIARIES, AFFILIATES, OFFICERS OR EMPLOYEES, SHALL BE LIABLE TO YOU OR ANY OTHER THIRD PARTY FOR ANY DIRECT, INDIRECT, INCIDENTAL, SPECIAL, OR CONSEQUENTIAL DAMAGES. MEMBERS AND VISITORS ( USERS ) AGREE TO INDEMNIFY AND HOLD FIBOZACHI LLC, AND ITS SUBSIDIARIES, AFFILIATES, OFFICERS AND EMPLOYEES, HARMLESS FROM ANY CLAIM OR DEMAND, INCLUDING REASONABLE ATTORNEYS FEES, MADE BY ANY THIRD PARTY DUE TO OR ARISING OUT OF A USER S USE OF FIBOZACHI LLC S WEBSITE. TradeStation Disclaimer: Neither TradeStation Technologies nor any of its affiliates has reviewed, certified, endorsed, approved, disapproved or recommended, and neither does or will review, certify, endorse, approve, disapprove or recommend, any trading software tool that is designed to be compatible with the TradeStation Open Platform Fibozachi LLC All Rights Reserved. 29
Equal open and close candles. ( known as doji candles ) Short body candles. Long body candles.
 Short body candles. Long body candles.") I have broken down the patterns into 3 categories: Equal open and close candles. ( known as doji candles ) Short body candles. Long body candles. Within these categories are both bullish reversal and bearish
I have broken down the patterns into 3 categories: Equal open and close candles. ( known as doji candles ) Short body candles. Long body candles. Within these categories are both bullish reversal and bearish
Candlestick Charting Quick Reference Guide
 Quickly and easily master the common Candlestick Charting patterns, with the Candlestick Charting Quick Reference Guide www.yourtradingcoach.com Because you d rather be trading for a living! Disclaimer
CANDLESTICK TRADING STRATEGIES
 TAFX CANDLESTICK TRADING STRATEGIES Disclaimer is in no way affiliated or representative of any other company, organisation, club or society, and the views presented are solely our own opinions. The author(s)
THE POWER OF JAPANESE CANDLESTICK CHARTS
 THE POWER OF JAPANESE CANDLESTICK CHARTS Founded in 1807, John Wiley & Sons is the oldest independent publishing company in the United States. With offi ces in North America, Europe, Australia and Asia,
SPECIAL REPORT: CANDLESTICK PATTERN SUMMARY
 SPECIAL REPORT: CANDLESTICK PATTERN SUMMARY Louise Bedford This Special Report is an extract from the Candlestick Charting Home Study Course. It is a handy, quick reference guide that you can refer to
Use of Candlestick charts
 Use of Candlestick charts Candlestick chart was developed in 1700s in Japan by a man named Munehisa Homma, originally designed to trade rice futures in the 17th century, he invented a method to analyze
Candlestick Formations
 Presents Candlestick Formations By Russ Horn 1 RISK DISCLOSURE STATEMENT / DISCLAIMER AGREEMENT Trading any financial market involves risk. This report and all and any of its contents are neither a solicitation
The Candlestick EXPRESS Class with Steve Nison
 With Steve Nison, CMT President: Candlecharts.com & the first to reveal candlesticks to the Western world Candlestick Charting Techniques Candles + Western Charting Tools Candles for Trade Management 1
The advantage of candlestick charts is the ability to highlight trend weakness and reversal signals that may not be apparent on a normal bar chart.
 CANDLESTICKS CHART Candlesticks contain the same data as a normal bar chart but highlight the relationship between opening and closing prices. The narrow stick represents the range of prices traded during
Candlesticks: What they are and how to use them? NUS Investment Society Global Macro Department Gideon Wong & Devin Nathanael GM Research Analyst
 Candlesticks: What they are and how to use them? NUS Investment Society Global Macro Department Gideon Wong & Devin Nathanael GM Research Analyst Disclaimer NUS Invest is in no way affiliated or representative
Candlesticks by Louizos Alexander Louizos,
 CANDLESTICKS CHARTING As we mentioned before candlesticks behold some trend signals. In this chapter you will learn how to correctly evaluate trends using candlestick charts. Always remember: candlesticks
Japanese candlestick charts, discussed in Chapter 3, are an alternative
 The Visual Investor: How to Spot Market Trends, Second Edition By John J. Murphy Copyright by John J. Murphy. APPENDIX B Japanese Candlesticks Japanese candlestick charts, discussed in Chapter 3, are an
17 Money Making CandleStick Formations. you can use today in MarketClub
 17 Money Making CandleStick Formations you can use today in MarketClub Candlestick lines and charts Candlestick lines and charts -- traditional Japanese charts whose individual lines look like candles,
Frontline FX: Key Candlestick Strategies for Profitable FX Trades Candlestick Essentials and Beyond for FX
 Frontline FX: With Steve Nison, CMT President: Candlecharts.com Easy to Understand Early Reversals Safety First East + West All FX markets All Time Frames Accelerates Analysis Current volatility in FX
Chapter 3 THEORETICAL FRAMEWORK OF CANDLESTICK CHARTS. way about candlestick charts. The details of the same is shown as follows.
 Chapter 3 THEORETICAL FRAMEWORK OF CANDLESTICK CHARTS After the extensive review of literature, this chapter gives the conceptual and back ground of the technicalities of the study. The study covers about
BULLISH ENGULFING. Confirmation: Suggested. No. of Sticks: 2
 BULLISH ENGULFING Type: Reversal Medium Engulfing Pattern is a pattern characterized by a large white real body engulfing a preceding small black real body, which appears during a downtrend. The white
The Stair Step Trade. Written By: Jason Ramus Copyright: 2017
 The Stair Step Trade Written By: Jason Ramus www.daytradingfearless.com Copyright: 2017 The Waterfall Introduction: Let me first say thank you for taking the time to read this amazing Book. I believe this
Teodosi s Simple Oscillator-based System ( Forex Strategies Revealed - Simple System #8)
") ( Forex Strategies Revealed - Simple System #8) http://forex-strategies-revealed.com -DISCLAIMER- Virtually all of the information in this paper was sourced from the Forex Strategies Revealed website.
( Forex Strategies Revealed - Simple System #8) http://forex-strategies-revealed.com -DISCLAIMER- Virtually all of the information in this paper was sourced from the Forex Strategies Revealed website.
Prepared by Dave Forster April 9, 2016
 Candlesticks Prepared by Dave Forster April 9, 2016 Who is this guy? Methods of Technical Analysis Technical Analysis Inputs Price vs. Volume How I approach Charting How a Candlestick is Constructed Neutral
Encyclopedia of Candlestick Charts
 Encyclopedia of Candlestick Charts Founded in 1807, John Wiley & Sons is the oldest independent publishing company in the United States. With offices in North America, Europe, Australia, and Asia, Wiley
If I was to suggest that the charts you are looking at could be literally speaking to you, would you think I had gone slightly mad?
 Section Two Get to know your Charts Runtime 10min 37s So we now have covered off the basics, you ve got your platform open, charts at the ready & your raring to find out how all these traders make mega
The secret meaning of Japanese Candlesticks
 The secret meaning of Japanese Candlesticks Part 2 By Vladimir Ribakov Creator of: www.vladimirforexsignals.com http://www.vladimirmarketsforecast.com/ www.forex-lst-syetem.com 2 nd edition, July 2013
Blips By David Duty CTA Price $99.00 Includes 60 Minutes of Video on Blips
 Blips By David Duty CTA www.commonsensecommodities.com Price $99.00 Includes 60 Minutes of Video on Blips Page 1 My name is David Duty and I m a CTA or Commodity Trading Advisor and I started trading commodities
The Origins of Japanese Candlestick Charting
 The Origins of Japanese Candlestick Charting Munehisa Homma (1724-1803), also referred to as Sokyu Homma or Sokyu Honma, was a wealthy rice merchant and trader from Sakata, Japan who lived during during
Rick Saddler s Introduction to Trading with. Japanese Candlesticks
 Rick Saddler s with Japanese Candlesticks him Learning to Read Stock Charts With Japanese Candlesticks Rick Saddler Hit and Run Candlesticks Trading for Profits, LLC Phone: (417) - 848-3519 www.hitandruncandlesticks.com
Candlestick Patterns (Every trader should know)
") Candlestick Patterns (Every trader should know) A doji represents an equilibrium between supply and demand, a tug of war that neither the bulls nor bears are winning. In the case of an uptrend, the bulls
Candlestick Patterns (Every trader should know) A doji represents an equilibrium between supply and demand, a tug of war that neither the bulls nor bears are winning. In the case of an uptrend, the bulls
THE MAJOR CANDLESTICKS SIGNALS
 THE MAJOR CANDLESTICKS SIGNALS Profit BIG with Candlesticks Master these Major Candlestick Signals it you want to Master the Market. Copyright @ Stephen W. Bigalow May not be duplicated or distributed
by Ashwani Gujral Getting the best of East and West.
 by Ashwani Gujral Getting the best of East and West. Candlestick charting signals can be used in conjunction with Western indicators and the results achieved might be better than using them individually.
Steve Nison s Candlecharts.com Secrets of Intraday Candlesticks for Day and Swing Traders
 With Steve Nison, CMT President: Candlecharts.com Legal Notice: This webcast and recording is Candlecharts.com and may not be copied, retransmitted, nor distributed in any manner whatsoever, including,
How to Read the Stock Chart
 How to Read the Stock Chart Stock charts There are several different kinds of charts: line chart OHLC chart candlestick Line charts The line chart is a single line with starting and ending points. The
The secrets of Candlestick Charts Unveiled
 NeW york ChICAgO LONDON DUBAI* TOkyO singapore sydney ADA The secrets of Candlestick Charts Unveiled By GFT Above all, Integrity. FUTURES FOREX CFDs Worldwide Leaders in Online Trading CD04U.041.102808
Important Information and Disclaimer:
 Important Information and Disclaimer: TradeStation Securities, Inc. seeks to serve institutional and active traders. Please be advised that active trading is generally not appropriate for someone of limited
Candlesticks for Intraday and Swing Trading. Day 1 with Steve Nison, CMT President: Candlecharts.com
 Candlesticks for Intraday and Swing Trading Day 1 with Steve Nison, CMT President: Candlecharts.com Slide 2 Media Comments Japan's Candlesticks Light Traders' Path - Wall Street Journal Whether you day
Candles shed light on the market
 Candles shed light on the market By KIRA MCCAFFREY BRECHT When Steve Nison provided trade recommendations to brokers at Shearson Lehman Hutton, where he worked in the futures research department more than
Chifbaw Oscillator User guide
 Chifbaw Oscillator User guide www.chifbaw.com Indicator and document revision: 1.2 Known bugs: -The alert function system gives sometimes a fake alert when the indicator is initiated on a given currency
Findings. A Number of Candles Do Not Work as Expected
 1 Findings Arguably, you are reading the most important chapter because it discusses the discoveries I made about candles while researching this book. You may already know some of them, but the others
An Investor's Guide to Candlestick Patterns
 An Investor's Guide to Candlestick Patterns By Gordon Kristopher Dec 12, 2014. 03:34 PM What Are Candlestick Patterns in Technical Analysis? Candlestick patterns In technical analysis, candlestick patterns
Candlesticks. The Basics. Anatomy Of A Candlestick
 Candlesticks The Basics Japanese Candlesticks provide an excellent piece of the Technical Analysis puzzle. Each candle gives you the opening price, the low of the period, the high of the period and the
COPYRIGHTED MATERIAL. Candlesticks = Signals INTRODUCTION
 1 Candlesticks = Signals INTRODUCTION Traders and investors have been looking at charts for well over 85 years as Edwin Lefèvre wrote (1994, p. 61), I should say that a chart helps those who can read it
Hilbert Sine Wave Don't Trade Cycles Without It!
 Hilbert Sine Wave Don't Trade Cycles Without It! Summary of what you'll learn in the feature article below: The Hilbert Sine Wave is a unique indicator it combines the best characteristics of an oscillator
Sentiment: The emotions, plans, or thought processes that lead up to the buying or selling of a security. I personally define sentiment this way.
 Hi Traders! I trust this article finds you well! I am sure many of you know my affinity for candlesticks and their importance as it relates to trading. A good saying to remember is, The stock market rewards
PCF s for TC2000 and TCNet Users 3 MAJOR SIGNALS. Volume II: The Hammer. The Shooting Star. The Harami
 PCF s for TC2000 and TCNet Users 3 MAJOR SIGNALS Volume II: The Hammer The Shooting Star The Harami A Candlestick Forum publication Years of Candlestick Analysis made available in concise formats. Information
With Steve Nison, CMT President: Candlecharts.com
 With Steve Nison, CMT President: Candlecharts.com Legal Notice: This recording is Candlecharts.com and may not be copied, retransmitted, nor distributed in any manner whatsoever, including, but not limited
Telemet Orion v5.0x New Features
 Telemet Orion v5.0x New Features What are: Trendlines Point and Figure Charts Candlesticks Trendlines Eight new trendline studies are offered in Telemet Orion v5.0x. Access these with the pull down menu
Reversing candles. Three black crows. Exhibit 13.0 The three black crows pattern
 Three black crows Reversing candles Three black crows Exhibit 13.0 The three black crows pattern The pattern of upside gap two crows has two black candles gap upon the previous bullish real body. The three
A Statistical Analysis of the Predictive Power of Japanese Candlesticks
 Journal of International & Interdisciplinary Business Research Volume 5 Article 5 June 2018 A Statistical Analysis of the Predictive Power of Japanese Candlesticks Mohamed Jamaloodeen Georgia Gwinnett
Candlestick Secrets for Profiting in Options Seminar Bonus module- Using NCS to set up option trades + Bouncing Ball strategy
 Bonus Module: Option trade setups using NCS+ The bouncing ball trade setup 1 For the FREE Ninja Trader (and other) platforms 2 Let NCS do the work for you! Save hours of research time Automatically find
The Application of Japanese Candlestick Trading Strategies in Taiwan
 The Application of Japanese Candlestick Trading Strategies in Taiwan AUTHORS ARTICLE INFO JOURNAL FOUNDER YeongJia Goo DarHsin Chen YiWei Chang YeongJia Goo, DarHsin Chen and YiWei Chang (2007). The Application
Steve Nison s Quick Start Guide to Correctly Using Candlesticks. WithSteve Nison, CMT President: Candlecharts.com
 WithSteve Nison, CMT President: Candlecharts.com 1 Benefits of Nison Candlesticks Any market Any time frame Simple to apply Safety first trading Early reversals for razor sharp entries and exits Profit
21 CANDLESTICKS EVERY TRADER SHOULD KNOW. Dr. Melvin Pasternak
 21 CANDLESTICKS EVERY TRADER SHOULD KNOW Dr. Melvin Pasternak Working Title: 21 Candlesticks Every Trader Should Know Author: Dr. Melvin Pasternak Publisher: Marketplace Books Release Date: January 2006
A study on one-day candlestick patterns in the Chinese stock market
 A study on one-day candlestick patterns in the Chinese stock market Abstract This study addresses the absence of research dealing with the profitability of one-day candlestick patterns in the Chinese stock
Copyright UCRP
 www.candlestickreversalpattern.com Copyright UCRP Introduction I don t want this book to have dozens of unnecessary pages of material that would do you no good in order to impress you. That s why I m going
Basic Technical Analysis
 Basic Technical Analysis Disclaimer You may from time to time be provided with marketing material, investment & financial related information and reports, including but not limited to research reports
This strategy will identify a break of a trend and take advantage of the movement to the opposite direction.
 Thanks for checking out the RSI 80-20 Trading Strategy, You are going to benefit from this strategy by learning to trade divergence, and finding a low risk way to sell near the top or buy near the bottom
TeleTrader FlashChart
 TeleTrader FlashChart Symbols and Chart Settings With TeleTrader FlashChart you can display several symbols (for example indices, securities or currency pairs) in an interactive chart. You can also add
FlashChart. Symbols and Chart Settings. Main menu navigation. Data compression and time period of the chart. Chart types.
 FlashChart Symbols and Chart Settings With FlashChart you can display several symbols (for example indices, securities or currency pairs) in an interactive chart. You can also add indicators and draw on
Candlestick Patterns And Trading Strategies
 We have made it easy for you to find a PDF Ebooks without any digging. And by having access to our ebooks online or by storing it on your computer, you have convenient answers with candlestick patterns
candelsticks 101 notes for web.notebook Candlesticks 101
 Candlesticks 101 1 The most basic skill needed for investing is... the ability to read a stock chart and then understand how that data can aid your investing success. One of the biggest mistakes of today's
Neural pattern recognition with self-organizing maps for efficient processing of forex market data streams
 Neural pattern recognition with self-organizing maps for efficient processing of forex market data streams Piotr Ciskowski, Marek Zaton Institute of Computer Engineering, Control and Robotics Wroclaw University
EURAUD, EURUSD, GBPUSD, GBPCHF
 30 pip method This is an amazing strategy which can net you 20 30 pips every day. Once you hit 20 pips for the day stop. Trade this strategy either 1 hour after the London Open or if you are in USA, trade
I find my greatest pleasure, and so my reward, in the work that precedes what the world calls success. ~Thomas Edison
 Fluidity Trader Chat Room w/cynthia E. - Friday, January 18, 2019: Page Begin Page End Chat Roll Time Friday 1.18.19 1 11 CENTRAL Time Zone 6:30 *** Hello Fluidity Team Traders Welcome! *** 6:30 *** DAILY
200 MHz, 35 db gain reverse amplifier. High performance amplifier in a SOT115J package, operating at a voltage supply of 24 V (DC).
.") Rev. 6 5 August 2010 Product data sheet 1. Product profile 1.1 General description High performance amplifier in a SOT115J package, operating at a voltage supply of 24 V (DC). CAUTION This device is sensitive
Rev. 6 5 August 2010 Product data sheet 1. Product profile 1.1 General description High performance amplifier in a SOT115J package, operating at a voltage supply of 24 V (DC). CAUTION This device is sensitive
To accomplish great things, we must not only act, but also dream; not only plan, but also believe! ~ A. France
 Fluidity Trader Chat Room w/cynthia E. - Wednesday, January 02, 2019: Page Begin Page End Chat Roll Time Wednesday 1.02.19 1 11 CENTRAL Time Zone 6:30 *** Hello Fluidity Team Traders Welcome! *** 6:30
FOLLOW THE SMART MONEY: LET CANDLES & VOLUME GUIDE THE WAY
 FOLLOW THE SMART MONEY: LET CANDLES & VOLUME GUIDE THE WAY January 2009 By Todd Krueger Compared to the common bar chart, candlestick charts are visually more capable of revealing the psychology and sentiment
TERMS AND CONDITIONS. for the use of the IMDS Advanced Interface by IMDS-AI using companies
 TERMS AND CONDITIONS for the use of the IMDS Advanced Interface by IMDS-AI using companies Introduction The IMDS Advanced Interface Service (hereinafter also referred to as the IMDS-AI ) was developed
75 MHz, 30 db gain reverse amplifier
 Rev. 5 28 September 2010 Product data sheet 1. Product profile 1.1 General description Hybrid high dynamic range amplifier module in a SOT115J package operating at a voltage supply of 24 V (DC). CAUTION
FLOP EQUITY ONE PAIR MATCH-UPS OVERPAIR VS TWO PAIR (~30/70) Q 9 2 Hand Equity Q2** 71.06% AA** 28.94% BARE OVERPAIR VS BARE TOP TWO
 Q 9 2 Hand Equity Q2** 71.06% AA** 28.94% BARE OVERPAIR VS BARE TOP TWO") Legal Notices NO RIGHT TO REDISTRIBUTE MATERIALS. You agree that you will not re-distribute, copy, amend, or commercially exploit any materials found on in this publication or related Web Sites without
Legal Notices NO RIGHT TO REDISTRIBUTE MATERIALS. You agree that you will not re-distribute, copy, amend, or commercially exploit any materials found on in this publication or related Web Sites without
BB Product profile. 2. Pinning information. 3. Ordering information. FM variable capacitance double diode. 1.1 General description
 SOT23 Rev. 3 7 September 2011 Product data sheet 1. Product profile 1.1 General description The is a variable capacitance double diode with a common cathode, fabricated in silicon planar technology, and
DOWNLOAD PDF ENCYCLOPEDIA OF CHART PATTERNS BULKOWSKI
 Chapter 1 : Encyclopedia of Candlestick Charts (ebook, PDF) von Thomas N. Bulkowski - Portofrei bei the In this revised and expanded second edition of the bestselling Encyclopedia of Chart Patterns, Thomas
DATA SHEET. BAP50-05 General purpose PIN diode DISCRETE SEMICONDUCTORS. Product specification Supersedes data of 1999 Feb May 10.
 DISCRETE SEMICONDUCTORS DATA SHEET alfpage M3D088 Supersedes data of 1999 Feb 01 1999 May 10 FEATURES Two elements in common cathode configuration in a small-sized plastic SMD package Low diode capacitance
DISCRETE SEMICONDUCTORS DATA SHEET. k, halfpage M3D102. BAP64-04W Silicon PIN diode Jan 29. Product specification Supersedes data of 2000 Jun 06
 DISCRETE SEMICONDUCTORS DATA SHEET k, halfpage M3D12 Supersedes data of 2 Jun 6 21 Jan 29 FEATURES High voltage, current controlled RF resistor for RF attenuators and switches Low diode capacitance Low
Price Headley could be your personal trading coach!
 PRICE HEADLEY Price Headley could be your personal trading coach! Would you like to regularly talk with Price about the markets, stocks, options, superior indicators and most profitable methods? Would
Planar PIN diode in a SOD523 ultra small SMD plastic package.
 Rev. 5 28 September 2010 Product data sheet 1. Product profile 1.1 General description Planar PIN diode in a SOD523 ultra small SMD plastic package. 1.2 Features and benefits High voltage, current controlled
DISCRETE SEMICONDUCTORS DATA SHEET. BAP65-03 Silicon PIN diode. Product specification Supersedes data of 2001 May Feb 11
 DISCRETE SEMICONDUCTORS DATA SHEET Supersedes data of 2001 May 11 2004 Feb 11 FEATURES PINNING High voltage, current controlled RF resistor for RF switches Low diode capacitance Low diode forward resistance
DISCRETE SEMICONDUCTORS DATA SHEET. book, halfpage MBD128. BGA2022 MMIC mixer Dec 04. Product specification Supersedes data of 2000 Jun 06
 DISCRETE SEMICONDUCTORS DATA SHEET book, halfpage MBD128 Supersedes data of 2000 Jun 0 2000 Dec 0 FEATURES PINNING Large frequency range: Cellular band (900 MHz) PCS band (1900 MHz) WLAN band (2. GHz)
Hex inverting buffer; 3-state
 Rev. 9 18 March 2016 Product data sheet 1. General description 2. Features and benefits 3. Ordering information The is a hex inverting buffer with 3-state outputs. The 3-state outputs are controlled by
PESD3V3S1UB. 1. General description. 2. Features and benefits. 3. Application information. 4. Quick reference data
 29 November 2018 Product data sheet 1. General description 2. Features and benefits 3. Application information 4. Quick reference data Unidirectional ElectroStatic Discharge (ESD) protection diode in a
Design and Implementation of Candlestick Chart Retrieval Algorithm for Predicting Stock Price Trend
 Design and Implementation of Candlestick Chart Retrieval Algorithm for Predicting Stock Price Trend Yoshihisa Udagawa Computer Science Department, Faculty of Engineering, Tokyo Polytechnic University Atsugi-city,
FRESCO WHITEPAPER
 FRESCO WHITEPAPER 01.21.2018 CONTENTS I. Disclaimer II. About III. Art market today IV. Art market with Fresco V. TOKEN (FRES) distribution VI. Roadmap Disclaimer IMPORTANT NOTICE PLEASE READ THIS ENTIRE
The Secret to High Performance Trading. Discover Where your strength and weaknesses lie
 The Secret to High Performance Trading Discover Where your strength and weaknesses lie 1 Being able to perform as a winning trader requires action without a lot of theory and discussion start right now!
Flavio Graziano & Aken Stienka: AKENDICATOR indicator tutorial AKENDICATOR TUTORIAL. Revolutionary indicator for Binary Options on Metatrader
 AKENDICATOR TUTORIAL Revolutionary indicator for Binary Options on Metatrader NOT REPAINT INDICATOR First of all, sorry for our not perfect English. However Akendicator is so easy and we hope you understand
PESD24VL1BA. 1. General description. 2. Features and benefits. 3. Applications. 4. Quick reference data
 Low capacitance bidirectional ESD protection diode in SOD323 12 July 2018 Product data sheet 1. General description Bidirectional ElectroStatic Discharge (ESD) protection diode in a very small SOD323 (SC-76)
VHF variable capacitance diode
 Rev. 1 25 March 2013 Product data sheet 1. Product profile 1.1 General description The is a variable capacitance diode, fabricated in planar technology, and encapsulated in the SOD323 (SC-76) very small
DATA SHEET. BGE MHz, 17 db gain push-pull amplifier DISCRETE SEMICONDUCTORS. Product specification Supersedes data of 1999 Mar 30.
 DISCRETE SEMICONDUCTORS DATA SHEET book, halfpage M3D248 BGE885 860 MHz, 17 db gain push-pull amplifier Supersedes data of 1999 Mar 30 2001 Oct 31 FEATURES PINNING - SOT115D Excellent linearity Extremely
Worldwide Market Forecasts for the Video Game and Interactive Entertainment Industry:
 DFC Intelligence DFC Intelligence Phone 858 780-9680 9320 Carmel Mountain Rd Fax 858-780-9671 Suite C www.dfcint.com San Diego, CA 92129 Worldwide Market Forecasts for the Video Game and Interactive Entertainment
DATA SHEET. CGY887A 860 MHz, 25.5 db gain push-pull amplifier DISCRETE SEMICONDUCTORS. Product specification Supersedes data of 2001 Oct 25
 DISCRETE SEMICONDUCTORS DATA SHEET book, halfpage M3D252 CGY887A 860 MHz, 25.5 db gain push-pull amplifier Supersedes data of 2001 Oct 25 2002 Apr 18 FEATURES High gain Superior linearity Extremely low
Pickens Savings and Loan Association, F.A. Online Banking Agreement
 Pickens Savings and Loan Association, F.A. Online Banking Agreement INTERNET BANKING TERMS AND CONDITIONS AGREEMENT This Agreement describes your rights and obligations as a user of the Online Banking
DISCRETE SEMICONDUCTORS DATA SHEET. BFS17W NPN 1 GHz wideband transistor. Product specification Supersedes data of November 1992.
 DISCRETE SEMICONDUCTORS DATA SHEET Supersedes data of November 1992 1995 Sep 4 APPLICATIONS Primarily intended as a mixer, oscillator and IF amplifier in UHF and VHF tuners. DESCRIPTION Silicon NPN transistor
Quad 2-input EXCLUSIVE-NOR gate
 Rev. 6 10 December 2015 Product data sheet 1. General description 2. Features and benefits 3. Ordering information The is a quad 2-input EXCLUSIVE-NOR gate. The outputs are fully buffered for the highest
HEF4002B. 1. General description. 2. Features and benefits. 3. Ordering information. 4. Functional diagram. Dual 4-input NOR gate
 Rev. 4 17 October 2016 Product data sheet 1. General description 2. Features and benefits 3. Ordering information The is a dual 4-input NOR gate. The outputs are fully buffered for highest noise immunity
Candlestick Charts: Your Complete Beginner's Guide To Reading Candlestick Charts By Christopher Daniels
 Candlestick Charts: Your Complete Beginner's Guide To Reading Candlestick Charts By Christopher Daniels For seasoned traders, candlesticks hold no secrets. However, for beginners they can seem intimidating
DATA SHEET. BGY MHz, 15 db gain push-pull amplifier DISCRETE SEMICONDUCTORS. Product specification Supersedes data of 1997 Apr 14.
 DISCRETE SEMICONDUCTORS DATA SHEET book, halfpage M3D252 BGY883 860 MHz, 15 db gain push-pull amplifier Supersedes data of 1997 Apr 14 2001 Oct 31 FEATURES PINNING - SOT115J Excellent linearity Extremely
KKR & Co. Inc. Goldman Sachs U.S. Financial Services Conference December 4, 2018
 KKR & Co. Inc. Goldman Sachs U.S. Financial Services Conference December 4, 2018 KKR Today Private Markets Public Markets Capital Markets Principal Activities $104bn AUM $91bn AUM Global Franchise $19bn
DATA SHEET. BGY1085A 1000 MHz, 18.5 db gain push-pull amplifier DISCRETE SEMICONDUCTORS. Product specification Supersedes data of 1997 Apr 15
 DISCRETE SEMICONDUCTORS DATA SHEET book, halfpage M3D252 Supersedes data of 1997 Apr 15 2001 Oct 25 FEATURES PINNING - SOT115J Excellent linearity Extremely low noise Silicon nitride passivation Rugged
LOCMOS (Local Oxidation CMOS) to DTL/TTL converter HIGH sink current for driving two TTL loads HIGH-to-LOW level logic conversion
 to DTL/TTL converter HIGH sink current for driving two TTL loads HIGH-to-LOW level logic conversion") Rev. 11 23 June 2016 Product data sheet 1. General description 2. Features and benefits 3. Applications 4. Ordering information The provides six inverting buffers with high current output capability suitable
Rev. 11 23 June 2016 Product data sheet 1. General description 2. Features and benefits 3. Applications 4. Ordering information The provides six inverting buffers with high current output capability suitable
Master Heikin-Ashi with this Trading Strategy
 Master Heikin-Ashi with this Trading Strategy Roman Sadowski - Humbletraders.com What is it? Heikin-Ashi chart looks like the candlestick chart but the method of calculation and plotting of the candles
DATA SHEET. BGD MHz, 20 db gain power doubler amplifier DISCRETE SEMICONDUCTORS. Product specification Supersedes data of 1999 Mar 26
 DISCRETE SEMICONDUCTORS DATA SHEET book, halfpage M3D252 860 MHz, 20 db gain power doubler Supersedes data of 1999 Mar 26 2001 Nov 01 FEATURES Excellent linearity Extremely low noise Silicon nitride passivation
HEF4014B. 1. General description. 2. Features and benefits. 3. Applications. 4. Ordering information. 8-bit static shift register
 Rev. 10 17 October 2018 Product data sheet 1. General description 2. Features and benefits 3. Applications The is a fully synchronous edge-triggered with eight synchronous parallel inputs (D0 to D7), a
Quad 2-input EXCLUSIVE-NOR gate
 Rev. 4 18 July 2014 Product data sheet 1. General description 2. Features and benefits 3. Ordering information The is a quad 2-input EXCLUSIVE-NOR gate. The outputs are fully buffered for the highest noise
Four planar PIN diode array in SOT363 small SMD plastic package.
 Rev. 4 7 March 2014 Product data sheet 1. Product profile 1.1 General description Four planar PIN diode array in SOT363 small SMD plastic package. 1.2 Features and benefits High voltage current controlled