DEAR FRIENDS OF AGRICULTURE,
|
|
|
- Shauna Dalton
- 6 years ago
- Views:
Transcription
1 1
2 2


3 DEAR FRIENDS OF AGRICULTURE, This year, Florida commemorates the 500th anniversary of Juan Ponce de León's discovery of our state. After the Europeans landed in Florida in 1513 and established settlements throughout the peninsula, they introduced many of the crops that make up Florida s landscape today. Ponce de León planted citrus trees near St. Augustine and brought the first cattle to the new land. Florida s early settlers faced hardships and at times had just enough to feed themselves. Despite the challenges that come from severe freezes and limited water supply, Florida's agriculture industry endured and thrived. The industry's tenacity and strength enables our great state to provide food and fiber for Floridians and many others throughout the world. Today, Florida s 47,500 farms produce nearly 300 different commodities on more than 9 million acres of land. Florida s famed agriculture industry employs 2 million people and contributes more than $104 billion to our state s economy each year was a great year for many commodities grown in Florida. Cucumbers ($67 million), grapefruit ($187 million), oranges ($1.5 billion), snap beans ($167 million), sweet corn ($180 million) and watermelons ($138 million) all reached higher than their 2011 levels. Find these figures and much more in this special edition of Florida Agriculture by the Numbers. This publication, produced by the Florida Department of Agriculture and Consumer Services, is a compilation of useful data, details and information that summarizes Florida s agricultural impact to our state. Collectively, these figures demonstrate the impact of Florida agriculture, an industry that feeds and enriches the lives of millions of people in Florida, the United States and throughout the world. Sincerely, ADAM H. PUTNAM COMMISSIONER OF AGRICULTURE 3
.")
4 ACKNOWLEDGMENT The acreage, production, and value statistics in this publication are the official State and USDA estimates prepared by the National Agricultural Statistics Service (NASS), Florida Field Office in cooperation with the Florida Department of Agriculture and Consumer Services (FDACS). These estimates are current as of June 2013 and may be revised later in the year or in the following year, if additional data become available. Any revisions made to these estimates, as well as estimates made after June 2013, are included in reports posted to the website shown below and available from the NASS Florida Field Office. Most of the data used to develop these estimates were provided voluntarily by growers, shippers, and processors and we sincerely appreciate their public spirited cooperation. The Florida Tomato Committee, the Florida Fruit and Vegetable Association, Florida Department of Citrus, floriculture and nursery producers, sales agencies, and transportation firms have provided valuable assistance and data throughout the season. The FDACS Bureau of State Farmers Markets and the County Agricultural Agents of the University of Florida Cooperative Extension Service were also very helpful in supplying area and county estimates. The individuals and organizations who make up the Florida agricultural industry need reliable and accurate estimates of production to make informed and knowledgeable decisions. Increasing unpredictability of commodity prices and competition from global markets, make accurate and unbiased estimates even more important. Farmers, agribusinesses, producers groups, educators, researchers, legislators, and the media all need these estimates to develop sound policies and to promote Florida agricultural products. I want to express my sincere gratitude to our dedicated staff of statisticians, support personnel, citrus field staff, and field and telephone enumerators. They are the ones who have worked hard to collect, review, and summarize these important data and publish the results. All NASS reports are available free of charge at: (National reports) (Florida reports) Jim Ewing State Statistician, USDA/NASS Florida Field Office 4

5 FLORIDA AGRICULTURE BY THE NUMBERS Florida Agriculture by the Numbers has been published to provide you with reliable, comprehensive information and data on Florida agriculture. People worldwide use the basics of food, fiber and forestry products daily. Florida s producers contribute greatly to the bounty enjoyed in Florida, the United States and beyond. The following pages tell their story of productivity, innovation and delivery. This reference book is divided by sections for ease of use. The Agricultural Overview Section provides a general overview of Florida agriculture. The Agricultural Statistics Section presents comparative performances of major commodity groups and benchmark economic data. The Groups Directory Section offers contact information for a variety of agricultural related entities. Both public and private organizations are listed. The Department Contacts Section identifies the Florida Department of Agriculture and Consumers Services divisions with contact information. As is occasionally the case when analyzing agricultural and economic data, numbers in rows or columns do not always sum exactly. This usually occurs when large numbers are abbreviated or when composite prices are compiled. The difference in these cases is a rounding margin. The rounding of numbers occurs in these pages when space is a consideration. Whether you are using this book to learn more about Florida agriculture, as a reference for contact information or for any other use, Florida Agriculture by the Numbers will definitely serve as an excellent reference source throughout the year. Together, these sections provide a valuable insight to Florida agriculture and its impact on Florida s economy. We are pleased to present Florida Agriculture by the Numbers. If you need additional information or assistance, please call the Division of Marketing and Development at (850) The Editorial Staff Florida Agriculture by the Numbers 5
6 TABLE OF CONTENTS COMMISSIONER S LETTER...1 ACKNOWLEDGEMENT...2 ABOUT THIS DIRECTORY...3 TABLE OF CONTENTS...4 FLORIDA AGRICULTURE OVERVIEW...7 FLORIDA CASH RECEIPTS...8 Florida Cash Receipts by Years...10 United States Cash Receipts by Leading States...11 Florida s Leading Cash Receipts by Commodity...13 FARMS AND LAND IN FARMS...14 Florida Farm Workers...16 Florida Farm Income, Expenses, and Cash Rents...17 CITRUS Season Citrus Highlights...21 Fruit Harvesting Season...24 Citrus Production by Counties...25 Citrus Acreage by Counties...27 Citrus Trees by Counties...29 Citrus Trees, Acreage, Yield, Production, Utilization, Season Average On-Tree Price, and Value...32 Oranges...32 Grapefruit...34 Tangerines...35 Tangelos, Temples, and Lemons...36 Avocados...37 FIELD CROPS Field Crops Highlights...39 Acreage, Yield, Production, and Value Production, Price, and Value, by Variety...44 Pecans...44 Acreage, Yield, and Production, by County...45 Peanuts...45 Cotton, Sugarcane...46 Usual Planting and Harvesting Dates, Crops and Principal Producing Areas...48 District Map...49 LIVESTOCK AND PRODUCTS...50 Livestock Highlights...51 Beef and Milk Cows that have Calved, and Beef and Dairy Herd Replacement Heifers...52 Milk Cow Inventory by County, Milk Cows, Monthly Milk Production, and Annual Production...54 Milk Production, Utilization, Milkfat, and Cash Receipts...55 Monthly and Annual Average Milk Price for Milk Marketed by Producers to Plants
7 Replacement Milk Cow Price per Head, by Quarter Cattle and Calves Inventory of Cattle and Calves, by County Inventory of Beef Cows, by County Marketings, Cash Receipts, and Gross Income Cows, Bulls, Steers, Heifers, and Calves on Farms Cattle and Calves Inventory January 1, Annual Calf Crop, and Disposition Cattle Prices Florida Livestock Auctions Cattle and Calves Sold through Florida Auction Markets, by Area Poultry Annual Value of Production Layers, Eggs Produced, and Value of Production Broilers Produced, Pounds Produced, Price per Pound, and Value of Production Layers, Daily Rate of Lay, and Egg Production, by Month and Year Broiler-type Chicks Hatched in Florida by Commercial Hatcheries Hogs Hogs on Farms and Inventory Value Hog Inventory, Pig Crop, and Disposition Hog Inventory December 1, Annual Marketings, Cash Receipts, and Gross Income Florida Commercial Hog Slaughter; Head, Average Live Weight, and Total Live Weight VEGETABLES, MELONS AND BERRIES Season Vegetable Highlights Weather for the 2012 Growing Season Definitions and Explanations Confidentiality of Collected Data and Release Distribution Policy Principal Vegetables by Producing Areas Summary of Acreage, Yield, Production, and Value by Crops, 2011 and Fruit and Vegetable Acreage, Production, and Value Snap Beans Cabbage Sweet Corn Cucumbers Bell Peppers Potatoes, Sweet Potatoes Squash Strawberries Tomatoes Watermelons Vegetable Planting and Harvesting Dates Historical Vegetable Highlights HORTICULTURE Horticulture Highlights Floriculture Cut Cultivated Greens Foliage Plants Potted Flowering Plants Annual Bedding / Garden Plants
8 BEES AND HONEY Bees and Honey Highlights Colonies, Yield, Production, Price, Value, and Stock AQUACULTURE AND SEAFOOD Aquaculture and Seafood Highlights Aquaculture Value of Sales, 2012 and Value of Sales by Category and Type Water Acreage and Size of Operation Tropical/Ornamental Landings and Value Summary Seafood Seafood Annual Landings and Value Summary FORESTRY Forestry Highlights Economic Output Employment Value Added Compensation Export Value Fiscal Impacts Forest Ownership Forest Distribution Local Importance Florida Primary Wood Mills Annual Harvest Removals by Species Type Output of Industrial Products by Product and Species Group Conversion Factors Contact Information and References EXPORTS Florida s Seaports Leading Exports Ranked by Year Leading Importers Ranked by Year FLORIDA AGRICULTURE CONTACTS Florida Agriculture Groups Florida Farm Credit Associations Florida Cooperative Extension Service & Extension IFAS / UF Offices Florida Fairs and Expositions Florida Farm Bureau Federation Offices USDA Service Centers Florida Department of Agriculture and Consumer Services Divisions and Offices AGRICULTURE STATISTICS AND OTHER INFORMATION
9 FLORIDA AGRICULTURAL OVERVIEW Florida s 47,500 commercial farms, utilizing 9.25 million acres, continue to produce a wide variety of safe and dependable food products. From the citrus groves and the nurseries in central and southern Florida, to the vegetables in various regions around the State, to the cattle and calves throughout the State, these farms and ranches provide Florida with a large and stable economic base. In 2012 Florida ranked: 1 st in the U.S. in the value of production of oranges and grapefruit. 1 st in value of production of fresh market snap beans, cucumbers for fresh market, cucumbers for pickles, squash, sweet corn, fresh market tomatoes, sugarcane for sugar & seed and watermelons. 2 nd in value of production of bell peppers, strawberries, and tangerines. 3 rd in value of production of honey. In 2012, in terms of total value of production, Florida accounted for: 66 percent of the total U.S. value for oranges ($1.5 billion) 65 percent of the total U.S. value for grapefruit ($187 million) 52 percent of the total U.S. value for snap beans ($167 million) 49 percent of the total U.S. value for sugarcane for sugar and seed ($673 million) 1 33 percent of the total U.S. value for bell peppers ($207 million) 31 percent of the total U.S. value for fresh market tomatoes ($268 million) 27 percent of the total U.S. value for squash ($67 million) 27 percent of the total U.S. value for cucumbers for fresh market ($67 million) 27 percent of the total U.S. value for watermelons ($138 milion) 22 percent of the total U.S. value for sweet corn ($180 million) 16 percent of the total U.S. value for tangerines ($55 million) Florida citrus growers in produced million boxes of oranges (96 percent of which were used for orange juice) and 18.9 million boxes of grapefruit (57 percent of which were used for grapefruit juice). Fruit sales exceeded $1.8 billion. Florida growers harvested vegetables for fresh market from 186,700 acres in The value of vegetable crops exceeded $1.1 billion. Florida ranks second to California in the total value of fresh market vegetable production. Livestock and products in 2011 produced cash receipts of $1.5 billion. Poultry farms generated $363 million in sales, with $179 million coming from broilers and $181 million coming from eggs. On January 1, 2012 there were 1.66 million head of cattle on farms and ranches in Florida, including 900,000 head of beef cows and 123,000 head of milk cows. Florida ranked 14 th in the number of chickens on farms in Florida s poultry farmers maintained an average of 9.0 million layers in 2011 (producing 2.7 billion eggs) and produced 61.8 million broilers. The total cash receipts for nursery and greenhouse products in Florida were $1.8 billion in Data for 2011, the latest year available. 9
10 10
11 FLORIDA CASH RECEIPTS The Economic Research Service (ERS), USDA, reports that receipts from Florida agricultural products in 2011 totaled to $8.26 billion. This is an increase of 5.4 percent from All crops accounted for nearly 82 percent of total cash receipts. As in previous years, the leading crop commodities were oranges (17.85 percent of all cash receipts), greenhouse/nursery (21.68 percent), tomatoes (6.83 percent), and sugarcane (6.16 percent). The leading livestock commodities were cattle and calves (5.90 percent of all cash receipts), dairy products (6.60 percent), and poultry and eggs (4.39 percent). Florida Cash Receipts, 2011: By Commodity Groups and Selected Commodities Commodity Cash receipts ($1,000) 2011 Percent of total 1,2 Total Cash Receipts from Farm Marketings... 8,262, All Crops... 6,764, Citrus... 1,728, Grapefruit , Oranges... 1,475, Tangelos... 12, Tangerines... 62, Other Fruits and Nuts , Avocados... 22, Pecans... 6, Blueberries... 69, Strawberries, Winter , Misc. fruits & nuts... 27, Other berries Vegetables and Melons... 1,925, Cabbage... 64, Cucumbers... 89, Green Peppers , Potatoes, Spring , Sweet Potatoes... 7, Snap Beans, Fresh , Squash... 94, Sweet Corn, Fresh , Tomatoes , Watermelons , Misc. vegetables , Cash receipts ($1,000) Commodity 2011 Percent of total Field Crops , Corn... 14, Cotton... 83, Cotton lint, Upland... 70, Cottonseed... 12, Hay , Peanuts , Soybeans.... 5, Wheat... 2, All Other Crops... 2,355, Cane for Sugar , Other seeds... 4, Other field crops... 23, Greenhouse/Nursery... 1,791, Christmas Trees... 2, Other Greenhouse/Nursery... 1,789, Mushrooms... (NA) (NA) All Livestock and Products... 1,498, Cattle and Calves , Hogs... 3, Dairy Products: Milk , Poultry and Eggs , Broilers , Farm Chickens Chicken Eggs , Other Poultry... 2, Honey... 18, Aquaculture... 53, Other livestock , NA = Not Available 1 Beginning in 2011, sheep and lambs are included in other livestock preliminary. Percents for individual commodities may not add to totals in some groups because of rounding. 11
12 Florida Cash Receipts: By Commodity Group and Year Year Crops Livestock Total cash receipts (1,000 dollars) ,219, ,397 1,687, ,442, ,103 2,047, ,601, ,200 2,145, ,879, ,905 2,503, ,901, ,709 2,574, ,018, ,598 2,761, ,579, ,213 3,428, ,845,812 1,001,876 3,487, ,103, ,525 4,082, ,231,728 1,026,286 4,258, ,326,155 1,020,062 4,346, ,546,915 1,081,535 4,628, ,638,231 1,098,092 4,736, ,762,770 1,030,336 4,793, ,747,156 1,030,336 4,777, ,207,362 1,100,854 5,308, ,688,987 1,146,040 5,835, ,021,374 1,218,705 6,240, ,438,082 1,258,961 5,697, ,972,810 1,171,626 6,144, ,956,706 1,263,874 6,220, ,824,757 1,310,232 6,134, ,815,127 1,296,603 6,111, ,841,471 1,238,378 6,079, ,100,235 1,312,154 6,412, ,238,267 1,385,551 6,623, ,689,172 1,390,238 7,079, ,311,395 1,347,573 6,658, ,470,458 1,315,908 6,786, ,236,151 1,389,601 6,625, ,157,002 1,239,055 6,396, ,374,178 1,240,273 6,614, ,315,049 1,469,412 6,784, ,028,520 1,420,758 7,449, ,994,267 1,321,940 7,316, ,662,821 1,381,508 8,044, ,417,420 1,387,783 7,805, ,034,577 1,105,333 7,139, ,497,036 1,345,010 7,842, ,764,474 1,498,012 8,262,486 12

13 United States Total Cash Receipts: Leading States, 2011 Rank State Cash receipts Percent of United States (1,000 dollars) 1 California... 43,544, Iowa... 29,892, Texas... 22,681, Nebraska... 21,814, Illinois... 19,820, Minnesota... 18,536, Kansas... 15,858, Indiana... 11,836, Wisconsin... 11,740, North Carolina... 10,543, Florida... 8,262, United States ,251,

14 United States Vegetable Cash Receipts: Leading States, 2011 Rank State Cash receipts Percent of United States (1,000 dollars) 1 California... 7,413, Florida... 1,925, Washington... 1,320, Arizona... 1,314, Idaho... 1,077, Georgia , Michigan , New York , Wisconsin , North Carolina , United States... 20,976, United States Crop Cash Receipts: Leading States, 2011 Rank State Cash receipts Percent of United States (1,000 dollars) 1 California... 31,186, Iowa... 17,542, Illinois... 17,220, Nebraska... 11,754, Minnesota... 11,535, Indiana... 8,544, Kansas... 6,944, Texas... 6,863, Florida... 6,764, Ohio... 6,528, United States ,253,

15 Florida Leading Cash Receipts: By Commodity, 2011 Commodity Florida receipts U.S. receipts Florida percent of U.S. (1,000 dollars) (percent) Florida national ranking Greenhouse/Nursery... 1,791,283 15,598, Oranges... 1,475,104 2,109, Tomatoes ,696 2,232, Dairy Products ,383 39,532, Sugarcane ,995 1,155, Cattle/Calves ,618 62,925, Strawberries , , Peppers, Bell , , Eggs ,584 7,316, Broilers ,571 23,172, Grapefruit , , Sweet Corn, Fresh , , Potatoes ,006 3,758, Snap Beans (Fresh Market) , , Peanuts ,242 1,012, Watermelons , , Squash... 94, , Cucumbers (Fresh & Processing)... 89, , Cotton... 83,225 8,339, Blueberries... 69, , Cabbage (Fresh Market)... 64, , Tangerines... 62, , Hay... 28,580 6,656, FLORIDA AGRICULTURE CASH RECEIPTS, 2011 Total= $8,262,486,000 15
16 16
17 FARMS AND LAND IN FARMS Florida had 47,500 commercial farms in 2012, using a total of 9,250,000 acres. There were 5,500 farms with sales exceeding $100,000. The average farm size was 195 acres. Florida ranks 18 th among all states in number of farms and 30 th in land in farms. Florida Farms and Acreage: By Year and by Economic Sales Class Year Total Number of farms $1,000 - $9,999 $10,000 - $99,999 $100,000 & over Total $1,000 - $9,999 Total acres $10,000 - $99,999 $100,000 & over Average farm size (1,000 acres) (acres) ,000 27,600 11,000 5,400 10,300 1,700 2,350 6, ,000 27,600 11,000 5,400 10,040 1,600 2,300 6, ,200 27,000 10,700 5,500 9,830 1,600 2,100 6, ,000 26,000 10,600 5,400 9,570 1,500 2,000 6, ,000 24,700 10,600 5,700 9,460 1,400 2,000 6, ,500 29,500 12,700 5,300 9,300 1,400 2,000 5, ,500 29,500 12,700 5,300 9,250 1,400 1,950 5, ,500 29,500 12,700 5,300 9,250 1,400 1,950 5, ,500 29,500 12,600 5,400 9,250 1,400 1,900 5, ,500 29,600 12,400 5,500 9,250 1,400 1,800 6, ,500 29,600 12,400 5,500 9,250 1,400 1,900 6, Leading States: Number of farms State Number of farms Total acres in farms Average size of farm (1,000 acres) (acres) Texas , , Missouri ,000 29, Iowa... 92,200 30, Oklahoma... 85,500 34, Kentucky... 85,500 14, California... 80,500 25, Minnesota... 79,400 26, Wisconsin... 76,800 15, Tennessee... 76,000 10, Illinois... 74,300 26, United States... 2,170, ,
18 FLORIDA FARM WORKERS Florida Number of All Hired Farm Workers and Hours Worked 1 Hired Date Expected to be employed Number of workers 150 days or more 149 days or less Number of hours worked per week 2013 April 7-13, ,000 37,000 11, January 6-12, ,000 37,000 6, October 7-13, ,000 39,000 8, July 8-14, ,000 35,000 4, April 8-14, ,000 41,000 14, January 8-14, ,000 41,000 9, October 9-15, ,000 34,000 7, July 10-16, ,000 37,000 3, April 10-16, January 9-15, ,000 38,000 7, Excludes Agricultural service workers 2 The April 2011 Farm Labor Survey was not conducted. Florida Wage Rates by Type of Worker 1 Date Field Type of worker Livestock (dollars per hour) Field and livestock combined Wage rates for all hired workers 2013 April 7-13, January 6-12, October 7-13, July 8-14, April 8-14, January 8-14, October 9-15, July 10-16, April 10-16, January 9-15, Excludes Agricultural service workers 2 The April 2011 Farm Labor Survey was not conducted. 18
19 FLORIDA FARM INCOME & EXPENSES Florida Value Added to the U.S. Economy by the Agricultural Sector via the Production of Goods and Services, Item (thousand dollars) Value of crop production... 6,035,881 6,483,554 6,762,557 Value of livestock production... 1,120,582 1,278,803 1,567,384 Revenues from services and forestry , , ,108 Value of agricultural sector production... 7,639,185 8,334,527 8,949,049 less: Purchased inputs... 3,890,444 3,842,261 4,421,100 Farm origin , ,037 1,098,580 Manufactured inputs... 1,234,142 1,048,731 1,232,428 Other purchased inputs... 1,758,769 1,810,493 2,090,092 plus: Net government transactions , , ,278 +Direct Government payments... 76,699 92, ,103 -Motor vehicle registration and licensing fees... 10,554 9,455 10,381 -Property taxes , , ,000 Gross value added... 3,584,886 4,305,809 4,392,671 less: Capital consumption , , ,444 Net value added... 3,126,830 3,873,541 3,903,227 Less: Payments to stakeholders... 1,791,162 1,781,865 1,642,345 Employee compensation (total hired labor)... 1,341,892 1,340,223 1,158,462 Net rent received by Non-operator landlords... 35,955 37,549 87,359 Real estate and Non-real estate interest , , ,524 Net Farm Income... 1,335,668 2,055,676 2,260,882 1 Value of agricultural sector production is the gross value of the commodities and services produced within a year. Net value-added is the sector's contribution to the National economy and is the sum of the income from production earned by all factors-of-production, regardless of ownership. Net farm income is the farm operators' share of income from the sector's production activities. The concept presented is consistent with that employed by the Organization for Economic Cooperation and Development. Leading States in Net Farm Income, 2011 State Net farm income (million dollars) 1. California... 16, Iowa... 10, Nebraska... 7, Illinois... 6, Minnesota... 5, Texas... 5, Kansas... 5, South Dakota... 4, Ohio... 3, Indiana... 3, Wisconsin... 3, Michigan... 3, Missouri... 3, North Carolina... 3, Washington... 2, Georgia... 2, Idaho... 2, Florida... 2,
 Calhoun... (D) 25.00 50.00 (D) (D) (D) Escambia... 18.50 (D) 72.00 76.50 (D) (D) Gadsden... 22.00 (D) 36.00 (D) (D) (D) Holmes... 23.50 25.00 35.50 38.00 (D) (D) Jackson... 25.00 (D) 40.")
20 FLORIDA CASH RENTS Cash Rents: Pasture Land, Cropland-Florida District and county District 10 Pasture land Non-irrigated cropland Irrigated cropland (dollars per acre) Calhoun... (D) (D) (D) (D) Escambia (D) (D) (D) Gadsden (D) (D) (D) (D) Holmes (D) (D) Jackson (D) (D) (D) Jefferson (D) (D) (D) Leon (D) (D) (D) (D) (D) Okaloosa... (D) (D) (D) (D) Santa Rosa (D) (D) (D) Walton (D) (D) (D) (D) (D) Washington... (D) (D) (D) Other, District Total District 30 Columbia (D) (D) (D) (D) Dixie... (D) (D) (D) (D) Hamilton... (D) (D) (D) (D) (D) Lafayette... (D) (D) (D) (D) (D) Suwannee... (D) (D) (D) (D) Other, District (D) Total (D) Footnotes on last page of table. --continued 20
21 Cash Rents: Pasture Land, Cropland-Florida District and county District 50 Pasture land Non-irrigated cropland Irrigated cropland (continued) (dollars per acre) Alachua Flagler... (D) 3.80 (D) (D) (D) (D) Gilchrist (D) Hernando (D) (D) (D) (D) (D) Hillsborough Lake (D) Levy Marion (D) (D) Orange (D) (D) (D) (D) (D) Osceola (D) (D) (D) (D) (D) Pasco (D) (D) (D) (D) Polk (D) (D) Putnam (D) (D) (D) (D) St. Johns... (D) (D) (D) (D) Sumter... (D) (D) (D) (D) Union... (D) (D) (D) (D) (D) Volusia... (D) 7.00 (D) (D) (D) Other, District Total District 80 Brevard... (D) (D) (D) (D) (D) Collier (D) (D) (D) (D) DeSoto (D) (D) (D) (D) Hardee (D) (D) Hendry... (D) (D) (D) (D) (D) Highlands (D) (D) Indian River... (D) (D) (D) (D) (D) Lee (D) (D) (D) (D) Manatee (D) (D) Martin... (D) (D) (D) (D) (D) (D) Miami-Dade... (D) (D) (D) (D) (D) Okeechobee (D) (D) (D) Palm Beach... (D) (D) (D) (D) Sarasota (D) (D) (D) (D) St. Lucie (D) (D) (D) Other, District (D) Total (D) State Total D - Withheld to avoid disclosing data of individual operations. 21
22 22
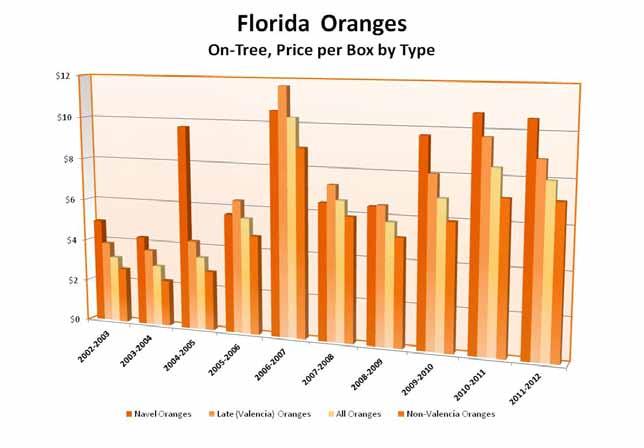
23 U.S. and Florida Production SEASON CITRUS HIGHLIGHTS U.S. citrus utilized production for the season totaled 11.7 million tons, down slightly from the season. Florida accounted for 65 percent of the total United States citrus production, while California totaled 32 percent, and Texas and Arizona combined produced the remaining 3 percent. Total utilized citrus production was down from the previous year in all citrus reporting states except Florida. Florida s share of U.S. citrus production was million boxes in the season, up 3 percent from the previous season s million boxes. Production of oranges increased while production of grapefruit and tangerines decreased. Tangelo production remained unchanged from the season. Florida s all orange production increased by 4 percent to million boxes. Navel production is 2.65 million boxes, unchanged from the season. All grapefruit production is down 5 percent to 18.9 million boxes. Production of Honey tangerines is down 4 percent and early tangerine production is down 10 percent, resulting in an 8 percent decrease in all tangerines. Production by Area and County Each production area showed an increase in citrus production compared to except the Indian River District which produced 1.3 million boxes less than the season. The top 5 citrus producing counties were Polk (31.2 million boxes) Highlands (23.7 million), Hendry (19.9 million), DeSoto (18.6 million), and Hardee (13.8 million). Polk County had the largest actual increase in production while Indian River County s production decreased the most. By percentage, Pasco County had the greatest increase and Martin County lost the most. Estimates of county production are prepared from objective survey data used in forecasting citrus crop production. The apportionment of final harvest to the counties is based on bearing trees, an estimate of the average fruit per tree, and the drop and size surveys. Sample size used in these surveys and the distribution of the sample groves around the State are chosen to minimize error in the estimates of production and are not to be considered as accurate for the counties as at the State or area levels. Value The value of the United States citrus crop was up 6 percent from last season, at $3.44 billion (packinghousedoor equivalent). Orange value of production increased 5 percent from last season while grapefruit value is up 1 percent. Tangerine and mandarin value of production is 6 percent higher than last season and lemon value of production is up 16 percent. Tangelo value increased 44 percent from the previous season. Florida s $1.35 billion preliminary on-tree value of the citrus crop is 1 percent less than the revised value of $1.37 billion for The price per box is higher for grapefruit and tangelos but lower for all other citrus. The tangelo on-tree value increased nearly 73 percent from last season. Non-Valencia oranges and all grapefruit also had increases in the value of production of 5 percent and 2 percent respectively. Citrus: Florida Value of Sales On-Tree: Crop Years through Crop year Value 1 Crop year Value 1 (1,000 dollars) (1,000 dollars) , ,283, , ,046, , ,131, ,024, ,368, ,499, ,351,846 1 Excludes lemons beginning in Revised. 3 Preliminary. 23
24 Foreign Exports Fresh fruit exports totaled 9.8 million 4/5 bushel cartons. Japan accounted for the majority of Florida grapefruit exports. Canada received most of Florida s orange and specialty fresh fruit exports. A total of 15.3 million gallons of Frozen Concentrated Orange Juice (FCOJ), and 3.9 million gallons of Frozen Concentrated Grapefruit Juice (FCGJ) were exported in the season. Frozen Concentrate Final Frozen Concentrated Orange Juice (FCOJ) yield, as reported by the Florida Department of Citrus, was gallons per box of 42 Brix concentrate. A record FCOJ yield of was set in the season. The early-midseason portion of the crop finalized at gallons per box. The late crop yielded gallons per box. The final Frozen Concentrated Grapefruit Juice (FCGJ) yield was gallons per box of 40 Brix concentrate, down slightly from last season s final of gallons per box. The final Frozen Concentrated Tangerine Juice (FCTJ) yield of gallons per box of 42 Brix concentrate was higher than last season s final of gallons per box Citrus Box Weights: Approximate net weight by fruit type and states State Orange Grapefruit Tangerine Lemon Lime FL... (pounds) CA (X) TX (X) (X) (X) AZ... (X) 5 (X) 2 80 X Not applicable. 1 Includes Temples and tangelos at 90 pounds. 2 Was 75 pounds prior to the season. 3 Was 67 pounds from to and 65 pounds prior to the season. 4 Was 76 pounds prior to the season. 5 Was 67 pounds from to and 64 pounds prior to the season (X) Florida Citrus, Priced Average Delivered-in Processed Fruit: Crop Year Variety Price per box Price per pound of solids (dollars) All oranges Early-midseason Valencia All grapefruit White Colored SOURCE: Florida Department of Citrus 24
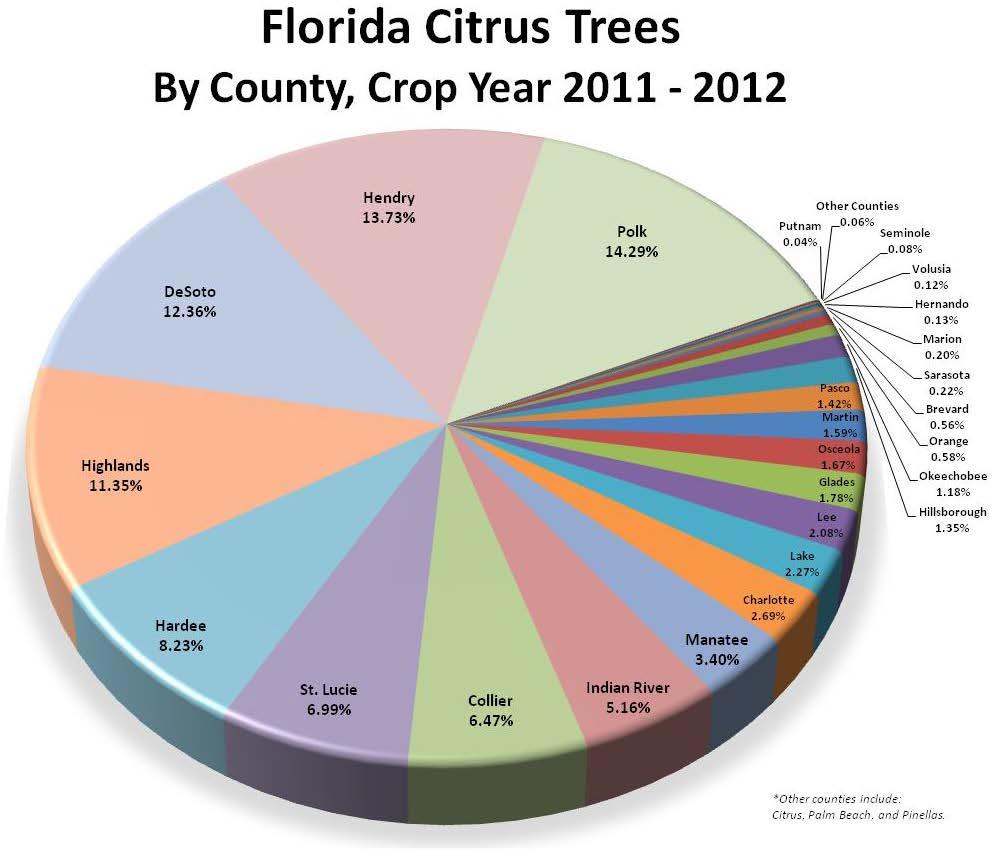
25 Tree Inventory Results of the annual commercial citrus inventory show total citrus acreage is 531,493, down 2 percent from the last survey and the lowest in a series which began in Compared to the previous inventory, the net decrease of 9,835 acres is less, with a lower gross loss (19,383), and slightly more new plantings (9,548). Of the 29 counties included in the survey, 24 recorded decreases in acreage, and 5 showed increases. Martin County, down 2,863 acres, has suffered the greatest loss for four straight years and has been declining since DeSoto County has recorded gains in the last 5 surveys and this year s gain of 1,011 acres is the most of any county. Polk remains the leader in acreage with 82,572 and in trees with 9.9 million. Orange acreage declined for the eighth consecutive survey to 464,918, replacing the previous record low of 466,252 tallied in the 1986 inventory. Grapefruit acreage fell to a new low of 48,191, representing only 54 percent of the prehurricanes figure. Specialty acreage continued to decline to a record low of 18,384 and represents only 3.5 percent of the total citrus acreage. Total citrus trees have declined steadily from the peak in 1998 to 69,565,400. Polk is the leader with over 9.9 million trees, followed by Hendry with 9.6 million, DeSoto with 8.6 million, and Highlands with 7.9 million trees. The total is composed of oranges, over 89 percent; grapefruit, almost 8 percent; and the remainder, including specialty and other citrus, at 4 percent. Since 2011, bearing trees decreased nearly 1.5 percent to 64,982,000 while non-bearing trees decreased by 3 percent to 4,583,
26 Florida Citrus Harvesting Season Navel Orange Ambersweet Hamlin Orange Pineapple Orange Temple Valencia Orange White Seedless Grapefruit Colored Seedless Grapefruit Seedy Grapefruit K-Early Citrus Nova Tangelo Orlando Tangelo Minneola Tangelo Robinson Tangerine Fallglo Tangerine Sunburst Tangerine Dancy Tangerine Honey Tangerine Lemon Avocado Lemon Avocado Sep Oct Nov Dec Jan Feb Mar Apr May Jun Jul Aug 26
27 Citrus Production by County Production (1,000 Boxes) Polk 31,229 Highlands 23,692 Hendry 19,924 DeSoto 18,579 Hardee 13,760 St. Lucie 9,378 Indian River 9,369 Collier 9,352 Manatee 6,398 Lake 4,174 Osceola 3,451 Charlotte 3,393 Lee 3,042 Pasco 2,915 Glades 2,720 Hillsborough 2,541 Martin 1,853 Okeechobee 1,769 Orange 1,227 Brevard 637 Marion 381 Sarasota 344 Hernando 249 Volusia 210 Seminole 128 Other counties Total 170,890 1 Citrus, Palm Beach, Pinellas, and Putnam counties. 27
28 Florida Citrus: Production by County, Area, and Type, Crop Year County and area Non- Valencia 1 Oranges Late (Valencia) Grapefruit All White Colored All (1,000 boxes) Specialty fruit 2 All citrus Brevard Charlotte... 1,023 1,752 2, ,393 Collier... 4,212 4,582 8, ,352 DeSoto... 7,730 10,642 18, ,579 Glades... 1,568 1,042 2, ,720 Hardee... 9,193 4,298 13, ,760 Hendry... 7,961 10,816 18, ,924 Hernando Highlands... 8,796 13,605 22, ,692 Hillsborough... 1, , ,541 Indian River... 1,528 1,007 2,535 2,724 3,962 6, ,369 Lake... 2, , ,174 Lee... 1,117 1,530 2, ,042 Manatee... 3,630 2,664 6, ,398 Marion Martin ,215 1, ,853 Okeechobee , ,769 Orange , ,227 Osceola... 1,936 1,031 2, ,451 Pasco... 2, , ,915 Polk... 14,822 12,936 27, ,220 1,681 1,790 31,229 St. Lucie... 1,080 1,874 2,954 1,212 5,033 6, ,378 Sarasota Seminole Volusia Other counties Total... 74,200 72, ,600 5,350 13,500 18,850 5, ,890 Indian River... 2,500 3,100 5,600 4,000 9,100 13, ,048 Northern... 6,109 1,744 7, ,341 Central... 25,291 27,456 52, ,885 2,796 2,402 57,945 Western... 22,400 18,400 40, ,627 Southern... 17,900 21,700 39, ,700 2,000 1,329 42,929 Total... 74,200 72, ,600 5,350 13,500 18,850 5, ,890 - Represents zero. 1 Includes early, midseason, Navel, and Temple varieties. 2 Tangelos and tangerines. 3 Citrus, Palm Beach, Pinellas, and Putnam counties. 28

29 Commercial Citrus Acreage by County 2012 Commercial Acres Polk 82,572 DeSoto 64,258 Hendry 63,792 Highlands 61,525 Hardee 46,792 St. Lucie 37,424 Indian River 32,820 Collier 30,780 Manatee 18,300 Charlotte 13,071 Lake 11,060 Lee 10,589 Osceola 9,502 Glades 8,149 Hillsborough 8,023 Martin 7,183 Pasco 7,040 Okeechobee 6,850 Orange 3,373 Brevard 3,330 Sarasota 1,336 Marion 1,151 Volusia 815 Hernando 800 Seminole 428 Putnam 193 Other counties Total 531,493 1 Citrus, Palm Beach, and Pinellas counties. 29
30 Florida Citrus: Acreage, by Variety and County, Crop Year County Non-Valencia 1 Oranges Late (Valencia) All 2 White Seedless (acres) Colored Grapefruit Seedy All 2 Specialty fruit 3 All citrus Brevard... 1,259 1,579 2, ,330 Charlotte... 3,718 7,645 11, , ,071 Collier... 11,596 17,502 29, ,780 DeSoto... 24,988 37,577 63, ,258 Glades... 4,360 3,498 7, ,149 Hardee... 29,139 15,835 45, ,792 Hendry... 22,057 38,498 60, ,432-1,782 1,385 63,792 Hernando Highlands... 19,349 39,156 59, ,004 1,435 61,525 Hillsborough... 4,933 2,061 7, ,023 Indian River... 6,924 6,871 14,000 7,040 10,615-17, ,820 Lake... 5,547 2,418 8, ,159 11,060 Lee... 3,626 5,936 9, ,589 Manatee... 9,691 7,993 17, ,300 Marion ,151 Martin... 1,275 5,435 6, ,183 Okeechobee... 2,702 2,965 5, ,850 Orange... 1,725 1,322 3, ,373 Osceola... 4,855 3,421 8, ,502 Pasco... 4,962 1,376 6, ,040 Polk... 34,138 38,399 74, , ,725 4,984 82,572 Putnam St. Lucie... 5,431 13,190 18,690 3,354 14,083-17,539 1,195 37,424 Sarasota ,336 Seminole Volusia Other Counties Total , , ,918 13,099 34, ,191 18, ,493 - Represents zero. 1 Includes early, midseason, Navel, and Temple varieties. 2 Includes unidentified variety acreage. 3 Tangelos, tangerines, lemons, and other citrus. 4 Citrus, Palm Beach, and Pinellas counties. 30
31 Commercial Citrus Trees by County 2012 Commercial Trees (1,000 trees) Polk 9,938.8 Hendry 9,553.4 DeSoto 8,595.2 Highlands 7,898.3 Hardee 5,726.8 St. Lucie 4,865.6 Collier 4,503.3 Indian River 3,592.3 Manatee 2,368.0 Charlotte 1,869.7 Lake 1,577.4 Lee 1,444.6 Glades 1,240.9 Osceola 1,164.0 Martin 1,102.7 Pasco Hillsborough Okeechobee Orange Brevard Sarasota Marion Hernando 88.1 Volusia 85.8 Seminole 52.5 Putnam 29.6 Other counties Total 69, Citrus, Palm Beach, and Pinellas counties. 31
32 Florida Citrus: Trees, by Variety and County, Crop Year County Non-Valencia 1 Oranges Late (Valencia) All 2 Grapefruit Seedless White Colored Seedy All 2 Specialty fruit 3 All citrus (1,000 trees) Brevard Charlotte , , ,869.7 Collier... 1, , , ,503.3 DeSoto... 3, , , ,595.2 Glades , ,240.9 Hardee... 3, , , ,726.8 Hendry... 3, , , ,553.4 Hernando Highlands... 2, , , ,898.3 Hillsborough Indian River , , , ,592.3 Lake , ,577.4 Lee , ,444.6 Manatee... 1, , , ,368.0 Marion Martin , ,102.7 Okeechobee Orange Osceola , ,164.0 Pasco Polk... 4, , , ,938.8 Putnam St. Lucie , , , , ,865.6 Sarasota Seminole Volusia Other Counties Total... 26, , , , , , , , Represents zero. 1 Includes early, midseason, Navel, and Temple varieties. 2 Includes unidentified variety tree numbers. 3 Tangelos, tangerines, lemons, and other citrus. 4 Citrus, Palm Beach, and Pinellas. 32
33 33
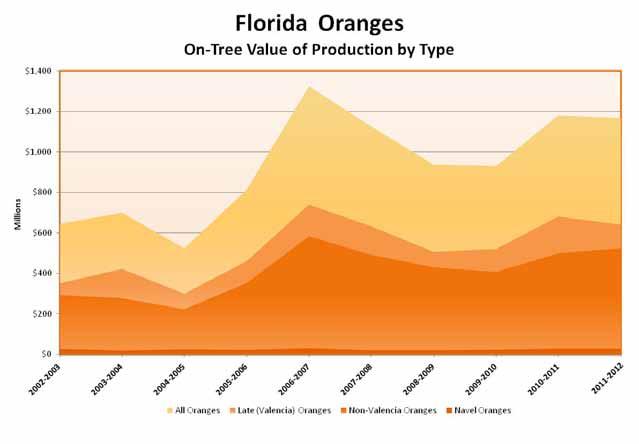
34 Florida Citrus: Oranges Trees, Acreage, Yield, Production, Price, and Value, by Variety, Crop Years through Crop year Bearing trees Bearing acreage Yield per acre Utilization of production Total Fresh Processed Price per box On-tree Value of production Non-Valencia Oranges 1 2 (1,000 trees) (1,000 acres) (boxes) (1,000 boxes) (dollars) (1,000 dollars) , ,000 6, , , , ,000 5, , , , ,100 4,403 74, , , ,000 4,896 70, , , ,600 4,162 61, , , ,500 3,885 79, , , ,600 4,342 80, , , ,600 3,827 64, , , ,300 4,122 66, , , ,200 3,998 70, ,773 Navel Oranges , ,400 3,882 1, , , ,300 3,112 1, , , ,500 2, , , ,800 2, , , ,850 2, , , ,000 2, , , ,000 2, , , ,300 1, , , ,650 2, , , ,650 2, ,936 Late (Valencia) Oranges , ,000 2,940 88, , , ,000 4, , , , ,700 2,994 67, , , ,700 2,418 70, , , ,400 2,234 61, , , ,700 1,968 84, , , ,900 2,585 75, , , ,100 2,033 63, , , ,200 1,837 68, , , ,400 2,134 70, ,068 All Oranges , ,000 9, , , , ,000 9, , , , ,800 7, , , , ,700 7, , , , ,000 6, , ,325, , ,200 5, , ,125, , ,500 6, , , , ,700 5, , , , ,500 5, , ,181, , ,600 6, , ,166,841 1 Early, midseason, and Navel varieties. 2 Includes Temples beginning in preliminary. 34
35 35
36 Florida Citrus: Grapefruit Trees, Acreage, Yield, Production, Price, and Value, by Variety, Crop Years through Crop year Bearing trees Bearing acreage Yield per acre Utilization of production Total Fresh Processed Price per box On-tree Value of production (1,000 trees) (1,000 acres) (boxes) (1,000 boxes) (dollars) (1,000 dollars) White Grapefruit , ,200 3,172 13, , , ,900 3,273 12, , , ,400 1,352 2, , , ,500 1,433 5, , , ,300 1,961 7, , , ,000 1,893 7, , , ,600 1,392 5, , , ,000 1,526 4, , , ,850 1,378 4, , , ,350 1,147 4, ,365 Colored Grapefruit , ,500 12,417 10, , , ,000 13,384 11, , , ,400 6,067 3, , , ,800 5,481 7, , , ,900 8,998 8, , , ,600 8,730 8, , , ,100 7,947 7, , , ,300 7,831 6, , , ,900 7,005 6, , , ,500 6,784 6, ,985 All Grapefruit , ,700 15,589 23, , , ,900 16,657 24, , , ,800 7,419 5, , , ,300 6,914 12, , , ,200 10,959 16, , , ,600 10,623 15, , , ,700 9,339 12, , , ,300 9,357 10, , , ,750 8,383 11, , , ,850 7,931 10, ,350 1 Includes seedy grapefruit preliminary. 36
37 Florida Citrus: Tangerines Trees, Acreage, Yield, Production, Price, and Value, by Variety, Crop Years through Crop year Bearing trees Bearing acreage Yield per acre Utilization of production Total Fresh Processed Price per box On-tree Value of production (1,000 trees) (1,000 acres) (boxes) (1,000 boxes) (dollars) (1,000 dollars) Early Tangerines , ,000 2, , , ,600 2,307 1, , , ,450 1, , , ,850 1, , , ,400 1, , , ,600 1, , , ,550 1, , , ,250 1, , ,600 1, , ,330 1, ,448 Honey Tangerines , ,500 1, , , ,900 2, , , ,000 1, , , ,650 1, , , ,200 1, , , ,900 1,521 1, , , , , ,200 1, , ,050 1, , ,960 1, ,888 All Tangerines , ,500 3,914 1, , , ,500 4,440 2, , , ,450 3,318 1, , , ,500 3,608 1, , , ,600 3,072 1, , , ,500 3,282 2, , , ,850 2,837 1, , , ,450 3,011 1, , , ,650 3,007 1, , , ,290 2,838 1, ,554 1 Includes Fallglo and Sunburst varieties preliminary. 37
38 Florida Citrus: Trees, Acreage, Yield, Production, Price, and Value, by Variety, Crop Years through Crop year Bearing trees Bearing acreage Yield per acre Utilization of production Total Fresh Processed Price per box On-tree Value of production (1,000 trees) (1,000 acres) (boxes) (1,000 boxes) (dollars) (1,000 dollars) Tangelos , , , , , , , , , , , , , , , , , , , , , , , ,101 Temples , , , , , , , (NA) (NA) (NA) (NA) (NA) (NA) (NA) (NA) (NA) (NA) (NA) (NA) (NA) (NA) (NA) (NA) (NA) (NA) (NA) (NA) (NA) (NA) (NA) (NA) (NA) (NA) (NA) (NA) (NA) (NA) (NA) (NA) (NA) (NA) (NA) (NA) (NA) (NA) (NA) (NA) (NA) (NA) (NA) (NA) (NA) (NA) (NA) (NA) Lemons (NA) (NA) (NA) (NA) (NA) (NA) (NA) (NA) (NA) (NA) (NA) (NA) (NA) (NA) (NA) (NA) (NA) (NA) (NA) (NA) (NA) (NA) (NA) (NA) (NA) (NA) (NA) (NA) (NA) (NA) (NA) (NA) (NA) (NA) (NA) (NA) (NA) (NA) (NA) (NA) (NA) (NA) (NA) (NA) (NA) (NA) (NA) (NA) (NA) (NA) (NA) (NA) (NA) (NA) (NA) (NA) (NA) (NA) (NA) (NA) (NA) (NA) (NA) (NA) (NA) (NA) (NA) (NA) (NA) (NA) (NA) (NA) (NA) (NA) NA Not available preliminary. 2 Included in non-valencia oranges beginning in Estimates discontinued. 38

39 Avocados in Florida Production of Florida avocados increased from the previous season by 344,000 bushels, or 38 percent. Bearing acreage is estimated at 7,400 acres. The price per bushel is $18.90, down 6 percent from the previous season. Total value of crop production is $23,512,000. In Florida, most early season varieties of avocados are West Indian types, whereas midseason and late varieties are mostly Guatemalan-West Indian hybrids or Guatemalan types. Commercial production is primarily in Miami-Dade and Collier counties. Florida avocados have a lower fat content than those from other states and countries, are typically larger than avocados from California, and are available from June through the end of February. Florida Avocado: Trees, Acreage, Yield, Production, Utilization, Price, and Value, Crop Years through Crop year Bearing acreage Yield per acre Production Price per bushel 1 Value of production (1,000 acres) (bushels) (1,000 bushels) (dollars) (1,000 dollars) Avocados , , , , , , , , , , , , , , ,512 1 One bushel equals 50 pounds. Hurricane Wilma affected production. 39
40 40
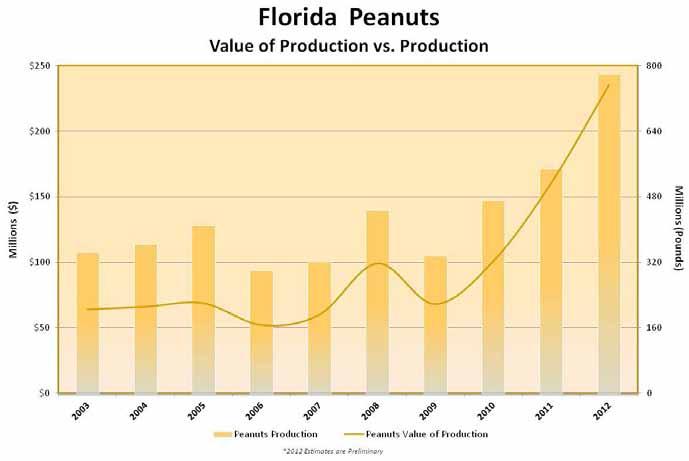
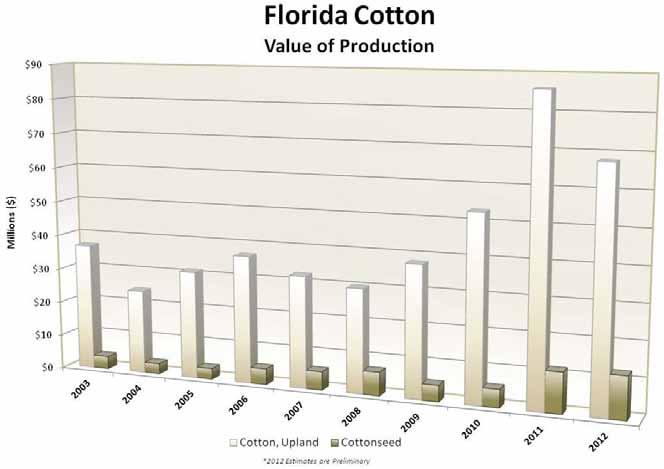
41 2012 FIELD CROPS HIGHLIGHTS Value The 2012 total value of production for corn, cotton, cottonseed, hay, peanuts, pecans, soybeans, and wheat totaled $491 million, an increase of 24% from the previous year s total of $396 million. The total value of peanut production increased 47 percent and was valued at $236 million. The value of production of cotton ($67.9 million) decreased 21 percent, while the value of production for cottonseed ($12.2 million) increased 5 percent. Acreage and Production Acreage harvested in 2012 for corn, cotton, hay, peanuts, soybeans, and wheat totaled 702 thousand acres, up 19 percent from the 592 thousand acres harvested in Harvested acres for corn (40,000), hay (320,000), peanuts (200,000), soybeans (20,000), and wheat (15,000) increased; whereas, acreage for cotton (107,000) decreased. Production increased for corn (36%), cotton (9%), hay (18%), peanuts (42%), soybeans (81%), and wheat (71%). Sugarcane Florida producers harvested 410 thousand acres of sugarcane for sugar and seed in 2012, up 3 percent from the previous year. Production in 2012 was up 4 percent totaling 15,578 thousand tons. The value of production for the 2011 crop was $673 million, up 37 percent from the previous year. Crop Weather In January 2012, moderate to severe drought conditions persisted throughout the State. Low temperatures across Florida dipped below freezing early in the month and again mid-month. Enjoyable daytime temperatures were in the 70s and 80s for most of the month. Sugarcane harvest was well underway. In February, drought conditions worsened for most of the State, with significant portions of the Panhandle reporting extreme drought conditions. At the beginning of the month, lows ranged between the mid-20s to the 60s and highs were in the 70s and 80s. At month s end, low temperatures were mostly in the mid-40s and highs reached the mid-to-high 80s. Harvesting of sugarcane continued throughout the month. In March, producers welcomed rainfall across the Panhandle and northern Florida early in the month. Additional rainfall was recorded throughout the State, but at month s end, extreme drought conditions were prevalent in a band stretching from Jacksonville southwest through Gainesville and onto the Gulf Coast. The drought was also present in Sarasota and Manatee counties. Highs were in the 80s, lows ranged between the 40s and 60s. Producers began planting corn, peanuts, and potatoes. In April, hot, dry conditions and minimal rainfall at the beginning of the month worsened the drought conditions across the State. Widespread rainfall during the middle of the month was reported. Low temperatures were in the 40s and the low 50s, with highs in the 80s. Corn planting was completed during the month, while peanut planting was 21 percent complete at the end of the month. In May, scattered showers across the State did little to alleviate the drought conditions for most of the month. Tropical Storm Beryl at the end of the month brought substantial rainfall to the State and greatly improved the moisture deficit. Highs were in the lower 90s while lows were in the upper 60s. Winter wheat was harvested and peanut planting was 91 percent complete at the end of the month. In June, beneficial rains dramatically improved the drought conditions. Tropical Storm Debby brought widespread downpours and most stations recorded significant rainfall. At month s end only a portion of the Panhandle and Southwest Florida was categorized as abnormally dry. Daytime highs were mostly in the upper 80s and low 90s. Evening lows were in the 60s and 70s. Peanut planting was completed early in the month and was 45 percent pegged at month s end. Hay was harvested when weather permitted. 41

42 In July, drought conditions remained mostly unchanged, with a portion of the Panhandle and Southwest Florida categorized as being abnormally dry or in a moderate drought. Intermittent rain and hot temperatures prevailed. At the end of the month, corn harvest was underway. Hay harvest continued as well. In August, ample rainfall across the State eliminated all drought conditions. Low temperatures were in the mid 60s, while the highs were in the upper 90s. At the end of the month, peanut harvest was just underway. Corn harvest was almost complete. In September, areas of south Florida picked up five inches of rain from Tropical Storm Isaac as it passed just south of Key West early in the month. Rainfall from Tropical Storm Isaac helped refill Lake Okeechobee to rise three-quarters of a foot in two days. Florida had no abnormally dry areas according to the U.S. Drought Monitor throughout the month. Minimum temperatures ranged from the 50s to the 70s, while the maximum temperatures were in the upper 80s to the 90s. Peanut harvest was well underway, some growers reported superior yields. Sugarcane planting began in south Florida. In October, Florida had no abnormally dry areas according to the U.S. Drought Monitor throughout the month. Scattered rainfall aided producers as they worked to harvest their fall crops. Low temperatures ranged from the 50s to the 70s, while high temperatures were in the 80s to low 90s. Peanut harvest was nearing completion at the end of the month, while cotton harvest continued. In November, rainfall was light and scattered across the State. Cooler weather and dry conditions were the norm. Portions of the Panhandle were abnormally dry at month s end. Some freezing temperatures were reported in Northern Florida late in the month. The cotton harvest was nearing completion. In December, the State was abnormally dry in the Panhandle and in South Florida. Field crop harvesting was complete in the Panhandle, while sugarcane harvest continued in South Florida. Precipitation Monitor 2012 September - December, Florida Sept , 2012 Oct , 2012 Nov , 2012 Dec , 2012 Precipitation in inches: Source: Southeast Regional Climate Center 42
43 Florida Field Crops: Acreage, Yield, Production, and Value, Crop Years 2003 through 2012 Corn 1 Crop and year Planted Area Harvested Yield Production Season average price Value of production (1,000 acres) (bushels) (1,000 bushels) (dollars) (1,000 dollars) , , , , , , , , , , , , , , , , , , , ,392 (pounds) (1,000 bales) Cotton, Upland , , , , , , , , , ,872 (1,000 tons) Cottonseed (X) (X) (X) , (X) (X) (X) , (X) (X) (X) , (X) (X) (X) , (X) (X) (X) , (X) (X) (X) , (X) (X) (X) , (X) (X) (X) , (X) (X) (X) , (X) (X) (X) ,180 X Not applicable All 2012 estimates are preliminary. 1 Planted for all purposes; harvested for grain. 2 Production in 480-pound net weight bales. 3 Baled hay. 4 Planted for all purposes; harvested for dry nuts or beans. 5 Estimates of season average price and value of production for the 2012 crop will be available February continued 43
44 Florida Field Crops: Acreage, Yield, Production, and Value, Crop Years 2003 through 2012 Hay, All 3 Crop and year Planted Area Harvested Yield Production Season average price (continued) Value of production (1,000 acres) (tons) (1,000 tons) (dollars) (1,000 dollars) (X) , (X) , (X) , (X) , (X) , (X) , (X) , (X) , (X) , (X) ,912 (pounds) (1,000 pounds) Peanuts , , , , , , , , , , , , , , , , , , , , , , , , , , , , , ,560 (bushels) (1,000 bushels) Soybeans , , , , , , , , , , ,920 X Not applicable All 2012 estimates are preliminary. 1 Planted for all purposes; harvested for grain. 2 Production in 480-pound net weight bales. 3 Baled hay. 4 Planted for all purposes; harvested for dry nuts or beans. 5 Estimates of season average price and value of production for the 2012 crop will be available February continued 44
45 Florida Field Crops: Acreage, Yield, Production, and Value, Crop Years 2003 through 2012 Crop and year Sugarcane For Sugar and Seed Planted Area Harvested Yield Production Season average price (continued) Value of production (1,000 acres) (tons) (1,000 tons) (dollars) (1,000 dollars) (X) , , (X) , , (X) , , (X) , , (X) , , (X) , , (X) , , (X) , , (X) ,930 (NA) 673, (X) ,578 Sugarcane For Sugar (1) (1) (X) , , (X) , , (X) , , (X) , , (X) , , (X) , , (X) , , (X) , , (X) , , (X) ,494 (NA) (NA) Wheat, Winter (bushels) (1,000 bushels) , , , , , , , , , ,875 NA Not available. X Not applicable. 1 Planted for all purposes; harvested for grain. 2 Production in 480-pound net weight bales. 3 Baled hay. 4 Planted for all purposes; harvested for dry nuts or beans. 5 Estimates of season average price and value of production for the 2012 crop will be available February
 (dollars) 2003... 500 1,600 2,100 1.000.600.695 2004... 400 100 500 1.500.950 1.390 2005... 300 700 1,000 1.400.850 1.020 2006... 200 300 500 1.800 1.")
46 Florida Pecans: Production, Price, and Value by Variety, Crop Years 2003 through 2012 Year Improved varieties 1 Utilized production Native and seedling All pecans Improved varieties Price per pound Native and seedling All pecans (1,000 pounds) (dollars) ,600 2, , , , , , ,500 1,600 3, , , ,400 2,600 4, , , Budded, grafted, or top worked varieties. Florida Pecans: Value of Utilized Production by Variety, Crop Years 2003 through 2012 Year Improved varieties 1 Native and seedling All pecans (1,000 dollars) , , , , , , ,800 1,760 3, , , ,590 3,640 6, , ,885 1 Budded, grafted, or topworked varieties. 46
47 Florida Peanuts: Acreage, Yield and Production, by District and County, 2011 and 2012 District and county Planted for all purposes Harvested for dry peanuts Yield per acre Production (acres) (pounds) (1,000 pounds) District 10 Calhoun... 3,900 4,700 3,600 4,400 3,500 2,909 12,600 12,800 Escambia... 6,600 8,400 6,100 8,100 4,180 4,383 25,500 35,500 Holmes... 7,100 8,400 6,400 7,800 2,891 3,577 18,500 27,900 Jackson... 32,300 36,300 29,500 34,900 3,356 3,725 99, ,000 Okaloosa... 2,000 3,400 1,800 3,200 3,333 4,625 6,000 14,800 Santa Rosa... 16,000 25,300 14,900 24,200 3,893 4,479 58, ,400 Walton... 5,500 4,400 5,100 4,200 3,333 4,000 17,000 16,800 Washington... 4,400 4,300 4,100 4,100 3,902 4,244 16,000 17,400 Other, District ,500 5,300 3,200 5,100 2,938 3,216 9,400 16,400 Total... 81, ,500 74,700 96,000 3,507 3, , ,000 District 30 Columbia... 6,500 8,500 5,900 8,100 3,254 2,901 19,200 23,500 Hamilton... 6,700 (1) 6,200 (1) 3,952 (1) 24,500 (1) Madison... (1) 10,400 (1) 9,900 (1) 3,838 (1) 38,000 Suwannee... 14,100 17,000 13,000 16,200 3,846 4,136 50,000 67,000 Other, District ,500 14,900 12,600 13,800 3,913 4,094 49,300 56,500 Total... 40,800 50,800 37,700 48,000 3,793 3, , ,000 Other, State... 47,900 58,700 44,600 56,000 3,240 3, , ,000 State Total , , , ,000 3,500 3, , ,000 1 Included in Other, District
48 Florida Cotton: Acreage, Yield and Production, by District and County, 2011 and 2012 District and county Planted Harvested Yield per acre Production (acres) (pounds) (bales) District 10 Calhoun... 9,600 9,100 9,500 9, ,500 16,300 Escambia... 11,800 9,700 11,600 9, ,099 21,400 22,200 Holmes... 5,200 5,800 4,650 5, ,400 10,700 Jackson... 45,700 45,200 43,300 44, ,000 79,900 Santa Rosa... 24,700 16,000 24,600 15, ,100 31,900 Walton... 5,200 5,700 5,000 5, ,800 11,200 Washington... 3,700 5,200 3,650 5, ,400 9,200 Other, District ,100 5,300 7,900 5, ,400 9,800 Total , , , , , ,200 Other State... 8,000 6,000 7,800 6, ,000 8,800 State Total , , , , , ,000 Florida Sugarcane for Sugar: Acreage, Yield and Production, by County, 2010 and 2011 County Harvested Yield per acre Production (acres) (acres) (tons) (tons) (tons) (tons) Glades... 22,000 24, , ,000 Hendry... 49,000 52, ,380,000 1,950,000 Martin... 8,000 5, , ,000 Palm Beach , , ,860,000 11,250,000 Other, State ,000 State Total , , ,230,000 14,364, County estimates have not been revised at publication date. 48
49 49
50 Planting and Harvesting Seasons of Selected Florida Field Crops Crop (Principal producing areas - Agricultural Statistics Districts or Counties) Usual Planting Dates Usual Harvesting Dates Begin Most Active End Mar Apr May Jun Jul Aug Sep Oct Nov Dec Jan Feb Corn for grain (10, 30, 50) Corn for silage (10, 30, 50) Corn for forage (10, 30, 50) Cotton (10, 30) Peanuts for nuts (10, 30, 50) Potatoes (30, 50, 80) Soybeans (10, 30) Sugarcane (3 counties*) Tobacco (10, 30, 50) Winter Wheat (10, 30) Hay (Statewide) * Palm Beach, Hendry, and Glades Mar Apr May Jun Jul Aug Sep Oct Nov Dec Jan Feb 50

51 51 Bay Washington Jackson Holmes Walton Okaloosa Santa Rosa Franklin Gulf Liberty Calhoun Bay Leon Gadsden Wakulla Escambia Jefferson 10 Suwannee Hamilton Columbia Suwannee Hamilton Taylor Madison Duval Nassau Baker Lafayette Dixie 30 Union Gilchrist Marion Lake Pasco Hernando Hillsborough St. Johns Clay Union Bradford Alachua Gilchrist Putnam Marion Levy Seminole Sumter Lake Citrus Volusia Flagler Pasco Hernando Orange Hillsborough Pinellas 50 Osceola Polk Highlands Manatee Indian River Palm Beach Martin Glades Lee Charlotte Sarasota DeSoto St. Lucie Okeechobee Hardee Monroe Collier Dade Broward Hendry Highlands 80 Brevard Florida Agricultural Statistics Districts Source: USDA
52 52
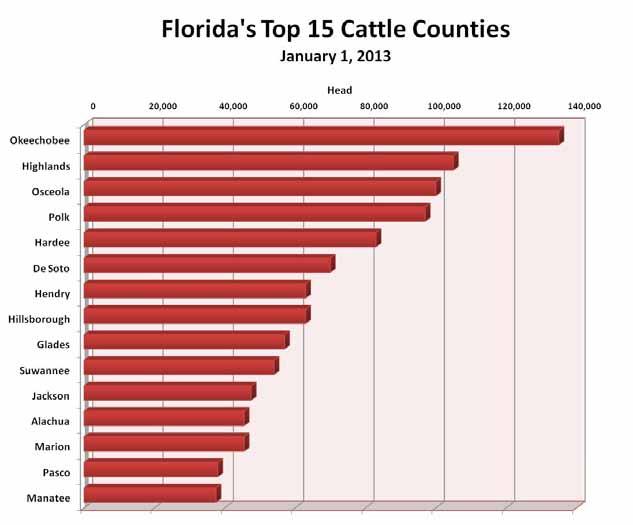
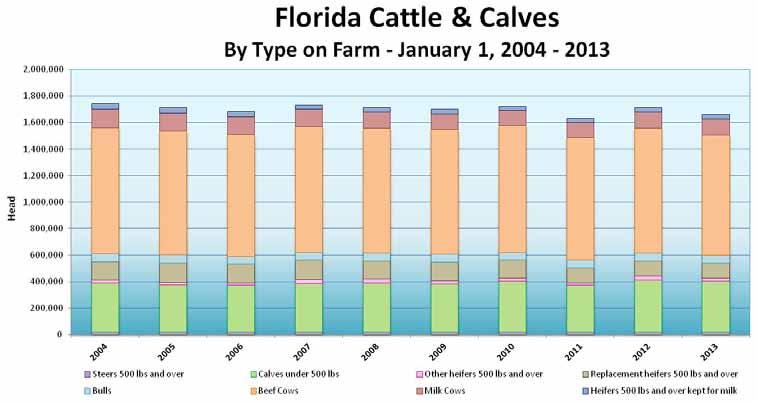
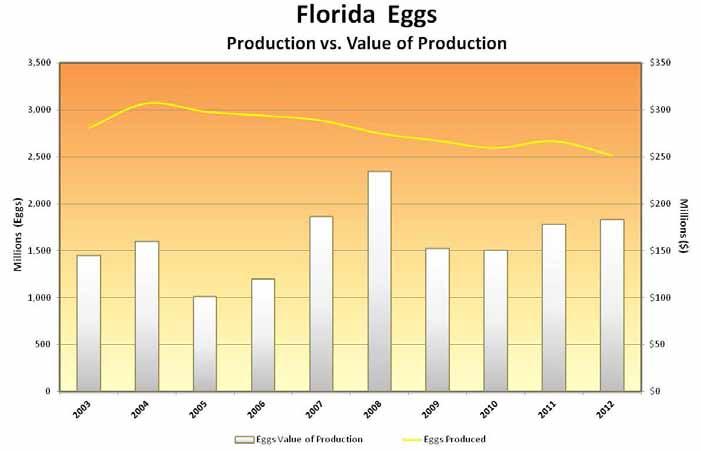
53 LIVESTOCK HIGHLIGHTS Dairy Florida dairies produced 2.34 billion pounds of milk in 2012, up from 2.27 billion pounds produced during Annual milk production per cow was 19,008 pounds, down from 19,067 pounds per cow in On January 1, 2013, there were 123,000 milk cows on Florida farms and commercial dairies, up from 120,000 milk cows a year earlier. The top ranking counties for dairy cattle on January 1, 2013, were Okeechobee, Lafayette, and Gilchrist. Florida ranked 19th among States in the number of milk cows. Cash receipts from marketings of Florida milk in 2012 totaled $520 million, down from $547 million in In 2012, the highest price of replacement milk cows was $1,490 per head in January. The annual average farm-gate price for milk in Florida was $22.30 per hundredweight in 2012, down from $24.20 in Beef All cattle and calves on Florida farms and ranches as of January 1, 2013, including dairy cattle, totaled 1,660,000 head, down 50,000 from The three top ranking counties for cattle were Okeechobee, Highlands, and Osceola counties. Beef cows in Florida were 908,000 head, down 32,000 head from Nationally, Florida ranked 12th in beef cows and 17th in total cattle. Calves born during 2012 totaled 860,000, down 30,000 head from Cash receipts from cattle and calf marketings were $669 million in 2012, up from $488 million in The average annual price of cattle marketed in Florida in 2012 was $ per hundredweight, up from $88.70 per hundredweight in The average price for calves in 2012 was $ per hundredweight, up from $ per hundredweight in Poultry Hens and pullets of laying age on farms in December 2012 were 8.74 million birds, compared to 10.2 million birds in December Florida egg production from December 1, 2011 to November 30, 2012, was 2,514 million eggs, a decrease from the previous year s production of 2,666 million eggs. The total value of Florida egg production in 2012 was $183 million, up from $178 million in The value of broilers produced in Florida during 2012 totaled $179 million, up from $176 million a year earlier. Florida liveweight broiler production in 2012 totaled 357 million pounds, down from 383 million pounds produced in Broilers produced in Florida during 2012 totaled 60 million birds, down three percent from 62 million birds in Broilers hatched in Florida were 53 million birds, down from 56 million birds in Hogs The hog inventory in Florida on January 1, 2012 was 15,000 head. There were 29,000 head of hogs marketed in Florida in 2012, down from 34,000 head in There were 66,900 head slaughtered in 2012, down from 94,900 head in The average market year price in 2012 was $64.00 per hundredweight, down from $64.70 per hundredweight in Cash receipts from hogs in 2012 were $2.56 million. 53
54 Florida Cows and Heifers: Beef and Milk Cows that have Calved, and Beef and Dairy Herd Replacement Heifers: January 1, Year Cows and heifers that have calved Total Beef Milk Milk cattle Percent of Total (1,000 head) Heifers 500 pounds and over Total Beef Milk Other Heifers , , , , , , , , , , Florida Milk Cows: Inventory by County: January 1, Year Alachua De Soto Duval Escambia Gilchrist , , , , ,000 3, ,700 3, ,000 3, ,500 3, ,700 3, ,800 3,600 (1) (1) (head) (1) (1) 3,000 1,000 14,000 2, ,000 (1) (1) (1) (1) (1) (1) (1) (1) (1) (1) (1) (1) (1) (1) (1) ,000 Year Hardee Hernando Highlands Hillsborough Holmes ,000 2,200 4,600 3, ,000 1,800 6,200 3,500 1, ,000 2,400 6,400 3,100 1, ,000 1,900 5,800 1, ,000 1,900 5,300 1, ,000 1,600 6,000 1, ,000 1,300 5,800 1, ,300 1,400 6,000 1, ,000 1,600 6,100 1,400 1, ,200 1,700 6,200 1,400 1,000 Footnotes on next page --continued (head) 18,000 15,000 14,500 14,000 13,900 14,800 15,000 54
55 Florida Milk Cows: Inventory by County: January 1, (continued) Year Jackson Lafayette Lake Levy Manatee ,700 11,000 2,300 8,600 3, ,900 11, ,400 11, ,200 12,000 (head) (1) (1) (1) (1) (1) (1) ,200 14, , , , ,000 14, , ,000 (1) , , , ,500 Year Marion Okeechobee Pasco Sarasota Sumter (head) ,400 30,000 4, ,200 33,000 3, (1) (1) (1) (1) (1) (1) (1) (1) 30,000 3,100 31,000 1,700 31,000 1,700 1,500 29,500 1,900 3,000 28,000 1,800 3,000 28,500 1,700 2,900 30,000 2,000 3,100 30,500 2,000 3,100 (1) 3,000 3,200 2,900 3,300 1,100 (1) (1) (1) (1) (1) (1) Year Suwannee Washington Other counties 2 Noncommercial 3 Total , , , ,000 (1) (1) (1) (1) (head) 23, ,000 26, ,000 34, ,000 29, , , , , , , , , , , , , , , , , , , ,000 1 Included in Other counties. 2 Combined with other counties to avoid disclosing individual operations. 3 Non-commercial production is used on farms where produced. All milk cows both dry and in milk which have calved at least once (1) (1) (1) (1) (1) (1) 55
56 Florida Milk Cows and Production: Milk Cows, Monthly Milk Production per Cow, and Annual Production: Year Jan Feb Mar Apr May Jun Jul Aug Sep Oct Nov Dec Annual Milk Cows Thousands Monthly Production Per Cow Pounds ,360 1,290 1,435 1,415 1,385 1,290 1,215 1,120 1,020 1,105 1,180 1,355 15, ,435 1,415 1,550 1,515 1,525 1,395 1,340 1,225 1,025 1,165 1,250 1,450 16, ,520 1,475 1,640 1,570 1,585 1,440 1,315 1,235 1,105 1,135 1,220 1,360 16, ,485 1,425 1,640 1,540 1,520 1,415 1,350 1,180 1,100 1,185 1,245 1,390 16, ,470 1,415 1,610 1,580 1,615 1,465 1,380 1,215 1,150 1,120 1,200 1,360 16, ,550 1,530 1,655 1,568 1,625 1,440 1,375 1,240 1,160 1,225 1,320 1,520 17, ,660 1,540 1,760 1,710 1,700 1,535 1,450 1,325 1,180 1,230 1,360 1,545 18, ,615 1,595 1,820 1,770 1,700 1,600 1,530 1,335 1,255 1,335 1,465 1,660 18, ,775 1,690 1,865 1,740 1,725 1,630 1,520 1,400 1,300 1,350 1,460 1,630 19, ,780 1,720 1,865 1,800 1,770 1,620 1,520 1,410 1,250 1,310 1,460 1,580 19,008 Annual Milk Production (million pounds) , , , , , , , , , ,338 56
57 Florida Milk: Milk Production, Utilization, Milkfat, and Cash Receipts: Year Total milk production 1 Milk used on farms Milk sold to plants and dealers 2 Milkfat Cash receipts from marketings (million pounds) (percent) (1,000 dollars) , , , , , , , , , , , , , , , , , , , , , , , , , , , , , ,036 1 Excludes milk fed to calves. 2 Includes sales directly to consumers by producers who sell milk from their own herds. Also includes milk produced by institutional herds. Florida Milk Price: Monthly and Annual Price for Milk Marketed by Producers to Plants: Year January February March April May June (dollars per cwt) Year July August September October November December Weighted Average (dollars per cwt) Milk eligible for fluid market 57

58 Florida Replacement Milk Cow Price: Price per Head, by Quarter: Year January April July October (dollars per head) ,600 1,500 1,450 1, ,490 1,700 1,900 1, ,860 1,860 1,940 1, ,980 1,910 1,880 1, ,770 1,850 2,050 2, ,200 2,250 2,350 2, ,990 1,550 1,550 1, ,360 1,450 1,360 1, ,360 1,480 1,550 1, ,490 1,450 1,440 1,470 58
59 Florida Cattle And Calves: Inventory by County, January 1, , and County Rank 2013 Year Alachua Baker Bay Bradford Brevard Broward ,000 4, ,000 4, ,000 4, ,000 4, ,000 5, ,000 5, ,000 6,000 (head) 11,000 23,000 13,000 10,000 24,000 13,000 10,000 24,000 12,000 11,000 24,000 12,000 11,000 24,000 8,000 10,000 29,000 5,000 10,000 26,000 3, ,000 5,500 1,000 9,500 25,000 3, ,000 5,100 1,000 10,200 29,000 5, ,500 5,000 1,000 9,900 28,000 4,900 Rank (1) 39 (1) 45 (1) Year Calhoun Charlotte Citrus Clay Collier Columbia ,000 20,000 8,000 9,000 10,000 18, ,000 20,000 8,000 9,000 9,000 18, ,000 19,000 8,000 9,000 9,000 17, ,000 20,000 8,000 9,000 12,000 18, ,000 22,000 7,000 7,000 11,000 20, ,000 24,000 7,000 6,000 11,000 21, ,000 19,500 7,000 6,000 11,000 22, ,500 19,000 6,700 5,700 10,500 21, ,000 22,000 7,100 6,100 11,200 21, ,900 21,000 6,900 5,900 10,900 21,000 Rank (1) 21 (1) 35 (1) 38 (1) (1) Year De Soto Dixie Duval Escambia Flagler Gadsden ,000 4,000 9,000 9,000 6,000 5, ,000 4,000 8,000 10,000 5,000 5, ,000 4,000 8,000 9,000 5,000 5, ,000 4,000 8,000 9,000 6,000 5, ,000 6,000 7,000 8,000 5,000 5, ,000 7,000 6,000 7,000 5,000 6, ,000 8,500 5,500 7,000 4,000 6, ,000 8,000 5,500 6,000 4,000 5, ,000 7,500 6,100 7,100 5,100 6, ,000 7,300 5,900 6,900 5,000 5,900 Rank (1) 36 (1) 39 (1) 38 (1) Footnotes on last page of table. (head) (head) --continued 59
60 Florida Cattle And Calves: Inventory by County, January 1, , and County Rank 2013 (continued) Year Gilchrist Glades Gulf Hamilton Hardee Hendry (head) ,000 69, ,000 68, ,000 67, ,000 71, ,000 65, ,000 59, ,500 56, ,000 54,000 8,000 88,000 85,000 8,000 85,000 84,000 8,000 85,000 83,000 8,000 88,000 85,000 8,000 87,000 77,000 8,000 85,000 67,000 8,500 86,000 58,000 8,000 82,000 57, ,000 59, ,200 85,000 65, ,000 57, ,900 83,000 63,000 Rank (1) 8 46 (1) (1) Year Hernando Highlands Hillsborough Holmes Indian River Jackson (head) , ,000 59,000 18,000 16,000 40, , ,000 58,000 17,000 15,000 39, , ,000 57,000 17,000 15,000 37, , ,000 61,000 17,000 16,000 36, , ,000 63,000 22,000 17,000 42, , ,000 64,000 28,000 19,000 48, , ,000 67,000 33,000 20,000 54, , ,000 63,000 31,000 19,000 51, , ,000 65,000 28,500 19,500 49, , ,000 63,000 27,500 18,900 47,500 Rank (1) Year Jefferson Lafayette Lake Lee Leon Levy (head) ,000 20,000 28,000 14,000 5,000 44, ,000 20,000 28,000 14,000 5,000 44, ,000 20,000 29,000 14,000 5,000 41, ,000 21,000 28,000 14,000 5,000 40, ,000 25,000 25,000 13,000 4,000 37, ,000 28,000 23,000 13,000 3,000 35, ,000 32,000 21,000 12,500 2,000 33, ,500 30,000 21,000 11,500 2,000 31, ,200 28,000 23,500 13,000 3,100 35, ,900 27,000 23,000 12,600 3,000 34,500 Rank (1) (1 16 Footnotes on last page of table. --continued 60
61 Florida Cattle And Calves: Inventory by County, January 1, , and County Rank 2013 (continued) Year Madison Manatee Marion Martin Miami-Dade Nassau (head) ,000 53,000 43,000 25,000 4,000 6, ,000 53,000 42,000 24,000 3,000 6, ,000 52,000 40,000 24,000 3,000 6, ,000 54,000 41,000 25,000 3,000 7, ,000 47,000 39,000 24,000 3,000 7, ,000 41,000 45,000 23,000 3,000 7, ,000 36,000 48,000 23,000 3,000 7, ,000 36,000 46,000 22,000 2,900 6, ,000 38,500 47,000 23,500 3,000 7, ,000 37,500 45,500 23,000 3,000 6,900 Rank (1) (1) 21 (1) 43 (1) 35 (1) Year Okaloosa Okeechobee Orange Osceola Palm Beach Pasco (head) , ,000 13, ,000 4,000 42, , ,000 13, ,000 4,000 48, , ,000 13, ,000 4,000 47, , ,000 12, ,000 4,000 48, , ,000 12, ,000 4,000 43, , ,000 11, ,000 4,000 38, , ,000 11, ,000 4,000 35, , ,000 10, ,000 3,900 34, , ,000 11, ,000 4,000 39, , ,000 10, ,000 3,900 38,000 Rank (1) (1) 42 (1) 12 Year Pinellas Polk Putnam St. Johns St. Lucie Santa Rosa (head) ,000 10,000 4,000 28,000 6, ,000 9,000 4,000 27,000 6, ,000 9,000 4,000 26,000 5, ,000 10,000 4,000 26,000 5, ,000 9,000 4,000 25,000 6, ,000 9,000 3,000 23,000 6, ,000 9,000 3,000 21,000 8, ,000 8,600 2,900 21,000 7, ,000 9,500 3,000 23,500 6, ,000 9,200 2,900 23,000 5,900 Rank (1) 4 32 (1) 44 (1) 21 (1) 38 (1) Footnotes on last page of table. --continued 61
62 Florida Cattle And Calves: Inventory by County, January 1, , and County Rank 2013 (continued) Year Sarasota Seminole Sumter Suwannee Taylor Union ,000 10,000 43,000 46,000 5,000 8, ,000 10,000 44,000 44,000 5,000 8, ,000 10,000 44,000 43,000 5,000 8, ,000 9,000 47,000 44,000 5,000 8, ,000 8,000 42,000 53,000 5,000 8, ,000 7,000 36,000 55,000 4,000 9, ,000 6,000 37,000 62,000 3,500 10, ,300 6,000 34,000 59,000 3,500 9, ,500 7,000 36,500 56,000 4,100 9, ,000 6,800 35,000 54,000 4,000 9,200 Rank (1) 32 (1) (head) Year Volusia Wakulla Walton Washington Other counties 3 Total ,000 1,000 10,000 8,000 3,000 1,740, ,000 1,000 9,000 8,000 3,000 1,710, ,000 1,000 8,000 8,000 3,000 1,680, ,000 1,000 9,000 8,000 3,000 1,730, ,000 1,100 16,000 8,000 2,900 1,710, ,000 1,000 22,000 9,000 3,000 1,700, ,000 1,000 29,000 9,500 3,000 1,720, ,000 1,000 27,000 9,000 2,000 1,630, ,000 1,000 24,000 9,200 1,000 1,710, ,600 1,000 23,500 8,900 1,000 1,660,000 (head) Rank (1) All classes, for both beef and dairy 1 Two or more counties with similar ranking. 2 Included in Other counties. 3 Combined with other counties to avoid disclosing individual operations. 62
63 63
64 Florida Beef Cows: Inventory by County, January 1, and County Rank 2013 Year Alachua Baker Bay Bradford Brevard Broward ,000 2, ,000 2, ,000 2, ,000 2, , , , , , ,000 (head) 7,000 14,000 5,000 7,000 14,000 5,000 7,000 13,000 5,000 7,000 14,000 5, Rank... 7 (1) (1) Year Calhoun Charlotte Citrus Clay Collier Columbia ,000 14,000 5,500 3,000 7,000 11, ,000 14,000 5,000 3,000 7,000 10, ,000 13,000 5,000 3,500 7,000 10, ,000 13,000 5,000 4,000 8,000 10, ,000 15,000 16,500 15,000 15,000 14,500 (head) 3,000 2,000 1,000 2,000 2,000 1,900 8,000 12,000 7,000 12,000 7,000 13,000 6,900 11,500 7,000 11,800 6,800 11,400 Rank Year De Soto Dixie Duval Escambia Flagler Gadsden ,000 2,000 3,000 3,500 4,000 2, ,000 2,000 3,000 3,500 4,000 2, ,000 2,000 2,500 3,500 4,000 2, ,000 2,000 3,000 3,500 4,000 2,500 (head) , , , , , ,500 4,000 3,500 3,500 3,400 3,400 3,300 Rank Footnotes on last page of table. --continued 64
65 Florida Beef Cows: Inventory by County, January 1, and County Rank 2013 (continued) Year Gilchrist Glades Hamilton Hardee Hendry Hernando (head) ,000 34,000 5,000 50,000 48,000 8, ,000 34,000 5,000 50,000 48,000 8, ,000 33,000 5,000 50,000 48,000 7, ,000 35,000 5,000 52,000 49,000 7, , , , , , ,700 49,000 47,000 47,000 46,000 47,000 45,000 Rank (1) 4 18 (1) Year Highlands Hillsborough Holmes Indian River Jackson Jefferson (head) ,000 30,000 8,000 11,000 20,000 5, ,000 30,000 8,000 11,000 19,000 4, ,000 29,000 8,000 10,000 18,000 4, ,000 30,000 8,000 10,000 17,000 4,000 7,000 8,000 8,500 7,900 8,000 7, ,000 33,000 11,000 11,000 21, ,000 36,000 15,000 12,000 25, ,000 40,000 17,000 14,000 30, ,000 37,000 16,000 12,000 28, ,000 36,500 15,500 12,000 27, ,000 35,000 15,000 11,600 26,000 (2 Rank Year Lafayette Lake Lee Leon Levy Liberty (head) ,000 15,000 9,000 2,500 23, ,000 14,000 9,000 2,000 21, ,000 13,000 8,000 2,000 21, ,000 14,000 8,000 2,000 21, ,000 14,000 8,000 2,000 20, ,000 13,000 8,000 1,500 19, ,500 14,000 8,500 1,600 18, ,900 12,000 8,000 1,500 18, ,900 13,000 8,000 1,500 19, ,700 12,600 7,700 1,400 18,400 Rank (1) Footnotes on last page of table. --continued 65
66 Florida Beef Cows: Inventory by County, January 1, and County Rank 2013 Year Madison Manatee Marion Martin Miami-Dade Nassau (continued) ,000 29,000 24,000 12,000 2,500 3, ,000 29,000 24,000 12,000 2,500 3, ,000 29,000 24,000 12,000 2,000 2, ,000 30,000 27,000 13,000 2,000 2, ,000 27,000 23,000 27,000 21,000 27,000 22,000 26,000 23,000 26,500 22,000 26,000 Rank... 9 (1) 8 (1) (1) 26 Year Okaloosa Okeechobee Orange Osceola Palm Beach Pasco ,000 70,000 8,000 75,000 2,500 28, ,000 70,000 8,000 73,000 2,500 26, ,000 69,000 8,000 73,000 3,000 26, ,000 69,000 8,000 76,000 3,000 26, ,000 67, ,000 66, ,000 64, ,000 65, ,000 66, ,900 64,000 Rank (1) (1) (head) (head) 75,000 75,000 75,000 74,000 74,000 71,000 Year Pinellas Polk Putnam St. Johns St. Lucie Santa Rosa (head) 1,800 2,000 2,000 2,000 2,000 1,900 25,000 23,000 23,000 22,000 23,000 22,000 60,000 5,000 2,500 23,000 4,000 60,000 5,000 2,500 22,000 4,000 62,000 5,000 2,500 20,000 3,500 65,000 6,000 2,500 21,000 3,500 Rank (1) 23 Footnotes on last page of table. --continued 2,500 2,000 2,000 2,000 2,000 1,900 4,000 4,000 4,000 3,900 3,900 3,800 66
67 Florida Beef Cows: Inventory by County, January 1, and County Rank 2013 Year Sarasota Seminole Sumter Suwannee Taylor Union (head) (continued) ,000 7,000 31,000 18,000 3,000 4, ,000 7,000 30,000 17,000 3,000 4, ,000 6,000 30,000 16,000 2,500 4, ,000 6,000 31,000 16,000 3,000 4, , , , , , ,200 18,000 3,000 5,000 20,000 3,000 6,000 22,000 2,500 6,000 20,000 2,500 6,000 20,000 2,900 6,000 19,300 2,800 5,800 Rank Year Volusia Wakulla Walton Washington Other counties 3 Total , ,000 3,500 1, , , ,000 3,500 1, , , ,000 3,500 1, , , ,000 3,500 1, , (head) 500 7,000 3, , , ,000 5, , , ,500 5, , , ,000 5, , , ,000 5, , , ,700 4, , ,000 Rank (1) 21 Beef production brood cows only, which have calved at least once 1 Two or more counties with similar ranking. 2 Included in Other counties. 3 Combined with other counties to avoid disclosing individual operations. 67

68 Florida Cattle and Calves: Marketings, Cash Receipts, and Gross Income: Year Marketings 1 Price Per 100 Pounds Cash Cattle Calves Receipts 2 (1,000 lbs) (dollars) (1,000 dollars) Gross Income , , , , , , , , , , , , , , , , , , , , , , , , , , , , , ,820 1 Excludes custom slaughter for use on farms where produced and inter-farms sales within States. 2 Receipts from marketings and sales of farm slaughter. 3 Cash receipts plus the value of home consumption. 68
69 Florida Cattle and Calves: Cows, Bulls, Steers, Heifers and Calves on Farm: January 1, Year Milk Cows 1 Cattle kept for milk Heifers 500 lbs and over 2 Total Beef cattle and all calves 500 pounds and over Calves Beef under Cows Bulls 3 Replacement Other heifers 4 Steers heifers pounds 3 Total Total cattle and calves (1,000 head) ,560 1, ,532 1, ,506 1, ,570 1, ,555 1, ,547 1, ,578 1, ,486 1, ,555 1, ,503 1,660 1 Cows and heifers that have calved. 2 Milk replacement heifers which have not calved. 3 Includes small number for dairy use. 4 Beef replacement heifers which have not calved. Florida Cattle and Calves: Inventory January 1, Annual Calf Crop, and Disposition: Year On hand January 1 Calf Marketings 2 Inshipments All cattle crop All cows 1 Total Cattle Calves and calves (1,000 head) Farm slaughter cattle and calves 3 Deaths ,750 1, ,740 1, ,710 1, ,680 1, ,730 1, ,710 1, ,700 1, ,720 1, , ,630 1, ,710 1, Cows and heifers that have calved. 2 Includes custom slaughter for use on farms where produced and State outshipments, but excludes inter-farm sales within States. 3 Excludes custom slaughter for farmers at commercial establishments. 69
70 70
71 Florida Livestock Auctions: Location and Day of Sale Sale day Auction market Mailing address Phone Columbia Livestock Market of Lake City, Inc. (Slaughter hogs & feeder pigs, every 3rd Wednesday) P.O. Box 354, Lake City, Florida Monday Ocala Livestock Market (Hog and goat sale 1st Friday) P.O. Drawer 1508, Ocala, Florida Okeechobee Livestock Market, Inc. P.O. Box 1288, Okeechobee, Florida Cattlemen s Livestock Auction Market, Inc. P.O. Box 26, Lakeland, Florida Hardee Livestock Market, Inc. P.O. Box 1479, Wauchula, Florida Townsend Livestock (Hog sale - Monday; Feeder Pigs - 4th Friday) P.O. Box 577, Madison, Florida Tuesday Tri-State Cattlemen s Market, Inc. P.O. Box 744, Graceville, Florida Okeechobee Livestock Market, Inc. P.O. Box 1288, Okeechobee, Florida Sumter Co. Farmer s Market, Inc. P.O. Box 62, Webster, Florida Wednesday Arcadia State Livestock Market P.O. Drawer 1418, Arcadia, Florida North Florida Livestock Market (Hog sale 4 th Saturday each month) S U.S. Highway 441, Lake City, Florida Florida Cattle and Calves: Cattle and Calves Sold through Florida Auction Markets, by area: Year All areas 1 North Central South , , , , , , , , , ,100 92, , , ,300 85, , , ,900 88, , , ,400 79, , , ,590 85, , ,040 98,900 83, , ,140 93,720 79, , (NA) (NA) (NA) (NA) NA Not Available 1 Does not include sales through video auctions (head) 71
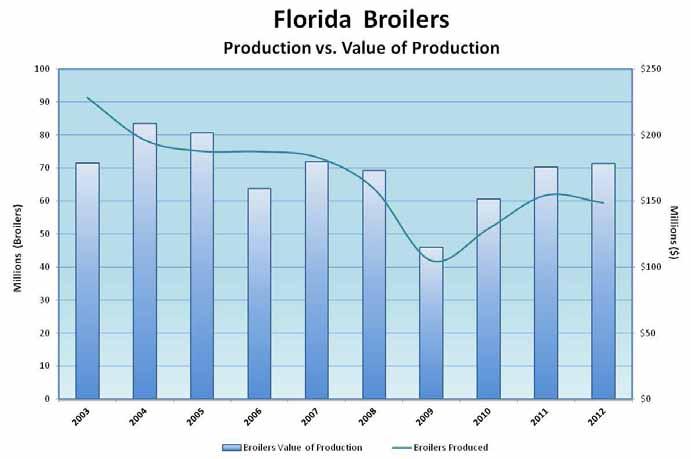
72 Florida Chickens: Annual Value of Production: Year Broilers Eggs Other chickens Total (1,000 dollars) , , , , , , , , , , , , , , , , , , , , , , , , , , , , , ,101 Florida Eggs: Layers, Eggs Produced, and Value of Production: Year Average layers during year Eggs per layer Eggs produced Value per dozen Value of Production (thousands) (number of eggs) (millions) (cents) (1,000 dollars) , , , , , , , , , , , , , , , , , , , , , , , , , , , , ,514 (NA) 183,166 Florida Broilers: Number and Pounds Produced, Price per Pound, and Value of Production: Year Broilers Pounds Value of Value per pound produced produced production (thousands) (cents) (1,000 dollars) , , , , , , , , , , , , , , , , , , , , , , , , , , , , ,000 (NA) 178,500 NA Not Available 72
73 73
74 Florida Layers and Eggs: Layers, Daily Rate of Lay, and Egg Production, by Month, and Year: Year December 1 January February March April May Layers (thousands) ,534 10,601 10,868 10,903 10,577 10, ,989 11,039 11,275 11,481 11,456 11, ,677 10,325 10,465 10,772 10,839 10, ,481 11,513 11,406 11,416 11,111 10, ,271 11,315 11,216 10,674 10,315 10, ,948 10,907 10,876 10,697 10,460 10, ,340 10,173 9,948 9,989 9,894 9, ,127 9,903 9,664 9,560 9,382 9, ,794 9,534 9,374 9,468 9,569 9, ,003 9,715 9,485 9,343 8,899 8,517 Daily Rate of Lay (per 100 layers) Egg Production (millions of eggs) December of preceding year. --continued 74
75 Florida Layers and Eggs: Layers, Daily Rate of Lay, and Egg Production, by Month, and Year: (continued) Layers Year June July August September October November Average (thousands) ,755 10,813 10,812 10,852 10,926 11,009 10, ,553 11,622 11,464 11,379 11,202 10,954 11, ,930 11,080 11,210 11,354 11,526 11,496 10, ,740 10,619 10,498 10,616 10,703 10,967 10, ,434 10,564 10,642 10,656 10,783 10,869 10, ,232 9,974 9,927 9,930 10,005 10,277 10, ,512 9,611 9,705 9,700 9,721 9,961 9, ,108 9,322 9,594 9,524 9,354 9,652 9, ,416 9,416 9,473 9,553 9,681 9,938 9, ,415 8,372 8,507 8,797 9,044 8,942 9,003 Daily Rate of Lay (per 100 layers) Egg Production (millions of eggs) , , , , , , , , , ,514 75
76 Florida Chicks Hatched: Broiler-type Chicks Hatched in Florida by Commercial Hatcheries: Year January February March April May June (thousands) ,756 5,224 5,899 5,668 5,587 4, ,940 4,669 4,939 4,758 5,021 4, ,854 4,483 4,953 4,819 4,948 4, ,964 4,583 5,052 4,897 5,113 4, ,982 4,587 5,007 4,990 5,108 4, ,013 4,774 5,225 5,038 4,949 4, ,871 3,398 3,645 3,476 3,648 3, ,647 4,542 4,893 4,627 4,997 4, ,707 4,345 4,963 4,889 4,896 4, ,496 4,148 4,272 4,347 4,540 4,355 Year July August September October November December Total (thousands) ,874 4,944 4,801 4,977 4,781 4,926 62, ,987 4,901 4,746 4,933 4,735 4,901 58, ,068 5,080 4,856 5,109 4,930 5,039 59, ,007 5,066 4,899 5,051 4,883 4,874 58, ,029 5,051 4,820 5,069 4,881 4,974 59, ,095 4,851 4,627 4,435 4,378 4,698 57, ,788 3,638 3,279 4,351 4,393 4,818 45, ,969 5,055 4,784 4,674 4,431 4,743 57, ,962 4,945 4,708 4,327 4,337 4,547 56, ,514 4,515 4,442 4,309 4,138 4,498 52,574 76
77 Florida Hogs and Pigs: Number on Farms and Inventory Value: Year Number on farms December 1 Market hogs and pigs Total Total Head Breeding Market Under 50 Pounds Pounds Pounds 180 Pounds and over Inventory value (1,000 head) (1,000 dollars) , , , , , , , , , ,800 Florida Hogs and Pigs: Inventory, Pig Crop, and Disposition: Year Inventory December 1 of Previous Year Sows farrowing Pig crop Inshipments Marketings 1 Farm Slaughter (1,000 head) Deaths Includes custom slaughter for use on farms where produced, but excludes inter-farm sales within State. 77
 Gross income 3 2003... 35 14,200 30.00 4,286 4,400 2004... 30 14,532 43.70 6,362 6,482 2005... 20 10,411 44.50 4,642 4,736 2006... 20 9,169 39.40 3,643 3,660 2007... 20 9,140 39.")
78 Florida Hogs: Inventory December 1, Annual Marketings, Cash Receipts, and Gross Income: Price per Year Head Marketings 100 pounds Cash receipts 2 (1,000 head) (1,000 pounds) (dollars) (1,000 dollars) Gross income , ,286 4, , ,362 6, , ,642 4, , ,643 3, , ,596 3, , ,226 3, , ,447 3, , ,640 2, , ,125 3, , ,561 2,694 1 Excludes custom slaughter for use on farms where produced and interfarm sales within the State. 2 Receipts from marketings and sale of farm slaughter. 3 Cash receipts plus the value of home consumption. 78
79 Florida Commercial Hogs Slaughter: 1 Head, Average Live Weight, and Total Live Weight: Year Head Average live weight Total live weight (pounds) , ,081, , ,243, , ,657, , ,643, , ,794, , ,166, , ,809, , ,212, , ,563, , ,176,000 1 Includes slaughter under Federal inspection, excludes farm slaughter 79
80 80
81 SEASON VEGETABLE HIGHLIGHTS 2012 United States Fresh Market Vegetable Production Up 1 Percent from 2011 United States fresh market vegetable and melon production for the 24 selected crops estimated in 2012 totaled 438 million hundredweight, up 1 percent from last year. The harvested area covered 1.68 million acres, up 1 percent from Value of the 2012 crop is estimated at 10.1 billion dollars, down 6 percent from a year ago. The three largest crops, in terms of production, are onions, head lettuce, and watermelons, which combined to account for 36 percent of the total production. Onions, tomatoes, and sweet corn claim the highest values, accounting for 26 percent of the total value when combined. For the vegetables and melons estimated in 2012, Florida was the second leading fresh market vegetable state, in 2012 accounting for 11 percent of the harvested area, 9 percent of production, and 11 percent of the value of production. Leading Fresh Market Vegetable States in 2012 Rank State California Florida Arizona Georgia New York Area harvested Production Value Percent of total State California Florida Arizona Georgia Washington Percent of total State California Florida Arizona Georgia New York Percent of total In 2012, NASS began estimating vegetable production on a calendar year basis. Data included in this publication reflects vegetable acreage, yield, production, and value for January 1, 2012 through December 31, Monthly price data was not available for vegetables during Production was up for many vegetables compared to the previous year, but prices were down and resulted in a lower total value of production. Prices were up for snap beans, cucumbers, watermelons, and blueberries. Value The 2012 value of Florida production for the seven major vegetable crops, berries, and watermelons totaled $1.41 billion, down 19 percent from the 2011 value of $1.73 billion. The ranking from the highest to lowest value of the published vegetable and berry crops are: (1) tomatoes, peppers, (3) strawberries, (4) sweet corn, (5) snap beans, (6) watermelons, (7) cucumbers, (8) squash, (9) blueberries, and (10) cabbage. Crops that increased in value and percentage increase included cucumbers (30%), snap beans (27%), watermelons (23%), and sweet corn (3%). Crops that decreased in value and percentage included strawberries (-45%), tomatoes (-38%), cabbage (-22%), bell peppers (-16%), squash (-13%), and blueberries (-10%). Acreage The harvested acreage for 2012 of the major vegetable crops, watermelons, potatoes, sweet potatoes, strawberries, and blueberries totaled 242,800, up from the 232,700 acres harvested the previous year. Crops with increased acreage included sweet potatoes (210%), blueberries (18%), cucumbers (14%), cabbage (14%), snap beans (7%), squash (4%), watermelons (4%), potatoes (3%), tomatoes (2%), and peppers (2%). Crops with less acreage and percentage decrease included strawberries (-12%) and sweet corn (-2%). 81
82 Principal Fresh Market Vegetable Planted, Harvested, Production and Value Florida: Year Area planted Area harvested Production Value of production (acres) (1,000 cwt) (1,000 dollars) , ,500 34,277 1,527, , ,400 36,458 1,293, , ,700 38,095 1,145,281 1 Only includes estimates for the selected crops in the NASS annual program. These crops are not estimated for all States that might produce them. See the 2007 Census of Agriculture for a comprehensive tally of total vegetable acres by State. Includes processing total for dual usage crops (asparagus, broccoli, and cauliflower) Production Production in 2012 of the major vegetable crops, watermelons, potatoes, sweet potatoes, strawberries, and blueberries totaled million hundredweight, up 2 percent from Production increased for sweet potatoes (58%), cucumber (18%), cabbage (14%), sweet corn (7%), tomatoes (5%), peppers (2%), and snap beans (1%). Crops with less production and percentage decrease included strawberries (26%), blueberries (20%), squash (-10%), potatoes (2%), and watermelons (-1%). Weather for the 2012 Growing Season January 2012 began with freezing temperatures in the southern portions of the State and caused some damage to the vegetable crops. Most vegetable growers worked around the clock in the fields to protect their crops and plants from the chilling temperatures. Strawberry growers ran overhead sprinklers to form ice caps on plants as cold protection. Harvesting and replanting of winter vegetables continued in the southern Peninsula. Hastings growers began planting potatoes. Market movement included snap beans, cabbage, celery, sweet corn, cucumbers, eggplant, endive, escarole, bell peppers, radishes, squash, and tomatoes. February saw dry conditions and average temperatures. Producers were irrigating fields throughout the month due to drought conditions. Vegetable planting continued in St. Lucie County. Some damage was reported in St. Johns County to potatoes and Putnam County to cabbage due to frost. Producers harvested snap beans, cabbage, celery, sweet corn, eggplant, endive, escarole, bell peppers, radishes, squash, strawberries, and tomatoes. During March, the harvesting of winter vegetables was ongoing in south Florida and increased as the month progressed. Favorable weather conditions allowed planting and harvesting to remain on schedule. Producers were planting watermelons in north-central Florida. Supplies of strawberries increased as growers met the demands of the March Strawberry Festival. Some farmers were planting and preparing fields for the spring harvest (April-July). Very light harvesting of blueberries was underway. In April, drought conditions prevailed throughout most of the State. Clear, dry conditions allowed fieldwork and harvesting to progress unabated. The dry weather increased the need for irrigation in the central and southern Peninsula areas. Cabbage and celery supplies declined as the season ended. The watermelon harvest began earlier than usual. The potato harvest began in the Hastings area. In May, drought conditions continued. The vegetable harvest finished in the Miami-Dade area, while potato harvest continued in Flagler and Putnam counties. Watermelon, squash, and cantaloupe harvest continued. Quincy tomato growers prepared fields for summer harvesting. Producers marketed snap beans, blueberries, cantaloupes, sweet corn, cucumbers, eggplant, okra, bell peppers, squash, tomatoes, and watermelons. June brought heavy rains as Tropical Storm Beryl and Debby passed through the State. Rain and wet fields delayed harvesting in many areas. In Gilchrist County, producers harvested watermelons. Tomato harvesting continued in Gadsden County. In Washington County, watermelon and sweet corn fields were harvested at a rapid pace. In Miami- Dade County, mangoes and avocadoes were marketed. Tomato harvesting remained active in the Quincy area with supplies declining seasonally. Growers marketed avocados, cantaloupes, mangoes, and tomatoes. 82

83 In July most vegetables were finished for the season. There was some tomato harvesting in western and central Florida. In Okeechobee County, irrigated sweet corn harvesting continued. Northern Peninsula growers were still harvesting light supplies of watermelons as the season concluded. In August vegetable growers were busy with land preparation, fumigating, and laying plastic for the fall crops. Harvesting and replanting of okra and sweet potatoes was underway. Rain late in the month disrupted some land preparations and planting schedules around Charlotte, Collier, Hendry, and Lee counties. September began with Tropical Storm Isaac bringing up to five inches of rainfall to South Florida. In the southern counties, vegetable growers continued to prepare land and planting increased seasonally. Flagler and Putnam county growers planted cabbage. Okra, cucumbers, and tomatoes were being marketed at the end of the month. In October, the fall vegetable harvest was in full swing with lots of activity at the local farmers markets. Growers were planting winter vegetables in south Miami-Dade County. The harvest of tomatoes continued in Gadsden County. Strawberry planting was in full swing in Hillsborough County. Vegetables being marketed included tomatoes, beans, corn, cucumbers, okra, watermelon, and light volumes of eggplants. In November, growers enjoyed mild temperatures and dry conditions. Harvesting and replanting of winter vegetables was progressing well in south Florida, while cabbage and strawberry planting continued in other parts of the State. Crops coming to market included green beans, sweet corn, cucumber, squash, peppers, tomatoes, and watermelons. In December, dry conditions prompted vegetable growers to irrigate to keep moisture levels up. Above normal temperatures for this time of year resulted in good growing conditions for vegetables. Tomato harvest ended in Gadsden County. Vegetables marketed included corn, cucumbers, green beans, eggplant, lettuce, peppers, radishes, and tomatoes. Early marketing of strawberries was also reported. U.S. Drought Monitor 2012 by Quarter, Florida January 3, 2012 April 3, 2012 July 3, 2012 October 2, 2012 Intensity: D0, Abnormally Dry D1, Drought Moderate D2, Drought Severe D3, Drought Extreme D4, Drought Exceptional 83
84 DEFINITIONS AND EXPLANATIONS Planted Acreage is the total acreage which has been planted for harvest during the crop year. Acreage lost and replanted to the same crop in time for harvest in the same quarter is counted only once. Acreage harvested and planted again to the same crop is counted twice. Harvested Acreage is the acreage partially or completely harvested. Acreage lost before or at maturity through natural or economic causes is not included in the acreage for harvest. Yield is the average production per harvested acre of merchantable quality harvested and sold or utilized for human consumption. Production is the quantity actually harvested and sold or utilized for human consumption. Unit Value for fresh market sales is the equivalent price received, f.o.b. shipping point basis and encompasses all grades and sizes marketed or utilized. Included are packing charges, selling charges, precooling, top ice, or other costs which contribute to the value of the product at shipping point. The value per unit for quantities sold to processors is the average value paid for usable quantities, on a "delivered to plant door" basis. This value includes transportation and other normal costs incident to delivery at plant door. Total Value is the equivalent value of production sold or utilized based on the unit value. Cullage and other quantities not sold or utilized because of natural or economic factors are excluded. Other Counties include harvested acreage for all counties for which either published data would result in the disclosure of individual operations or acreage totals for specific commodities of minor importance in the State. Production And Price Unit - The official USDA vegetable crop estimates are published on a weight basis. For this bulletin, the official estimates for most vegetable crops have been converted to hundredweight. If changes in container weights are necessary, all data pertaining to the production of the commodity in question are revised to maintain comparability between years. The table below gives the net weight used per container and the number of containers per hundredweight for Florida produce. Florida Produce 1 Commodity Unit Estimated net weight Number of units per cwt Commodity Unit Estimated net weight Number of units per cwt (pounds) (pounds) Snap Beans... Bushel Lettuce, Iceberg... Carton Blueberries... Flat Lettuce, Romaine... Carton Cabbage... Crate Lettuce, Leaf... Carton Carrots... Sack Okra... Bushel Cauliflower... Carton Parsley... Crate Celery... Crate Bell Pepper... Bushel Chinese Cabbage... Crate Potatoes... Sack Sweet Corn... Crate Radishes... Carton Cucumbers... Bushel Squash... Bushel Eggplant... Bushel Strawberries... Flat Escarole... Crate Sweet Potatoes... Crate Lettuce, Bibb... Carton Tomatoes... Carton Lettuce, Boston... Carton Watermelons... Cwt Most common unit, estimated weight, and units per hundredweight, 2012 crop season CONFIDENTIALITY OF COLLECTED DATA All information collected from individual agricultural producers is held strictly confidential. Data provided by individual producers or other agricultural firms are used only to compile and publish statistics at the county, State, and national levels. Statistics at the county and State level are not published if they will potentially disclose information about an individual or operation. In addition, all names and addresses obtained by this office are held confidential. 84

85 PRINCIPAL VEGETABLES BY PRODUCTION AREAS 1 - WEST A. Holmes-Jackson-Washington counties: Butter beans, field peas, watermelons. B. Gadsden County: Pole beans, squash, sweet corn, tomatoes. 2 - NORTH C. Suwannee Valley: Beans, corn, cucumbers, greens, peas, peppers, potatoes, squash, watermelons. D. Starke-Brooker-Lake Butler: Lima beans, snap beans, blueberries, cucumbers, peppers, squash, strawberries. E. Hastings: Cabbage, potatoes. F. Gainesville-Alachua: Blueberries, bush beans, cucumbers, peppers, potatoes, squash. G. Island Grove-Hawthorne: Blueberries, cucumbers, peppers, sweet corn, squash, watermelons. 3 - NORTH CENTRAL H. Oxford-Pedro: Tomatoes, watermelons. I. Sanford-Oviedo-Zellwood: Cabbage, chinese cabbage, sweet corn, cucumbers, greens, spinach. J. Webster: Cucumbers, eggplant, peppers. 4 - WEST CENTRAL K. Lake Placid: Sweet corn, radishes, lettuce, parsley, beets. L. Plant City-Balm: Blueberries, bush and pole beans, lima beans, cabbage, cucumbers, eggplant, field peas, greens, squash, strawberries, cherry tomatoes, watermelons. M. Palmetto-Ruskin: Cabbage, cauliflower, potatoes, strawberries, tomatoes, cherry tomatoes, plum tomatoes, watermelons. N. Sarasota: Cabbage, celery, cucumbers, sweet corn, escarole, lettuce, radishes. O. Wauchula: Blueberries, cucumbers, eggplant, peppers, tomatoes, watermelons, squash. 5 - EAST CENTRAL P. Ft. Pierce: Tomatoes, watermelons, snap beans. 6 - SOUTHWEST Q. Snap beans, sweet corn, cucumbers, eggplant, sweet and hot peppers, potatoes, squash, tomatoes, cherry tomatoes, plum tomatoes, watermelons. 7 - EVERGLADES R. Bush beans, cabbage, celery, Chinese cabbage, sweet corn, escarole, greens, lettuce, radishes. 8 - SOUTHEAST S. Martin County: Cabbage, potatoes, tomatoes, watermelons. T. Pompano: Bush beans, lima beans, sweet corn, cucumbers, eggplant, sweet and hot peppers, squash, tomatoes, cherry tomatoes, plum tomatoes. U. Homestead: Bush and pole beans, cabbage, sweet corn, eggplant, okra, pickles, potatoes, squash, strawberries, tomatoes, cherry tomatoes, plum tomatoes. 85
86 Florida Vegetables, Watermelons, Potatoes, and Berries: Acreage, Yield, Production and Value, Crop Years 2011 and 2012 Crop Planted acreage Harvested acreage Yield per acre (acres) (cwt) Vegetables Snap beans... 46,000 46,000 40,000 42, Cabbage... 8,800 9,900 8,100 9, Sweet corn... 50,500 49,000 43,000 42, Cucumbers... 10,000 11,200 9,500 10, Bell peppers... 18,700 18,800 17,600 18, Squash... 9,600 10,000 9,300 9, Tomatoes... 30,000 30,000 28,500 29, Total , , , ,400 (X) (X) Watermelons... 25,900 26,500 24,400 25, Potatoes ,400 37,000 35,600 36, Sweet potatoes... 3,300 6,400 3,000 6, Strawberries... 9,900 8,900 9,900 8, Blueberries... (X) (X) 3,800 4, Total, all crops , , , ,800 (X) (X) Crop Production Value per cwt Total value (1,000 cwt) (dollars per cwt) (1,000 dollars) Vegetables Snap beans... 2,400 2, , ,972 Cabbage... 2,754 3, ,994 50,986 Sweet corn... 6,450 6, , ,180 Cucumbers... 2,375 2, ,013 67,392 Bell peppers... 4,400 4, , ,000 Squash... 1,395 1, ,725 66,707 Tomatoes... 9,120 9, , ,960 Total... 28,894 30,628 (X) (X) 1,181,906 1,007,197 Watermelons... 7,564 7, , ,084 Potatoes ,112 8, (D) 144,769 (D) Sweet potatoes (D) (D) (D) (D) Strawberries... 2,475 1, , ,970 Blueberries ,122 62,073 Total, all crops... 48,739 49,763 (X) (X) 1,874,044 1,408,324 X Not applicable. D Withheld to avoid disclosing data for individual operations data is preliminary. 86
87 Florida Snap Beans: Acreage, Production, and Value, Crop Years Crop year Planted Acreage Harvested Yield per acre Production Price per cwt Value of production (acres) (cwt) (1,000 cwt) (dollars) (1,000 dollars) ,400 32, , , ,000 40, , , ,000 42, , ,972 Florida Cabbage: Acreage, Production, and Value, Crop Years Crop year Planted Acreage Harvested Yield per acre Production Price per cwt Value of production (acres) (cwt) (1,000 cwt) (dollars) (1,000 dollars) ,500 9, , , ,800 8, , , ,900 9, , ,986 Florida Sweet Corn: Acreage, Production, and Value, Crop Years Crop year Planted Acreage Harvested Yield per acre Production Price per cwt Value of production (acres) (cwt) (1,000 cwt) (dollars) (1,000 dollars) ,100 42, , , ,500 43, , , ,000 42, , ,180 Florida Cucumbers: Acreage, Production and Value, Crop Years Crop year Acreage Value of Yield per acre Production Price per cwt Planted Harvested production (acres) (cwt) (1,000 cwt) (dollars) (1,000 dollars) ,000 11, , , ,000 9, , , ,200 10, , ,392 Florida Bell Peppers: Acreage, Production, and Value, Crop Years Crop year Planted Acreage Harvested Yield per acre Production Price per cwt Value of production (acres) (cwt) (1,000 cwt) (dollars) ($1,000 dollars) ,800 17, , , ,700 17, , , ,800 18, , ,000 87
88 Florida Potatoes: Acreage, Production, and Value, Crop Years ,2 Crop year Planted Area Harvested Yield per acre Production Value per cwt Value of production (acres) (cwt) (1,000 cwt) (dollars) (1,000 dollars) Spring (Hastings) ,500 20, , , ,400 23, , , ,500 23, ,592 (D) (D) Spring (Other) ,700 11, , , ,000 12, , , ,500 13, ,325 (D) (D) Spring (Total) ,200 31, , , ,400 35, , , ,000 36, ,917 (D) (D) D Withheld to avoid disclosing data for individual operations. 1 Data will be released in September Includes processing Florida Sweet Potatoes: Acreage, Production, and Value, Crop Years Crop year Planted Area Harvested Yield per acre Production Price per cwt Value of production (1,000 acres) (cwt) (1,000 cwt) (dollars) (1,000 dollars) (D) (D) (D) (D) (D) (D) (D) Withheld to avoid disclosing data for individual operations. 3 Estimates began in 2009 Florida Squash: Acreage, Production, and Value, Crop Years Crop year Planted Acreage Harvested Yield per acre Production Price per cwt Value of production (acres) (cwt) (1,000 cwt) (dollars) (1,000 dollars) ,500 9, , , ,600 9, , , ,000 9, , ,707 88
89 Florida Strawberries: Acreage, Production, and Value, Crop Years Crop year Planted Acreage Harvested Yield per acre Production Price per cwt Value of production (acres) (cwt) (1,000 cwt) (dollars) (1,000 dollars) ,800 8, , , ,900 9, , , ,900 8, , ,970 Florida Tomatoes: Acreage, Fresh Market Production, and Value, Crop Years Crop year Planted Acreage Harvested Yield per acre Production 1 Price per cwt Value of production (acres) (cwt) (1,000 cwt) (dollars) ($1,000 dollars) ,000 29, , , ,000 28, , , ,000 29, , ,960 1 Fresh market only. Includes round and plum or pear-shaped varieties, and U-Pic Florida Watermelons: Acreage, Production, and Value, Crop Years Crop year Planted Acreage Harvested Yield per acre Production Price per cwt Value of production (acres) (cwt) (1,000 cwt) (dollars) (1,000 dollars) ,900 24, , , ,900 24, , , ,500 25, , ,084 89
90 Planting and Harvesting Seasons of Selected Florida Vegetables, Berries, Melons Usual Planting Dates 1 Usual Harvesting Dates CROP Begin Most Active End JUL AUG SEP OCT NOV DEC JAN FEB MAR APR MAY JUN JUL Snap Beans 2... Blueberries... Cabbage... Carrots... Cantaloupes... Celery... Sweet Corn... Cucumbers... Eggplant... Escarole/Endive... Lettuce/Romaine... Peppers... Potatoes... Radishes... Squash 3... Strawberries... Tomatoes... Watermelon... JUL AUG SEP OCT NOV DEC JAN FEB MAR APR MAY JUN JUL 1 Usual date direct seeded or transplanted. 2 Includes pole beans. 3 A small acreage of summer squash is marketed locally during July and August. 90


91 HISTORICAL VEGETABLEHIGHLIGHTS *Disclaimer: The Florida Department of Agriculture and Consumer Services provides the subsequent historic production and value of production charts from the USDA-NASS/FASS. The data used to compose the following charts is intended to give the reader an overview of the past twelve years with respect to market changes and fluctuations. However, it should be noted that all data prior to 2010 is based on marketing years; July 1-June 30, not calendar years; Jan 1-Dec 31. For this reason, all data prior to 2010 also includes the fall growing season of the previous year. As new data becomes available in the coming years, USDA-FASS, will continue to add calendar year data. Value of Production & Production of Snap Beans* Florida Value of Production Snap Beans Florida Production Snap Beans 91


92 Production of Cabbage & Bell Peppers* Florida Production Cabbage Florida Production Bell Peppers 92


93 Value of Production & Production of Sweet Corn* Florida Value of Production Sweet Corn Florida Production Sweet Corn 93


94 Value of Production & Production of Cucumbers* Florida Value of Production Cucumbers Florida Production Cucumbers 94


95 Value of Production & Production of Squash* Florida Value of Production Squash Florida Production Squash 95


96 Production of Strawberries & Tomatoes* Florida Production Strawberries Florida Production Tomatoes 96


97 Value of Production & Production of Watermelons* Florida Value of Production Watermelons Florida Production Watermelons 97

98 Value of Production of Potatoes* Florida Value of Production Potatoes 98
99 99

100 HORTICULTURE HIGHLIGHTS Florida s 2012 Floriculture Value of Sales down Two Percent Florida is the second largest U.S. producer of floriculture crops. The State s gross wholesale value of sales for all floriculture crops from producers with more than $10,000 in sales for 2012 totaled $812 million, down $23.4 million or three percent from The Sunshine State produced 20 percent of the Nation s $3.99 billion wholesale value of sales for operations with $100,000 or more in sales. Florida Leads the Nation in Indoor Foliage Plant Sales, Propagative Material, and Cut Cultivated Greens Florida continues to dominate in foliage sales, representing 72 percent of the Nation s foliage sales at $464 million, up 5 percent from the previous year. This increase in foliage sales is in-line with that of the Nation s, which had $642 million in sales and was up 5 percent. Florida s value of propagative material totaled $77.4 million, 21 percent of the Nation s $366 million total. Florida represents 81 percent of the Nation s sales of cut cultivated greens at $57.8 million, up $3.1 million or 6 percent from last year. Nationwide sales of cut cultivated greens totaled $71.0 million, down 1 percent. Number of Producers The total number of producers with sales of $100,000 or more decreased from 702 in 2011 to 634 in 2012, or 10%. The number of producers in Florida within the various sales categories decreased for all categories except those with sales of $500,000 or more, which increased from 208 to 213. Area Used for Production Florida floriculture acreage in the open and uncovered decreased from Shade and temporary cover square footage in the State increased. For film plastic greenhouse footage, operations with sales $10,000 or more decreased by 7 percent. 100
 (acres) (1,000 dollars) 2003... 1,106 373,654 9,572 830,824 2004... 1,020 387,210 9,477 884,126 2005... 932 382,551 8,736 956,580 2006... 832 347,187 8,344 804,854 2007.")
101 Florida Floriculture: Producers, Production Areas, and Value for Operations with $10,000+ Sales, Year Number of producers 1 Total covered area Open ground Expanded wholesale value 2 (1,000 square feet) (acres) (1,000 dollars) , ,654 9, , , ,210 9, , ,551 8, , ,187 8, , ,769 8, , ,974 6, , ,637 9, , ,854 6, , ,463 5, , ,371 5, ,814 1 Does not include woody ornamentals, trees, shrubs, and sod. 2 Value of all crops grown with sales of $10,000 or more, combines the wholesale value of sales as reported by operations with $100,000 or more and an estimated value for operations with sales between $10,000 and $99,000. This is derived by multiplying the number of producers in each range of sales by the mid-point of the range. 3 Preliminary. 101
102 Florida Cut Cultivated Greens: Producers, Quantity Sold, and Value for Operations with $100,000+ Sales, Years Number of producers Quantity sold Value of all sales at wholesale 1 Leatherleaf ferns All other cut greens Leatherleaf ferns , , , , , , , , ,779 All other cut greens Leatherleaf ferns (1,000 bunches) (1,000 dollars) (3) (3) (3) (3) (3) (3) (3) (3) (3) All other cut greens 47,132 33,940 45,560 31,462 48,413 30,452 44,501 33,650 38,338 36,056 32,981 36,133 29,292 26,704 28,613 30,781 25,006 29, ,110 31,468 26,344 1 Equivalent wholesale value of all sales. 3 Bunches are not comparable as units differ depending on crop variety. 2 Preliminary. (3) Florida Foliage Plants: Producers and Value for Operations with $100,000+ Sales, Year Hanging baskets Potted plants Producers Value of all sales at wholesale 1 Producers Value of all sales at wholesale 1 (1,000 dollars) (1,000 dollars) , , , , , , , , , , , , , , , , , , , ,070 1 Equivalent wholesale value of all sales. 2 Preliminary. 102

103 Florida Potted Flowering Plants: Number of Producers, Number of Pots, Quantity Sold, and Value, Selected Crops Producers Number of pots less than 5 inches Quantity Sold Number of pots 5 inches or more Wholesale Price Less than 5 inches 5 inches or more Value of all sales at wholesale African Violets , Azaleas, Finished Florist (number) (1,000) (dollars per pot) ($1,000) ,004 1, ,853 1,672 Florist Chrysanthemums ,392 4,094 Easter Lilies (X) (X) ,693 1,805 Orchids ,156 1, ,889 17,955 Poinsettias ,027 3, ,682 12,771 Roses, Florist Spring Flowering Bulbs ,109 1, Other Flowering Plants ,454 1,633 8,325 5, ,580 31,744 1 Equivalent wholesale value of all sales 2 Quantity and price combined into pot size with greatest production to avoid disclosing data of individual operations. 3 Operations with $100,000 + Sales - Represents zero (X) Not applicable 103
104 Florida Annual Bedding/Garden Plants: Number of Producers, Quantity Sold, Price, and Value, Selected Crops Producers Number of pots less than 5 inches Quantity Sold Number of pots 5 inches or more Wholesale Price Less than 5 inches 5 inches or more Value of all sales at wholesale (number) (1,000) (dollars per pot) ($1,000) Begonias ,391 5, ,904 5,521 Geraniums / Veg Cuttings ,519 1,788 2,338 2, ,998 7,771 Geraniums from Seeds (3) (3) (3) (3) Impatiens, New Guinea ,779 3, ,675 5,556 Impatiens, Other ,154 4, , ,224 5,628 Marigolds ,717 2, ,460 2,717 Pansies / Violas ,600 1, ,304 2,346 Petunias ,756 2,697 1,629 1, ,217 4,848 Other Flowering & Foliar ,537 13,108 8,423 6, ,881 26,865 Vegetable Type Plants ,236 2, ,665 4,383 Selected Crops Unit Producers Quantity Sold Wholesale Price Value of all sales at wholesale (number) (1,000 units) (dollars per unit) ($1,000) Begonias... Baskets Impatiens, Other... Baskets Impatiens, New Guinea... Baskets Petunias... Baskets Other Flowering & Foliar... Baskets Other Flowering & Foliar... Flats ,154 1 Equivalent wholesale value of all sales. 2 Bedding plants for home use, excludes transplants for commercial production. 3 Quantity and price combined into pot size with greatest production to avoid disclosing data of individual operations 4 Operations with $100,000 + Sales (D) Withheld to avoid disclosing data of individual operations. 104
105 105

106 BEES AND HONEY HIGHLIGHTS Florida Honey Production There were 199,000 honey producing colonies in Florida in Colonies used only for pollination or from which honey was not harvested were not included. Honey production in 2012 from producers with five or more colonies was 12.7 million pounds, 16 percent above Florida ranked third in production behind North and South Dakota. The average honey yield was 64 pounds per colony, three pounds above Producers received an average of 181 cents per pound for the honey, up 13 cents per pound from the previous year. The value of Florida honey production in 2012 was $23.1 million, up from the 2011 value of $18.4 million. Florida Honey: Number of Colonies, Yield, Production, Price, Value, and Stocks, Year Honey producing colonies 1 Yield per colony Production Average price per pound 2 Value of production 3 Stocks December 15 4 (1,000 colonies) (pounds) (1,000 pounds) (cents) (1,000 dollars) (1,000 pounds) , ,681 1, , ,090 2, , ,834 2, , ,908 1, , ,246 1, , ,642 1, , ,415 1, , ,528 1, , , , ,052 1,274 1 Honey producing colonies are the maximum number of colonies from which honey was taken during the year. It is possible to take honey from colonies which did not survive the entire year. Producers with 5 3 Value of production is equal to production multiplied by average price per pound. Stocks held by producers. or more colonies. Colonies which produced honey in more than one State were counted in each State. 2 Average price per pound based on expanded sales. 106
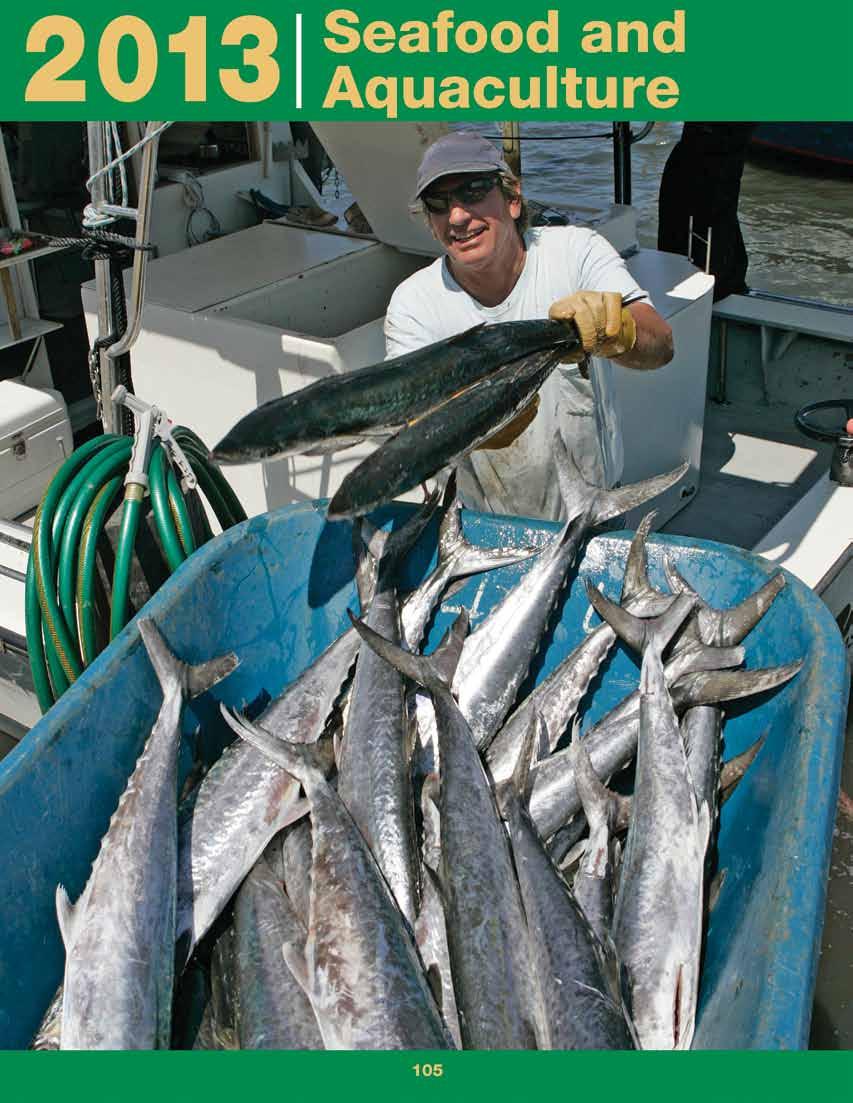
107 107

108 AQUACULTURE & SEAFOOD HIGHLIGHTS Florida aquaculture producers reported sales in 2012 of $69 million based upon a survey conducted for the Florida Department of Agriculture and Consumer Services, Division of Aquaculture. This survey was administered by the Florida Agricultural Statistics Service. Reported sales in 2012 were above those of $66 million reported in 2005, the last time this survey was conducted. There were 686 operations that reported being in business during 2012; of those, 404 operations reported appreciable sales. The operations without sales reflect either new operations which have not yet sold a product or operations in business that did not market any product in Florida aquaculturists produced animals or plants for ornamental, food or miscellaneous markets. Ornamental sales totaled $35.5 million and consisted of freshwater or marine animals and plants that included freshwater fish, crayfish or marine fish, corals, live rock, snails, and shrimp sold to the aquarium or water garden markets. Sales of aquaculture products for human consumption totaled $24.1 million and included freshwater or marine fish, clams, oysters, shrimp, prawns, alligators, and turtles. Florida Aquaculture: Value of Sales, 2012 and 2005 Item Value of Sales Operations with Sales (dollars) Ornamental Fish... 27,269,000 33,232, Mollusks... 11,889,000 10,694, Alligators... 7,995,000 4,070, Aquatic Plants... 5,327,000 8,360, Other Food Fish... 2,978,000 1,731, Tilapia... 1,227, , Catfish ,000 1,434, Live Rock , , All Other Aquaculture... 11,303,000 5,436,000 (NA) (NA) Total... 68,751,000 65,775, (NA) Not Available 108
109 Florida Aquaculture: Value of Sales by Category, 2001, 2003, 2005, and 2012 Year Total Ornamental Fish Aquatic Plants Mollusks Alligators Other (1,000 dollars) ,751 27,269 5,327 11,889 7,995 16, ,775 33,232 8,360 10,694 4,070 9, ,800 47,229 7,733 12,970 2,450 12, ,200 42,424 8,102 18,264 3,250 14,260 Florida Aquaculture: Value of Sales, 2012 Type Operations With Sales Value of Sales (dollars) Freshwater Ornamental Fish ,035,000 Egg Layers ,485,000 Live Bearers ,550,000 Marine Ornamental Fish ,234,000 Freshwater Ornamental Invertebrates ,000 Marine Ornamental Invertebrates ,439,000 Coral ,052,000 Live Rock ,000 Clams ,000 Other Marine Ornamental Invertebrates ,000 Food & Bait Fish ,595,000 Tilapia ,227,000 Catfish ,000 Other Food Fish ,978,000 Mollusks ,889,000 Hard Clam ,594,000 Other Mollusks ,000 Shrimp/Prawn/Crayfish ,603,000 Shrimp ,489,000 Crayfish ,000 Reptiles ,192,000 Alligator Live Animals ,412,000 Other Alligator Products ,583,000 Turtles and Turtle Products ,197,000 Aquatic Plants ,327,000 Aquarium Plants ,844,000 Other Aquatic Plants ,000 Total Reported Aquaculture Sales ,751,000 1 Includes shrimp, snails, and others. 4 Includes eggs, hides, and meat. 2 Includes bream, bass, trout, sturgeon, and others. 5 For water garden and wetlands restoration. 3 Includes sunray venus clams and oysters. 109
110 Florida Aquaculture: Water Acreage, Size of Operation, 2012 Water Acreage Operations Acres Percent Operations Percent Acres Under to to , to and up , Total ,
111 Florida Marine Landings Summary: Tropical Ornamentals ,2 ( Marine, Commercial) Species Total Numbers Total Trips Average Price Estimated Value Angelfish... 20,989 1, ,638 Barracuda Basses... 1, ,491 Batfish Bigeye Blennies... 3, ,371 Brotulas Butterflyfish... 2, ,758 Cardinalfish... 2, ,200 Catfish Clingfish Damselfish... 7, ,293 Drum... 2, ,520 Filefish... 1, ,483 Flounder Goatfish Gobies... 14, ,091 Groupers Grunts... 4, ,526 Hamlets ,251 Jacks... 1, ,203 Jawfish... 10, ,307 Lizardfish Mojarras Morays ,002 Parrotfish ,271 Porgies Puffers... 4, ,427 Rays And Skates ,476 Remoras Scorpionfish Seahorses... 17, ,965 Searobin ,032 Sharks ,822 Sheepshead Snappers Spadefish ,066 1 All 2012 Data is Preliminary --continued 2 Source: Florida Fish and Wildlife Conservation Commission 111
112 Florida Marine Landings Summary Tropical Ornamentals: Marine, Commercial ,2 (continued) Species Total Numbers Total Trips Average Price Estimated Value Squirrelfish ,342 Stargazers Surgeonfish... 3, ,474 Sweepers Toadfish Triggerfish Trumpetfish Trunkfish... 1, ,510 Wrasses... 8, ,344 Misc. Fish... 1, ,087 Total Finfish ,365 2, ,750 Anemones... 65, ,395 Anemones, Corallimorphs... 33, ,009 Zoanthids... 23, ,993 Bryozoa ,988 Chiton... 1, ,186 Clams... 1, ,955 Conchs... 68, ,591 Crabs... 2,362,790 2, ,439 Octocorals... 32, ,529 Jellyfish... 3, ,312 Lobsters ,087 Nudibranchs... 16, ,990 Octopus ,656 Oyster ,566 Polychaetes... 2, ,627 Sand Dollars... 1,210, ,802 Scallops... 19, ,275 Sea Cucumbers... 10, ,442 Shrimp... 1,459,782 1, ,043 Snails... 2,595,701 2, ,470 Sponges... 19, ,006 Starfish... 35, ,992 Tunicates... 3, ,969 Urchins... 46, ,818 Whelks... 2, ,908 Misc. Invertebrates... 3, ,369 1 All 2012 Data is Preliminary --continued 2 Source: Florida Fish and Wildlife Conservation Commission 112

113 Florida Marine Landings Summary Tropical Ornamentals: Marine, Commercial ,2 (continued) Species Total Numbers Total Trips Average Price Estimated Value Total Invertebrates... 8,774,090 4, ,061,787 Plants... 18, ,243 Total Plants... 18, ,000 Live Rock... 88, ,863 Live Sand... 5, ,509 Total Live Rock/Sand... 65, ,711 1 All 2012 Data is Preliminary 2 Source: Florida Fish and Wildlife Conservation Commission 113
114 Florida Annual Landings Summary: Marine, Commercial 1,2 Species Total Pounds Total Trips Average Dollar Value per Trip Estimated Value Amberjacks... 1,307,321 3, ,345,419 Bait fish... 1,378,994 1, ,007 Ballyhoo... 1,116, ,214 Blue Runner ,684 8, ,454 Bluefish ,506 6, ,159 Bumper, Atlantic... 27, ,296 Catfish... 9, ,982 Clams, Hard (wild only)... 56,151 3, ,266 Cobia ,487 3, ,011 Conch (Whelk, Helmet)... 2, ,202 Crab, Blue (hard)... 8,389,950 33, ,691,845 Crab, Blue (soft)... 75,351 2, ,279 Crab, Stone... 2,579,734 19, ,693,799 Croaker... 86,099 1, ,025 Dolphin ,505 2, ,652 Drum, Black... 30,861 1, ,527 Eels ,249 Flounders ,465 4, ,474 Goatfishes... 11, ,825 Grouper, Black... 68, ,355 Grouper, Gag ,443 3, ,529,606 Grouper, Other... 20, ,734 Grouper, Red... 3,493,418 4, ,006,901 Grouper, Scamp ,201 1, ,074 Grouper, Snowy , ,627 Grouper, Warsaw... 5, ,454 Grouper, Yellowedge , ,298,131 Grouper, Yellowfin ,107 Grunts ,611 3, ,536 Herring, Thread... 1,174, ,717 Hogfish... 45, ,175 Jack, Crevalle ,486 7, ,743 Jack, Mixed... 63, ,808 Jack, Other... 78,174 2, ,186 Kingfish (Whiting) ,583 2, ,864 Ladyfish... 1,127,822 2, ,758 Lobster, Spanish... 2, ,821 1 All 2012 data is Preliminary --continued 2 Source: Florida Fish and Wildlife Conservation Commission 114
115 Florida Annual Landings Summary: Marine, Commercial 1,2 Species Total Pounds Total Trips Average Dollar Value per Trip (continued) Estimated Value Lobster, Spiny... 5,764,633 17, ,568,331 Mackerel, King... 5,449,751 16, ,807,952 Mackerel, Spanish... 4,081,486 8, ,756,456 Menhaden , ,078 Misc. Food fish ,300 7, ,109 Misc Industrial fish... 1,030, ,153 Misc. Invertebrates... 2,327, ,233,072 Mojarra ,157 5, ,521 Mullet, Black... 8,466,401 21, ,818,014 Mullet, Black, roe... 3, ,180 Mullet, Silver ,425 1, ,482 Octopus... 23, ,248 Oysters... 2,210,316 36, ,474,490 Permit... 4, ,545 Pinfish ,339 2, ,137 Pompano ,657 5, ,996 Porgies ,705 2, ,782 Rays & Skates... 10, ,671 Sand Perch (Serranidae) Sardines, Scaled... 30, ,199 Sardines, Spanish... 2,010, ,127 Scad, bigeye (goggle eye) , ,102 Scad, round (cigarfish) , ,491 Sea Bass, Mixed ,327 1, ,567 Seatrout, Sand... 4, ,715 Seatrout, Silver... 7, ,898 Seatrout, Spotted... 52,896 1, ,944 Seatrout, Weakfish... 3, ,950 Shark , ,063 Shark Fins... 28, ,855 Sheepshead ,920 9, ,510 Shrimp, Bait... 1,558,878 16, ,165,792 Shrimp, Brown... 2,075,634 1, ,614,593 Shrimp, Other , ,862 Shrimp, Pink... 8,679,263 2, ,154,260 Shrimp, Rock... 1,840, ,575,023 Shrimp, Royal Red , ,827 Shrimp, White... 4,898,005 3, ,180,511 1 All 2012 Data is Preliminary --continued 2 Source: Florida Fish and Wildlife Conservation Commission 115
116 Florida Annual Landings Summary: Marine, Commercial 1,2 Species Total Pounds Total Trips Average Dollar Value per Trip (continued) Estimated Value Snapper, Grey (Mangrove) ,771 4, ,957 Snapper, Lane... 17,786 1, ,681 Snapper, Mixed Snapper, Mutton ,722 2, ,669 Snapper, Other... 31, ,067 Snapper, Red... 1,320,332 2, ,562,308 Snapper, Silk... 39, ,934 Snapper, Vermilion... 1,496,766 1, ,725,185 Snapper, Yellowtail... 1,693,661 5, ,397,293 Sponge (pieces) , ,451 Spot... 16, ,895 Squid... 41, ,536 Swordfish... 1,151,425 1, ,094,118 Tilapia (Nile Perch) , ,210 Tilefish (Golden) , ,252,717 Tilefish, Blueline (Gray)... 36, ,110 Triggerfish ,760 2, ,169 Tuna, Albacore... 80, ,072 Tuna, Bigeye , ,012,475 Tuna, Blackfin... 15, ,065 Tuna, Bluefin... 37, ,331 Tuna, Mixed Tuna, Skipjack... 1, ,047 Tuna, Yellowfin , ,735,669 Tunny, Little (Bonito) ,200 6, ,862 Wahoo... 31, ,700 1 All 2012 Data is Preliminary 2 Source: Florida Fish and Wildlife Conservation Commission 116
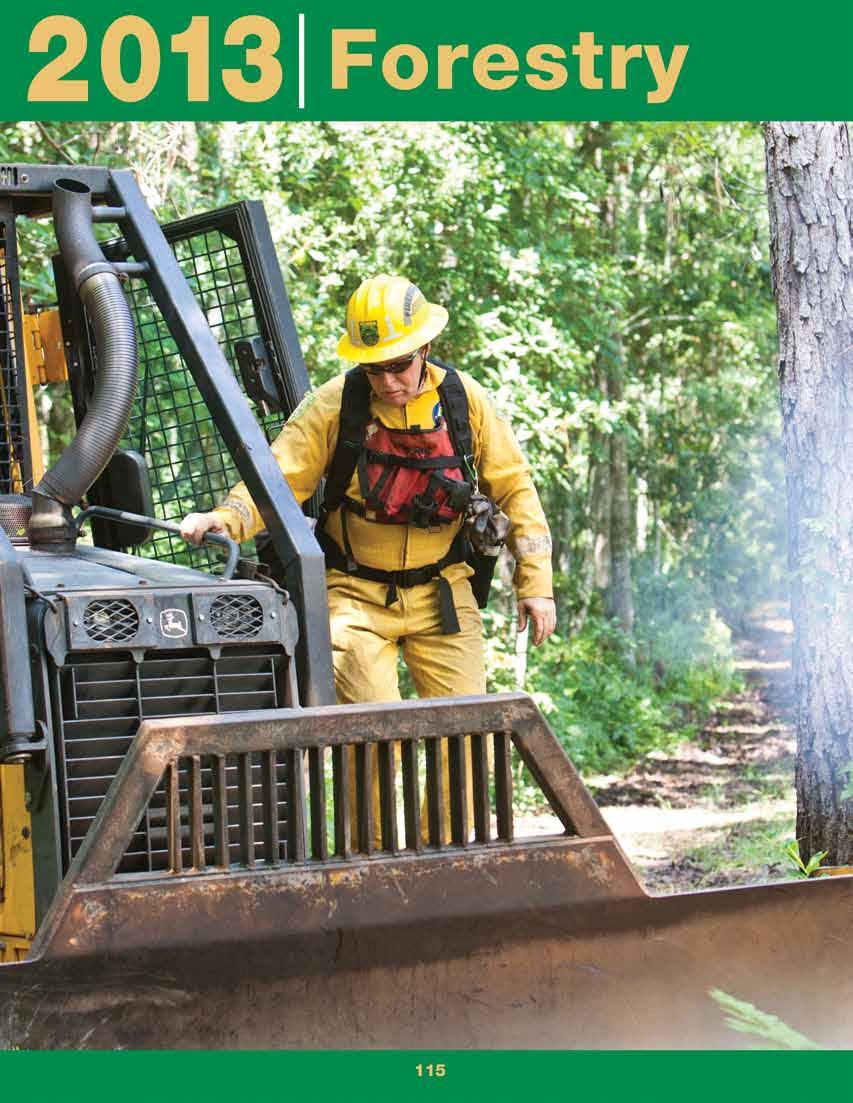
117 117
. Figure 1.")
118 FORESTRY HIGHLIGHTS Economic Output: Florida s nearly 16 million acres of timberlands supported economic activities which generated $13.95 billion in total output impacts in This was an 8% drop from 2010, but 3% more than in 2008 at the lowest point in the recent economic recession (Fig. 1). Figure 1. Economic impacts of forestry, wood and paper product manufacturing industries in Florida between 2001 and Employment: 2011 employment impacts were nearly 76,000 full and part-time jobs, which was 14,000 fewer jobs than in The 2011 employment in forestry and forest products industry represented a 17% increase over 2008 employment at the lowest point of the recession. Value Added: At $6.01 billion, value added impacts were also lower in 2011 than in 2010 by 17% (Fig. 1), but still 30% higher than in Compensation: The pulp and paper products industry supported 75% of income paid to the labor force employed in forestry and related industries in At 13%, forest management and logging was the next largest sector in terms of income paid out to workers in Secondary wood products sector generated 7% of income, while lumber, veneer and panels manufacturing paid the remaining 5% of wages and benefits in forestry-related occupations (Fig. 2). 118


119 Figure 2. Labor income impacts distribution among forestry, wood and paper product industry sectors in Florida, Export Value: At $5.15 billion in 2011, and similarly to other economic indicators, the export value of Florida s forest products to outof-state destinations dropped 7% since 2010 (Fig. 3). Figure 3. Export value of Florida s forest products to out-of-state destinations between 2001 and

120 Fiscal Impacts: In 2011, indirect business tax impacts of forestry and forest products industries in Florida were $401 million. Of that amount, $310 million was generated by pulp and paper sector, $64 million by forest tract management and logging activities, $16 million by lumber, veneer and panel manufacturing, and $11 million by secondary products manufacturing industries. Total other property income impacts, such as interests, rents, royalties and dividends, were $1.78 billion in The largest share again was generated by pulp and paper manufacturing at $1.52 billion. Forest tract management and logging activities generated $160 million, the secondary forest products sector $64 million, while lumber, veneer and panels manufacturing generated $41 million. Forest Ownership: Florida timberland ownership, which supports forest products industry is 71% private (65% non-industrial, and 6% forest industry) 15% state, 11% federal, 3% county and municipal (Fig. 4). That translates into 11.3 million acres in private ownerships, 2.4 million acres in state, 1.7 million acres in federal and 0.5 million acres in county and municipal. Figure 4. Florida timberland ownership by major ownership sectors,

121 Forest Distribution: Although forests cover about 50% of the state s land area, Florida s timberlands are located mostly north of Orlando (Fig. 5). In the northern half of the state most counties are at least 50% forested, whereas the peninsular Florida is forested 40% or less. Liberty County in northwest Florida is the most forested with timberlands covering more than 90% of its area. On the other hand, a number of counties in southeast Florida support less than 10% of timberland (Fig. 5). Figure 5. Florida timberlands as percentage of county area, Local Importance: In 2012, there were 58 primary wood using mills in Florida (see following table). The local economic importance of forests depends on a number of factors including proximity to markets. Florida Primary Wood Mills: Mills in Florida by Type and Number, 2012 Mill Type Number of Mills Total 58 Sawmill Mulch... 9 Pulp / Paper... 6 Chip-and Saw... 4 Post continued 121
 in proximity to timberland resources.")
122 Florida Primary Wood Mills: Mills in Florida by Type and Number, 2012 Mill Type (continued) Number of Mills Total 58 Pole... 3 Firewood... 2 Horse Bedding... 2 Plywood... 2 Chip... 1 Pellet... 1 Strand Board... 1 Veneer... 1 The primary wood using mills in Florida are located mostly in the northern part of the state (Fig. 6) in proximity to timberland resources. Depending on type and size, which dictates raw material needs, they have the biggest economic impact in a zone of 50 to 75 mile radius. This corresponds to an area from which they can purchase wood in the most economical way, providing income to local timberland owners. Figure 6. Florida primary wood processing facilities,
123 Florida Annual Harvest Removals: By Species Type of Growing-stock Trees at least 5 inches d.b.h., 2011 Species group Ownership group - Major Total Public Private (cubic feet) Total 510,153,212 48,478, ,674,980 Softwoods: Hardwoods: Longleaf and slash pine ,032,269 32,396, ,635,863 Loblolly and shortleaf pine ,212, , ,912,519 Other yellow pines... 25,577,734 13,908,518 11,669,217 Cypress... 12,632,390 28,349 12,604,042 Other eastern softwoods ,470 24, ,233 Select white oaks... 1,200,735-1,200,735 Other white oaks... 2,601, ,026 2,335,060 Other red oaks... 17,341,021 1,163,273 16,177,748 Hickory... 2,180,810-2,180,810 Soft maple... 2,120,123 89,077 2,031,046 Sweetgum... 5,261,810 16,395 5,245,415 Tupelo and blackgum... 9,477,566-9,477,566 Ash... 2,199,110-2,199,110 Yellow-poplar... 1,093,509-1,093,509 Other eastern soft hardwoods... 2,999, ,243 2,713,730 Other eastern hard hardwoods... 72,378-72,378 Source: Miles, P.D. Thu Sep 19 12:05:02 CDT Forest Inventory EVALIDator web-application version St. Paul, MN: U.S. Department of Agriculture, Forest Service, Northern Research Station. 123
124 Florida Output of Industrial Products: By Product and Species Group, 2009 and 2011 Product and Species Group Year Change Percent Change (thousand cubic feet) Saw logs Softwood , ,464-16, Hardwood... 1,864 2, Total , ,519-16, Veneer logs Softwood... 18,686 17,084-1, Hardwood... 1,256 1, Total... 19,942 18,377-1, Pulpwood Softwood , ,358 15, Hardwood... 16,029 13,884-2, Total , ,242 13, Other industrial 1 Softwood... 68,873 64,598-4, Hardwood ,586 1, Total... 69,775 67,184-2, All industrial Softwood , ,504-7, Hardwood... 20,051 19, Total , ,322-7, Includes composite panels, poles, posts, mulch, log homes, industrial fuelwood, and all other industrial products. Source: Bentley J.W., Cooper J.A. and Howell M Florida's Timber Industry - Timber Product Output and Use, Forest Inventory and Analysis Factsheet. Asheville, NC: US Department of Agriculture Forest Service, Southern Research Station. Conversion Factors 1 Wood Type Categories Saw Logs Veneer Logs Pulpwood cu ft = cu ft = Softwood 1 board ft 1 board ft 5.91 board ft = 5.95 board ft = cubic feet/cord 1 cubic foot 1 cubic foot cu ft = cu ft = Hardwood 1 board ft 1 board ft 5.88 board ft = 5.94 board ft = cubic feet/ cord 1 cubic foot 1 cubic foot 1 Conversion factors vary with stem size (d.b.h.) and species. The factors shown are for trees of average diameters removed in Florida during the latest survey period. 2 Cubic feet of solid wood per cord. Source: Bentley J.W., Cooper J.A. and Howell M Florida's Timber Industry - Timber Product Output and Use, Forest Inventory and Analysis Factsheet. Asheville, NC: US Department of Agriculture Forest Service, Southern Research Station. 124

125 References: IMPLAN software and Florida region data for 2011 (MIG, Inc.). Compiled by Alan W. Hodges, University of Florida, January 25, Miles, P.D. March 01, Forest Inventory EVALIDator web-application version St. Paul, MN: U.S. Department of Agriculture, Forest Service, Northern Research Station. [Available only on internet: Contact Information: Jarek Nowak, Forest Utilization Specialist Florida Forest Service, Florida Department of Agriculture and Consumer Services 3125 Conner Blvd, C-25 Tallahassee, FL Phone: ; Fax: *Disclaimer: The Florida Department of Agriculture and Consumer Services provides the data and materials on the following charts as is and without warranties of any kind either expressed or implied. The user assumes the entire risk related to their use of this information. 125
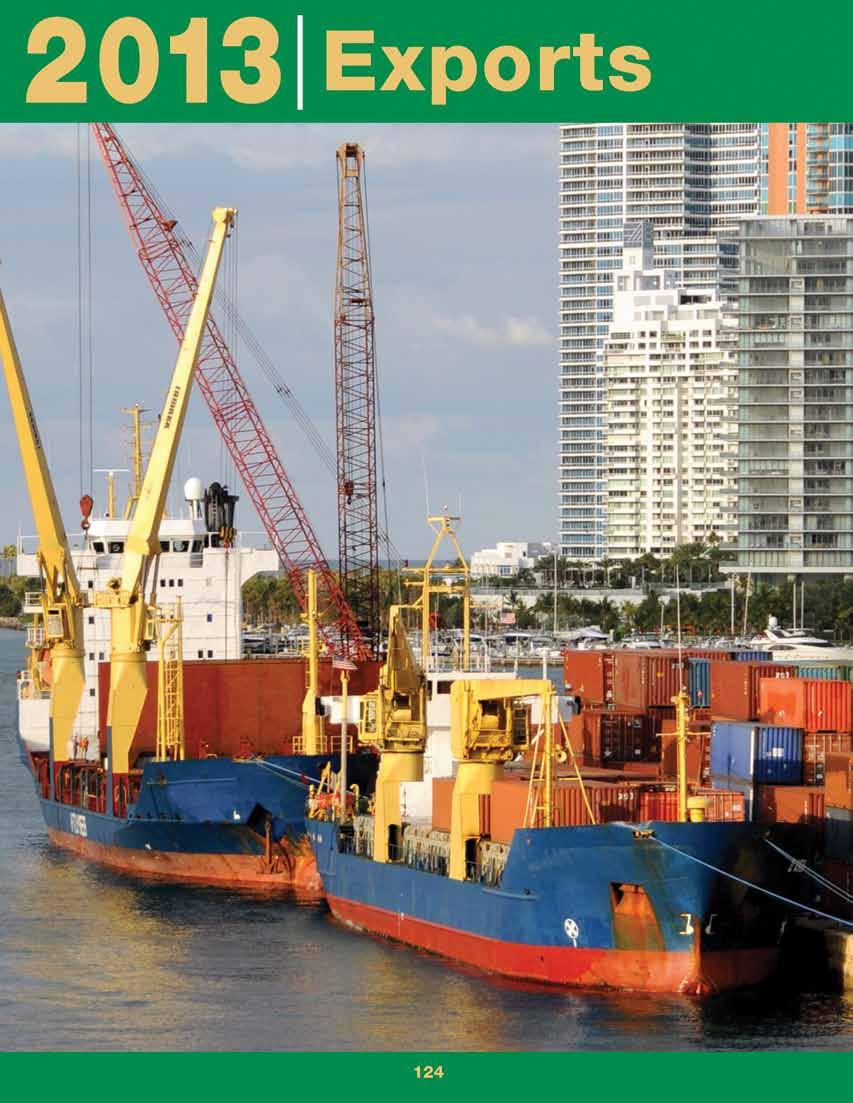
126 126
127 FLORIDA S SEAPORTS Port Canaveral Port Canaveral is currently home to seven year-round cruise ships from three major cruise lines. Cargo activity at Port Canaveral is expected to increase significantly with the continued growth of the 2.8 million-barrel Seaport Canaveral fuel tank farm and the further development of bulk cargo facilities to serve the central Florida market. Principal exports for the port include fresh citrus and single-strength juice, juice concentrates, automobiles and heavy equipment. Hinterland: The central and north Florida counties of Brevard, Polk, Indian River, Lake Okeechobee, Orange, Osceola, Seminole, Volusia and Southeast U.S. Port Citrus The effort behind Port Citrus is to establish a public port within Citrus County to grow the economic vitality and quality of life in the area. The concept behind Port Citrus is to take full advantage of a valuable asset: the Cross Florida Barge Canal. Port Everglades Port Everglades is one of the nation s leading container ports and south Florida s main seaport for receiving petroleum products including gasoline, jet fuel and alternative fuels. The total value of economic activity at Port Everglades in FY 2011 (latest data available) was approximately $15.3 billion. More than 160,000 Florida jobs are impacted by the port, including almost 11,400 people who work for companies that provide direct services to Port Everglades. Hinterland: Primarily southeastern Florida extending northward to a 24-county area (including Pasco, Polk, Osceola and Brevard), south Monroe, and west to the Gulf of Mexico. In trade with Latin America, the hinterland is the entire U.S. Port of Fernandina The Port of Fernandina provides terminal service to numerous pulp and paper producers located throughout Florida and the Southeast. The containerized commodities moving through the port include wood pulp, automobile and truck parts, steel products, chemicals, beverages, food stuff, machinery, consumer goods and building materials. Hinterland: The southeastern U.S. and gulf states; major metropolitan areas include Tampa, Orlando, Jacksonville, Atlanta and New Orleans. As the most westerly port on the East Coast, the Midwest and the Great Lakes region can also be served efficiently. Port of Fort Pierce St. Lucie County owns 20 acres at the port, adjacent to 67 acres owned privately, as well as 12 acres that house the privately owned Indian River Terminal. The port s privately-held facilities have served bulk, containerized and other general cargo traffic moving into the Bahamian and Caribbean islands. Principal imports, through the private terminals, have been aragonite and cement. Hinterland: St. Lucie, Indian River, Okeechobee, Highlands, Hendry, Glades and Martin counties. Port of Jacksonville The Jacksonville Port Authority (JAXPORT) is an independent agency responsible for the development of public seaport facilities in Jacksonville. It owns three cargo facilities and a cruise terminal, and according to a 2009 study, generates 65,000 jobs and more than $19 billion in annual economic impact for the north Florida region. Hinterland: Primarily defined as the U.S. Southeast and Midwest. Jacksonville s geographic location allows JAXPORT inbound cargo to reach 50 million consumers and 60 percent of the U.S. population within a 24-hour truck drive. 127
128 Port of Key West The Port of Key West includes cruise berths at Mallory Square, the Navy s Outer Mole Pier, and the privately owned Pier B at the Weston Resort. The port brings in almost a million total passengers per year resulting in a local business impact of approximately $85 million. The port also provides 1,260 direct and indirect jobs to the citizens of Key West and contributes 15 percent of the city s total tax revenue. Hinterland: U.S. cruise homeports, Florida west coast ferry ports, city of Key West and Monroe County. Port Manatee Port Manatee is a multi-purpose deepwater seaport on Tampa Bay serving bulk, breakbulk, container, heavy-lift/project and general cargo customers. Comprised of 1,100 acres, Port Manatee is supported by nearly 4,000 acres of land located just outside the port s gates. Hinterland: PortMiami Florida counties within a 100-mile radius including Lee, Charlotte, DeSoto, Sarasota, Hardee, Polk, Hillsborough, Highlands, Pasco, Hernando, Pinellas and Manatee, as well as the U.S. Southeast, eastern U.S. and Midwest/Chicago area. PortMiami has been recognized around the globe with the dual distinction of being the Cruise Capital of the World and the Cargo Gateway of the Americas. The port continues to be a powerful economic engine contributing more than $27 billion annually to the Florida economy and supporting more than 207,000 jobs. Hinterland: For east-west trade the hinterland extends from the south Florida counties of Miami-Dade, Broward, Monroe and Palm Beach throughout the state. For north-south trade it includes all of Florida and extends into the Southeast, Northeast and Midwest. Port of Palm Beach The Port of Palm Beach generates approximately 2,850 jobs in its community. The 160-acre port is located 80 miles north of the city of Miami and has a 300-foot wide inlet channel. The Port of Palm Beach is an important distribution center for commodities being shipped all over the world, and especially the Caribbean Basin. Operations include containerized, dry bulk, liquid bulk, breakbulk, roll on/roll off and heavy-lift/project cargoes. Hinterland: Palm Beach, Martin, St. Lucie, Okeechobee, Highlands, Glades, Hendry, Brevard, Indian River, Monroe, Miami-Dade, Broward, Hillsborough and Orange counties. Port Panama City Port Panama City handles more than 1.5 million tons of cargo per year including containerized cargo, copper cathodes, steel plate, steel coils, kraft paper, wood pellets and aggregates. The port provides essential support service for five major manufacturing companies, including two located on the port. Hinterland: Northwest Florida, Alabama, Georgia and Tennessee. Port of Pensacola From its early shipments of regionally harvested lumber, locally made bricks and sailing ship masts, to the locally manufactured paper and power plant components being moved today, the Port of Pensacola has always existed, at least in part, to serve local and regional business interests. Hinterland: Southeastern and Midwestern U.S. roughly bounded by the Great Lakes to the north, the Mississippi River to the west, the Gulf of Mexico to the south and the Atlantic Ocean to the east. Port of Port St. Joe Located in Gulf County, Florida, the Port of Port St. Joe offers a deepwater seaport with two separate bulkheads one featuring nearly 1,900 linear feet at the ship channel turning basin and the other offering nearly 900 linear feet on the Intracoastal Waterway. Hinterland: North Florida, Alabama and Georgia. 128

129 Port of St. Petersburg The Port of St. Petersburg, located on Tampa Bay, is exploring opportunities to attract mega yachts, research and other vessels, as well as to further enhance the benefits of a new Research and Development Center on the eastern end of the port. Hinterland: Port of Tampa Port users would come from other parts of Florida and from around the world as the port focuses on the mega yacht business sector. The Port of Tampa is largest of the Florida ports by tonnage and area. It is a vital energy products gateway to West Central Florida and an important global distribution point for fertilizer. The port accommodates a broad mix of bulk, breakbulk, roll on/roll off, neo-bulk and container cargo. Hinterland: Central Florida for energy, building, citrus and fertilizer products. As for container cargo, Florida, and through CSX, the U.S. Midwest and entire eastern seaboard. *Source: All above information on Florida s ports is available from the Florida Ports Council for more information please visit: 129
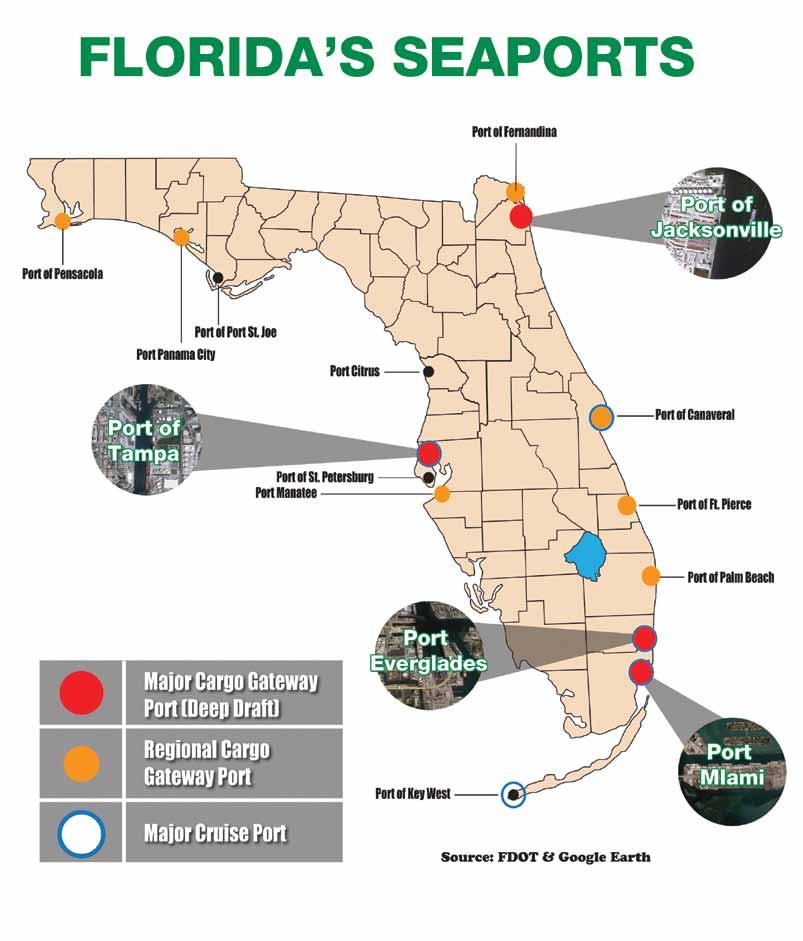
130 130
131 FLORIDA EXPORTS INFORMATION In 2012, Florida Ranked 7 th among the states in the United States with agricultural exports topping $4 billion, according to Euromonitor International. Florida Agricultural Exports 1 Leading Exports Ranked by Year 2012 Commodity Group Year (dollars) 1. Meat, Fresh & Frozen ,533, ,339, ,746, ,760, Vegetables, Fruit, Juices ,616, ,739, ,271, ,115, Edible Fruits, Nuts ,474, ,033, ,792, ,383, Edible Vegetables ,060, ,386, ,979, ,593, Fish, Crustaceans ,850, ,393, ,515, ,806, Dairy Products ,401, ,351, ,490, ,319, Prepared Meat and Fish... 70,587,086 79,289,504 94,669, ,226, Live Trees & Plants ,560, ,391, ,759,295 77,051, Sugars... 51,705,417 50,181,510 60,581,225 75,545, Live animals... 52,272,578 48,659,293 43,304,512 36,431,889 1 Source: Euromonitor International Florida s Agriculture Importers 1 Leading Importers Ranked by Year 2012 Importers World 2,917,705,395 3,149,573,825 3,927,611,416 4,041,350, Canada ,259, ,794, ,104, ,694, Netherlands ,875, ,161, ,328, ,922, Bahamas ,487, ,044, ,746, ,784, Dominican Republic ,160, ,079, ,291, ,337, Panama... 78,431,039 99,506, ,169, ,422,502 1 Source: Euromonitor International 131
132 170 countries and territories imported Florida agricultural commodities in $4,000 Florida Agricultural Exports $3,928 $4,041 Millions US Dollars $3,500 $3,000 $2,500 $2,000 $1,863 $1,959 $2,056 $2,255 $2,719 $3,071 $2,918 $3,150 $1, Number of Foreign Importers Florida Around the World 132
133 Florida Agriculture CONTACTS Table of Contents Florida Agricultural Groups Aquaculture Cattle Citrus Dairy Education Equine Fruits, Vegetables and Nuts Forestry Horticultural Miscellaneous Farm Credit Associations Florida Cooperative Extension Service and Extension IFAS/UF Office Locations Florida Fairs and Expositions Florida Farm Bureau Offices USDA Service Centers Florida Department of Agriculture and Consumer Services Divisions and Offices Agriculture Statistics and Other Information
134 Florida Agriculture Groups Important users of agricultural statistics are farm organizations, agribusiness and transportation firms, state and national policy makers and foreign buyers of agricultural products. These vital Florida Agriculture Groups provide the majority of the data collected through a broad program of sample surveys throughout the year. Aquaculture Florida Aquatic Plant Growers Association Florida Aquatic Nurseries, Inc. 700 South Flamingo Road Davie, Florida Phone: (954) Fax: (954) Website: Aquatic Plants of Florida, Inc. Habitat Restoration & Farm Direct Native Plants 8120 Blaikie Court Sarasota, Florida Phone: (941) Fax: (941) Website: Florida Aquaculture Association Post Office Box 1519 Winter Haven, Florida Phone: (863) Fax: (863) DBoozer1@aol.com Website: Florida Tropical Fish Farms Association Post Office Box 1519 Winter Haven, Florida Phone: (863) Fax: (863) flassn@aol.com Website: Southeastern Fisheries Association, Inc B Thomasville Road Tallahassee, Florida Phone: (850) Fax: (850) Website: Cattle Florida Angus Association 8448 S.E. 3rd Court Ocala, Florida Phone: (352) Website: Florida Association of Livestock Markets Post Office Box Kissimmee, Florida Phone: (407) Fax: (407) fbcpmg@aol.com Florida Barzona Breeders Association 8485 Croom Rital Road Brooksville, Florida Phone: (352) Website: Florida Braford Breeders Association Adams Ranch Post Office Box Fort Pierce, Florida Phone: (772) Fax: (772) Website: Florida Brahman Association 6001 Canoe Creek Road Saint Cloud, Florida Phone: (407) info@floridabrahman.org Website: 134
135 Florida Cattlemen s Association Physical Address: 800 Shakerag Road Kissimmee, Florida Mailing Address: Post Office Box Kissimmee, Florida Phone: (407) Fax: (407) Website: Florida Cracker Cattle Association Florida Department of Agriculture and Consumer Services Division of Animal Industry 407 South Calhoun Street Mayo Building, Room 327 Tallahassee, Florida Phone: (850) Fax: (850) Stephen.Monroe@freshfromflorida.com Florida Limousin Breeders Association st Street Fellsmere, Florida Phone: (772) Florida Red Brangus Association Northwest 142 Ave. High Springs, Florida Phone: (352) Website: Florida Santa Gertrudis Association Terrell Farms Road Callahan, Florida Hilda Edenfield Phone: (850) National Cattlemen s Beef Association Headquarters 9110 East Nichols Avenue, Suite 300 Centennial, Colorado Phone: (303) Fax: (303) Website: National Cattlemen s Beef Association Legislative Issues Branch 1301 Pennsylvania Avenue North West, Suite 300 Washington, D.C Phone: (202) Fax: (202) West Florida Livestock Association 2140 West Jefferson Street Quincy, Florida Phone: (850) Fax: (850) gadsden@ufl.edu Citrus Citrus Administrative Committee Post Office Box Lakeland, Florida Phone: (863) Fax: (863) info@citrusadministrativecommittee.org Website: Florida Citrus Commission P.O. Box 9010 Bartow, Florida Phone: (863) Florida Citrus Mutual Post Office Box 89 Lakeland, Florida Phone: (863) Fax: (863) info@flcitrusmutual.com Website: Florida Citrus Packers Post Office Box 1113 Lakeland, Florida Phone: (863) Fax: (863)
136 Florida Citrus Nurserymen s Association IFAS Southwest Center 2686 State Road 29 N Immokalee, Florida Florida Citrus Processors Association 1611 Harden Blvd. Lakeland, Florida Phone: (863) Fax: (863) Website: Florida Department of Citrus Scientific Research 700 Experiment Station Road Lake Alfred, Florida Phone: (863) Fax: (863) Florida Department of Citrus Mailing Address: Post Office Box 9010 Bartow, Florida Physical Address: Bob Crawford Agricultural Center 605 E. Main Street Bartow, Florida Phone: (863) Fax: FLA-CITRUS Florida Gift Fruit Shippers Association 5500 West Concord Avenue Orlando, Florida Phone: (407) Fax: (407) info@fgfsa.com Website: Gulf Citrus Growers Association Palm Beach Blvd., Suite 202 Fort Myers, Florida Phone: (239) Fax: (239) Website: Haines City Citrus Growers Association #8 Railroad Avenue Post Office Box 337 Haines City, Florida Phone: (863) Website: Highlands County Citrus Growers Association 6419 US 27 South Sebring, Florida Phone: (863) Fax: (863) feedback@hccga.com Website: Indian River Citrus League th Street Vero Beach, Florida Phone: (772) Fax: (772) info@ircitrusleague.org Website: Peace River Valley Citrus Growers Association 10 East Oak Street, Suite B Arcadia, Florida Phone: (863) Fax: (863) oj@prvcitrus.org Website: Showcase of Citrus 5010 Highway 27 Clermont, Florida Phone: (352) Website: Winter Garden Citrus Growers Association Mailing Address: Post Office Box Winter Garden, Florida Physical Address: 75 2nd Street Winter Garden, Florida Phone: (407)
137 Dairy Ag-Ad Agency, Inc. 166 Lookout Place, Suite 101 Maitland, Florida Phone: (407) Fax: (407) American Dairy Goat Association Post Office Box 865 Spindale, North Carolina Phone: (828) Fax: (828) Website: Florida Dairy Farmers, Inc. 166 Lookout Place, Suite 100 Maitland, Florida Phone: (407) Fax: (407) Website: Florida Dairy Goat Association Post Office Box 45 Lamont, Florida Website: Florida Dairy Products Association 2834 Remington Green Circle Suite 101 Tallahassee, Florida Phone: (850) Fax: (850) Website: Southeast Milk, Inc South East County Highway 484 Belleview, Florida Phone: Fax: (352) Website: Sunbelt Milk Producers, Inc st Road McAlpin, Florida Education Ag Institute of Florida Post Office Box Maitland, Florida Website: Florida Ag in the Classroom, Inc. Post Office Box Gainesville, Florida Phone: (352) Fax: (352) Website: Florida A&M University Agricultural Sciences 306 South Perry Paige Building Tallahassee, Florida Phone: (850) Fax: (850) Florida Cooperative Extension Service University Of Florida Institute of Food and Agricultural Sciences Post Office Box Gainesville, Florida Phone: (352) Fax: (352) Website: Florida 4-H Youth Development University of Florida 3101 McCarty Hall B Post Office Box Gainesville, Florida Phone: (352) Fax: (352) fourh@ifas.ufl.edu Website: 137
138 Florida FFA Association 5700 SW 34th Street, Suite 106 Gainesville, Florida Phone: (352) Fax: (352) Website: Florida FFA Leadership Training Center 5000 Firetower Road Haines City, Florida Phone: (863) Fax: (863) Website: Wedgworth Leadership Institute for Agriculture and Natural Resources Post Office Box Bryant Hall University of Florida Gainesville, Florida Phone: (352) Fax: (352) Website: College of Agricultural and Life Sciences (CALS) Post Office Box Gainesville, Florida Phone: (352) Website: Equine Florida Foxtrotter Association Post Office Box 3695 Belleview, Florida Phone: (352) Website: Florida Thoroughbred Breeders and Owners Associations 801 South West 60th Avenue Ocala, Florida Phone: (352) Fax: (352) Website: Florida Quarter Horse Association Post Office Box 325 Laurel, Florida Phone: (941) Fax: (941) Website: Florida Quarter Horse Racing Association 9085 Magnolia Hill Drive Tallahassee, Florida Phone: (850) Website: The Florida Cracker Horse Association 2992 Lake Bradford Road South Tallahassee, Florida Phone: (850) Website: Florida Morgan Horse Association th Street E. Palmetto, Florida Rich Davis Phone: (727) Website: The Sunshine State Horse Council, Inc. Post Office Box 6663 Brandon, Florida Phone: (813) Website: Paso Fino Horse Association, Inc. Post Office Box Miami, Florida Phone: (305) Website: Florida Standardbred Breeders and Owners Association 1800 South West 3rd Street Pompano Beach, Florida Phone: (954) Fax: (954) Website: 138
139 Flordia Paint Horse Club South East County Road 763 Arcadia, Florida Phone: (863) Website: Florida Palomino Exhibitors Association Post Office Box 337 Sumterville, Florida Phone: (352) Website: Florida Reining Horse Association Post Office Box Ocala, Florida Website: Florida Fruit, Vegetable and Nuts Florida Avocado Administrative Committee Post Office Box Homestead, Florida Phone: (305) Fax: (305) Florida Blueberry Growers Association Post Office Box 646 Bartow, Florida Phone: (863) Website: Florida Fruit and Vegetable Association Post Office Box Trafalgar Court, Suite 200 Maitland, Florida Phone: (321) Fax: (321) Website: Florida Grape Growers Association 111 Yelvington Road, Suite 1 East Palatka, Florida Phone: (386) Fax: (386) Website: Florida Organic Growers and Consumers, Inc. Post Office Box Gainesville, Florida Phone: (352) Fax: (352) Website: Florida Peanut Producers Association 2741 Pennsylvania Avenue, Suite 1 Marianna, Florida Phone: (850) Fax: (850) Website: Florida Strawberry Growers Association Lewis Gallagher Road Dover, Florida Phone: (813) Fax: (813) Website: Florida Sugarcane League Post Office Drawer 1208 Clewiston, Florida Phone: (863) Fax: (863) Florida Sweet Corn Council Post Office Box Maitland, Florida Phone: (321) Fax: (321) Website: Florida Tomato Committee 800 Trafalgar Court, Suite 300 Maitland, Florida Phone: (407) Fax: (407) Website: Florida Watermelon Association 1255 North 15th Street, Unit 7 Immokalee, Florida Phone: (239) Fax: (239) patty@flfwa.com Website: 139
140 Gadsden County Tomato Growers Association 2140 West Jefferson Street Quincy, Florida Phone: (850) Fax: (850) National Watermelon Promotional Board 3361 Rouse Road, Suite 150 Orlando, Florida Toll Free: Phone: (407) Fax: (407) Website: Peanut Advisory Council US Highway 139 O Brien, Florida Phone: (386) Quincy Tomato Growers Exchange, Inc. Post Office Box Maitland, Florida Phone: (321) Fax: (321) Sugarcane Growers Cooperative Post Office Box 666 Belle Glade, Florida Phone: (561) Fax: (561) info@scgc.org Website: Tropical Fruit Advisory Council and Tropical Fruit Growers of South Florida Southwest 248th Street Homestead, Florida Phone: (305) Website: Forestry Florida Christmas Tree Association 443 Cody Drive Orange Park, Florida Phone: (904) Website: Florida Forestry Association Post Office Box 1696 Tallahassee, Florida Phone: (850) Fax: (850) info@forestfla.org Website: Florida Society of American Foresters 3890 North Longvalley Road Hernando, Florida Phone: (863) Fax: (352) erich@nrpsforesters.com Website: Southeastern Wood Producers Association, Inc. Post Office Box 9 Hilliard, Florida Phone: (904) Fax: (904) Website: Southern Pine Inspection Bureau Post Office Box Pensacola, Florida Phone: (850) Fax: (850) Website: Horticultural Association of Florida Native Nurseries Post Office Box 972 Melbourne, Florida Phone: (321) Fax: (815) Website: Florida Federation of Garden Clubs 1400 South Denning Drive Winter Park, Florida Phone: (407) Fax: (407) FFGC@earthlink.net Website: 140
141 Florida Foundation Seed Producers, Inc. Post Office Box Gainesville, Florida Phone: (850) Fax: (850) Website: Florida Nursery, Growers and Landscape Association (Florida Citrus Nurserymen s Association is now part of FNGLA) 1533 Park Center Drive Orlando, Florida Phone: (407) Fax: (407) info@fngla.org Website: Florida State Horticultural Society, Inc. Citrus Research and Education Center 700 Experiment Station Road Lake Alfred, Florida Phone: (863) Fax: (703) fshs@crec.ifas.ufl.edu Website: Florida Turfgrass Association 120 East Pine Street, Suite 1 Lakeland, Florida Phone: (800) Website: Tampa Bay Wholesale Growers Association 2404 Airport Road Plant City, Florida Phone: (813) Website: Wildflower Seed and Plant Growers Association, Inc. Post Office Box 776 Crescent City, Florida Phone: (352) Website: Miscellaneous Animal and Plant Health Inspection Services, USDA-Veterinary Services 8100 North West 15th Place Gainesville, Florida Phone: (352) Fax: (352) Website: Florida Agricultural Advisory Council The Capitol, LL28 Tallahassee, Florida Phone: (850) Fax: (850) Florida Agricultural Aviation Association 2720 Sneed Road Fort Pierce, Florida Phone: (772) Fax: (772) Florida Farm Bureau Marketing Division 7705 US Highway 441 Leesburg, Florida Phone: (352) Fax: (352) Website: Florida Feed Association Post Office Box Tampa, Florida Phone: (813) Fax: (813) robbieg@mannapro.com Website: Florida Fertilizer and Agrichemical Association 411 East Orange Street Lakeland, Florida Phone: (863) Fax: (863) Website: 141
142 Florida Mosquito Control Association Landing Place North Palm Beach, Florida Phone: (855) Website: Florida Pest Management Association 6882 Edgewater Commerce Parkway Orlando, Florida Phone: (407) Fax: (407) Website: Florida Petroleum Marketers Association 209 Office Plaza Drive Tallahassee, Florida Phone: (850) Fax: (850) Website: Florida Pork Improvement Group Post Office Box Gainesville, Florida Phone: (352) Fax: (352) Florida Poultry Federation 1625 Summit Lake Drive, Suite 300 Tallahassee, Florida Phone: (850) Fax: (850) Florida Propane Gas Association Post Office Box Tallahassee, Florida Phone: (850) Fax: (850) Website: Florida Retail Federation 227 South Adams Street Tallahassee, Florida Phone: (888) Fax: (850) Website: Florida State Beekeepers Association 5002 North West 64th Lane Gainesville, Florida Website: Florida State Grange th Avenue East Palmetto, Florida Phone: (941) Florida Association of Wholesale Distributors, Inc. Post Office Box 3739 Lakeland, Florida Phone: (863) Fax: (863) Website: Florida Trucking Association 350 East College Avenue Tallahassee, Florida Phone: (850) Fax: (850) Website: Florida Veterinary Medical Association 7207 Monetary Drive Orlando, Florida Phone: (407) Fax: (407) Website: Meat Sheep Alliance of Florida 7112 County Road 214 Melrose, Florida Website: The Mosaic Company Circa Crossing Drive Lithia, Florida
143 Perennial Peanut Producers Association Post Office Box 352 Madison, Florida Phone: (850) Website: Southeastern Meat Association Post Office Box Oviedo, Florida Phone: (407) Website: Viticulture Advisory Council US Highway 27 North Clermont, Florida Phone: (352) Fax: (352) Farm Credit Associations Part of the nationwide Farm Credit system, created by Congress in 1916 to provide rural America with a dependable source of funding for agriculture and agriculture-related enterprises. Farm Credit of Central Florida 115 South Missouri Avenue, Suite 400 Lakeland, Florida Phone: (863) Fax: (863) marketing@farmcreditcfl.com Website: Farm Credit of Florida Post Office Box West Palm Beach, Florida Phone: (561) (800) Fax: (561) Website: Farm Credit of Northwest Florida Post Office Box 7000 Marianna, Florida Phone: (850) Fax: (850) info@farmcredit-fl.com Website: Florida Cooperative Extension Service and Extension IFAS/UF Office Locations Extension service is a partnership between state, federal, and county governments to provide scientific knowledge and expertise to the public. The University of Florida (UF), together with Florida A&M University (FAMU), administers the Florida Cooperative Extension Service. At the University of Florida, Extension service is located in the Institute of Food and Agricultural Sciences (IFAS), along with the College of Agricultural and Life Sciences (CALS) and the Florida Agricultural Research and Education Center, and is called UF/IFAS Extension. UF/IFAS Extension encompasses thousands of Extension faculty members, scientists, educators, administrative staff, and volunteers, all working to provide solutions for your life. is the web site of University of Florida Extension Service. You can explore topics in lawn and garden care, family life and consumer choices, agriculture, community development, the environment, and youth development. Above all, our site is focused on getting you timely and relevant solutions for improving your life. 143
144 Florida Cooperative Extension Service State Office (Florida) University of Florida Post Office Box Gainesville, Florida Phone: (352) Fax: (352) Alachua County Extension Office 2800 North East 39th Avenue Gainesville, Florida Phone: (352) Website: Baker County Extension Office 1025 West Macclenny Avenue Macclenny, Florida Phone: (904) Website: Bay County Extension Office Bay County Extension 2728 E. 14th Street Panama City, Florida Phone: (850) Fax: (850) Website: Bradford County Cooperative Extension Service 2266 North Temple Avenue Starke, Florida Phone: (904) (904) Website: Brevard County Extension Office 3695 Lake Drive Cocoa, Florida Phone: (321) Fax: (321) Website: Broward County Extension Office 3245 College Avenue Davie, Florida Phone: (954) Fax: (954) Website: Calhoun County Extension Office Central Avenue East, Suite 1 Blountstown, Florida Phone: (850) Fax: (850) calhoun@mail.ifas.ufl.edu Website: Charlotte County Extension Office Harbor View Road, Suite 3 Port Charlotte, Florida Phone: (941) Fax: (941) Website: Citrus County Extension Office 3650 West Sovereign Path, Suite 1 Lecanto, Florida Phone: (352) Fax: (352) extension@bocc.citrus.fl.us Website: Clay County Extension Office 2463 State Road 16 West Green Cove Springs, Florida Phone: (904) (904) Fax: (904) clay@ifas.ufl.edu Website: Collier County Extension Office Immokalee Road Naples, Florida Phone: (239) collier@ifas.ufl.edu Website: 144
145 Columbia County Extension Office 164 South West Mary Ethel Lane Lake City, Florida Phone: (386) Fax: (386) Website: DeSoto County Extension Office 2150 North East Roan Street Arcadia, Florida Phone: (863) Fax: (863) Website: Dixie County Extension Office 99 North East 121st Street Cross City, Florida Phone: (352) Fax: (352) Website: Duval County Extension Office 1010 North McDuff Avenue Jacksonville, Florida Phone: (904) Website: Escambia County Extension Office 3740 Stefani Road Cantonment, Florida Phone: (850) Fax: (850) Website: Flagler County Extension Office 150 Sawgrass Road Bunnell, Florida Phone: (386) Fax: (386) Website: aspx?nid=110 Franklin County Extension Office 66 Fourth Street Apalachicola, Florida Phone: (850) Fax: (850) Website: Gadsden County Extension Office 2140 West Jefferson Street Quincy, Florida Phone: (850) Fax: (850) Website: Gilchrist County Extension Office 125 East Wade Street Trenton, Florida Phone: (352) Fax: (352) Website: Glades County Extension Office 900 US Highway 27 SW Moore Haven, Florida Phone: (863) Fax: (863) Website: Gulf County Extension Office 200 North 2nd Street Wewahitchka, Florida Phone: (850) Fax: (850) Website: Hamilton County Extension Office 1143 North West US Highway 41 Jasper, Florida Phone: (386) Fax: (386) Website: 145
146 Hardee County Extension Office 507 Civic Center Drive Wauchula, Florida Phone: (863) Fax: (863) Website: Hendry County Extension Office 1085 Pratt Boulevard LaBelle, Florida Phone: (863) (863) Fax: (863) Website: Hernando County Extension Office 1653 Blaise Drive Brooksville, Florida Phone: (352) Website: Highlands County Extension Office 4509 George Boulevard Sebring, Florida Phone: (863) Fax: (863) Website: Hillsborough County Extension Office 5339 South CR 579 Seffner, Florida Phone: (813) Fax: (813) Website: Holmes County Extension Office 1169 East Highway 90 Bonifay, Florida Phone: (850) Fax: (850) Website: Indian River County Extension Office th Place, Suite D Vero Beach, Florida Phone: (772) Fax: (772) indian@ifas.ufl.edu Website: Jackson County Extension Office 2741 Pennsylvania Avenue, Suite 3 Marianna, Florida Phone: (850) Fax: (850) Jackson@ifas.ufl.edu Website: Jefferson County Extension Office 2729 West Washington Street Monticello, Florida Phone: (850) Fax: (850) jefferson@mail.ifas.ufl.edu Website: Lafayette County Extension Office 176 South West Community Circle, Suite D Mayo, Florida Phone: (386) Fax: (386) domoore@ufl.edu Website: Lake County Extension Office 1951 Woodlea Road Tavares, Florida Phone: (352) Fax: (352) lake@ufl.edu Website: Lee County Extension Office 3406 Palm Beach Boulevard Fort Myers, Florida Phone: (239) Fax: (239) lee@ifas.ufl.edu Website: 146
147 Leon County Extension Office 615 Paul Russell Road Tallahassee, Florida Phone: (850) Fax: (850) Website: Levy County Extension Office 625 North Hathaway Avenue, Alt. 27 Bronson, Florida Phone: (352) Fax: (352) Website: Liberty County Extension Office North West Theo Jacobs Way Bristol, Florida Phone: (850) Website: Madison County Extension Office 184 College Loop Madison, Florida Phone: (850) Fax: (850) Website: Manatee County Extension Office th Street West Palmetto, Florida Phone: (941) Fax: (941) Website: Marion County Extension Office 2232 North East Jacksonville Road Ocala, Florida Phone: (352) Website: Martin County Extension Office 2614 South East Dixie Highway Stuart, Florida Phone: (772) Fax: (772) Website: Miami-Dade County Extension Office South West 288th Street Homestead, Florida Phone: (305) Fax: (305) Website: Monroe County Extension Office 1100 Simonton Street, # Key West, Florida Phone: (305) Key West Fax: (305) Key Largo Fax: (305) monroe@ifas.ufl.edu Website: Nassau County Extension Office US Highway 1 Callahan, Florida Phone: (904) Fax: (904) nassau@ifas.ufl.edu Website: Okaloosa County Extension Office 3098 Airport Road Crestview, Florida Phone: (850) Fax: (850) Website: Okeechobee County Extension Office 458 Highway 98 North Okeechobee, Florida Phone: (863) Fax: (863) okeechobee@ifas.ufl.edu Website: 147
148 Orange County Extension Office 6021 South Conway Road Orlando, Florida Phone: (407) Fax: (407) Website: Osceola County Extension Office Osceola Heritage Park 1921 Kissimmee Valley Lane Kissimmee, Florida Phone: (321) Website: Palm Beach County Extension Office 559 North Military Trail West Palm Beach, Florida Phone: (561) Website: Pasco County Extension Office Pasco County Fairgrounds State Road 52 Dade City, Florida Phone: (352) (800) Fax: (352) Website: Pinellas County Extension Office Ulmerton Road Largo, Florida Phone: (727) Website: Polk County Extension Office 1702 Highway South Bartow, Florida Phone: (863) Fax: (863) Website: Putnam County Extension Office 111 Yelvington Road, Suite 1 East Palatka, Florida Phone: (386) Fax: (386) putnam@ifas.ufl.edu Website: Saint Johns County Extension County 3125 Agricultural Center Drive St. Augustine, Florida Phone: (904) stjohns@ifas.ufl.edu Website: Saint Lucie County Extension Office 8400 Picos Road Suite 101 Fort Pierce, Florida Phone: (772) Fax: (772) stlucie@ifas.ufl.edu Website: Santa Rosa County Extension Office 6263 Dogwood Drive Milton, Florida Phone: (850) (850) Fax: (850) santarosa@ifas.ufl.edu Website: Sarasota County Extension Office 6700 Clark Road, Twin Lakes Park Sarasota, Florida Phone: (941) Website: Seminole County Extension Office 250 West County Home Road Sanford, Florida Phone: (407) Website: 148
149 Seminole Tribe of Florida Reservation Road Okeechobee, Florida Phone: (954) Fax: (800) Website: Sumter County Extension Office 7620 State Road 471, Suite 2 Bushnell, Florida Phone: (352) Fax: (352) sumter@ifas.ufl.edu Website: Suwannee County Extension Office th Street South West Live Oak, Florida Phone: (386) Fax: (386) suwannee@ifas.ufl.edu Website: Taylor County Extension Office 203 Forest Park Drive Perry, Florida Phone: (850) Fax: (850) megharley@ufl.edu Website: Union County Extension Office 25 North East 1st Street Lake Butler, Florida Phone: (386) Fax: (386) union@ifas.ufl.edu Website: Volusia County Extension Office Volusia County Agricultural Center 3100 East New York Avenue DeLand, Florida Phone: (386) Fax: (386) dgriffis@co.volusia.fl.us Website: Wakulla County Extension Office 84 Cedar Avenue Crawfordville, Florida Phone: (850) Fax: (850) sswenson@ufl.edu or cathy52@ufl.edu Website: Walton County Extension Office 732 North 9th Street DeFuniak Springs, Florida Phone: (850) Fax: (850) tdbyrd@ufl.edu Website: Washington County Extension Office Washington County Agricultural Center 1424 Jackson Avenue (Hwy 90), Suite A Chipley, Florida Phone: (850) (850) Fax: (850) washington@ifas.ufl.edu Website: Florida Fairs and Expositions Please contact each fair directly for information regarding tickets, entertainment or vendor services. Baker County Fair Post Office Box 492 Macclenny, Florida Phone: (904) Fax: (904) Website: Bradford County Fair 2300 North Temple Avenue Starke, Florida Phone: (904) Fax: (904) Website: 149
150 Brevard County Fair 3695 Lake Drive Cocoa, Florida Phone: (321) Ext. 238 Fax: (321) Website: Broward County Fair 3389 Sheridan Street, Suite 411 Hollywood, Florida Phone: (954) Fax: (954) Website: Central Florida Fair 4603 West Colonial Drive Orlando, Florida Phone: (407) Fax: (407) Website: Central Panhandle Fair Post Office Box Panama City, Florida Phone: (850) Fax: (850) Chalo Nitka Festival; Glades County Youth and Livestock Show Post Office Box 1003 Moore Haven, Florida Phone: (863) Fax: (863) Website: Charlotte County Fair 2333 El Jobean Road Port Charlotte, Florida Phone: (941) Fax: (941) Website: Citrus County Fair 3600 South Florida Avenue Inverness, Florida Phone: (352) Fax: (352) Website: Clay County Agricultural Fair Post Office Box 1066 Green Cove Springs, Florida Phone: (904) Fax: (904) Website: Collier County Fair th Avenue Northeast Naples, Florida Phone: (239) Fax: (239) Website: Columbia County Fair Post Office Box 1376 Lake City, Florida Phone: (386) Fax: (386) Website: DeSoto County Fair Post Office Box 970 Arcadia, Florida Phone: (863) or (863) Fax: (863) Website: Firefighters Indian River County Fair 1818 Commerce Avenue Vero Beach, Florida Phone: (772) Fax: (772) Website: 150
151 Flagler County Fair, Youth Show Post Office Box 517 Bunnell, Florida Phone: (386) Fax: (386) Website: Florida State Fair Post Office Box Tampa, Florida Phone: FAIR (813) Fax: (813) Website: Florida Strawberry Festival Post Office Drawer 1869 Plant City, Florida Phone: (813) Fax: (813) Website: Greater Hillsborough County Fair Post Office Box 100 Sydney, Florida Phone: (813) Fax: (813) Website: Greater Jacksonville Agricultural Fair & Expo Center 510 Fairgrounds Place Jacksonville, Florida Phone: (904) Fax: (904) Website: Hardee County Fair Association Post Office Box 1236 Wauchula, Florida Phone: (863) Website: Hendry County Fair and LiveStock Show Inc. Post Office Box 1356 Clewiston, Florida Phone: (863) Fax: (863) Website: Hernando County Fair and Youth Livestock Show Post Office Box Brooksville, Florida Phone: (352) Fax: (352) Website: Highlands County Fair 781 Magnolia Avenue Sebring, Florida Phone: (863) Fax: (863) Website: Greater Holmes County Fair 2477 Barefield Lane Bonifay, Florida Phone: (850) Fax: (850) Jackson County Fair Post Office Box 330 Marianna, Florida Phone: (850) Fax: (850) Lake County Fair Post Office Box 221 Eustis, Florida Phone: (352) Fax: (352) Website: 151
152 Levy County Fair Post Office Box 818 Williston, Florida Phone: (352) Fax: (352) Website: Manatee County Fair th Avenue West Palmetto, Florida Phone: (941) Fax: (941) Website: Martin County Fair and Youth Livestock Show 2616 Southeast Dixie Highway Stuart, Florida Phone: (772) Fax: (772) Website: Miami-Dade County Fair Southwest 24th Street Miami, Florida Phone: (305) Fax: (305) Website: North Florida Fair 441 Paul Russell Road Tallahassee, Florida Phone: (850) ext. 305 Fax: (850) Website: Northeast Florida Fair Post Office Box 1070 Callahan, Florida Phone: (904) Fax: (904) Website: Northwest Florida Fair 1958 Lewis Turner Boulevard Fort Walton Beach, Florida Phone: (850) Fax: (850) Website: Okeechobee County Fair 4601 Highway 710 East Okeechobee, Florida Phone: (863) Fax: (863) Website: Osceola County Fair and Livestock Show 1911 Kissimmee Valley Lane Kissimmee, Florida Phone: (321) Fax: (321) Website: Pasco County Fair State Road 52 Dade City, Florida Phone: (352) Fax: (352) Website: Pensacola Interstate Fair 2172 West Nine Mile Road, PMB 210 Pensacola, Florida Phone: (850) Fax: (850) Website: Polk County Youth Fair Post Office Box 9005, Drawer HS03 Bartow, Florida Phone: (863) ext. 116 Fax: (863) Website: 152
153 Putnam County Fair and Expo Post Office Box 400 East Palatka, Florida Phone: (386) Fax: (386) Website: Saint Lucie County Fair Post Office Box Fort Pierce, Florida Phone: (772) Fax: (772) Website: Santa Rosa County Fair Post Office Box 884 Milton, Florida Phone: (850) Website: Sarasota County Agricultural Fair 3000 Ringling Blvd. Sarasota, FL Phone: (941) Fax: Website: St. Johns County Agricultural Fair 5840 State Road 207 Elkton, Florida Phone: (904) Fax: (904) Website: Southeastern Youth Fair Post Office Box 404 Ocala, Florida Phone: (352) Fax: (352) Website: South Florida Fair Post Office Box West Palm Beach, Florida Phone: (561) Fax: (561) Website: Southwest Florida, Lee County Fair Bayshore Road Fort Myers, Florida Phone: (239) Fax: (239) Website: Sumter County Fair Post Office Box 647 Webster, Florida Phone: (352) Fax: (352) Website: Suwannee County Fair Association Post Office Box 266 Live Oak, Florida Phone: (386) Website: Volusia County Fair, Youth Show 3150 East New York Avenue DeLand, Florida Phone: (386) Fax: (386) Website: Walton County Fair Post Office Box 550 DeFuniak Springs, Florida Phone: (850) Fax: (850) Website: 153
154 Florida Farm Bureau Federation Offices The Sunshine State s largest general agricultural organization with about 138,000 member-families representing Farm Bureaus in 60 counties. Membership provides a multitude of benefits, and you don t have to be a farmer to be a member of Florida Farm Bureau. Florida Farm Bureau Federation State Office (Florida) Post Office Box Gainesville, Florida Phone: (352) Fax: (352) Website: Alachua County Farm Bureau US Highway 441 Unit 20 Alachua, Florida Phone: (386) Fax: (386) Website: Baker County Farm Bureau 539 South 6th Street Macclenny, Florida Phone: (904) Fax: (904) Bay County Farm Bureau 303 Mosley Drive Lynn Haven, Florida Phone: (850) Fax: (850) Bradford County Farm Bureau 2270 North Temple Avenue Starke, Florida Phone: (904) Fax: (904) Broward County Farm Bureau 2121 North State Road 7 Margate, Florida Phone: (954) Fax: (954) Website: Calhoun-Gulf County Farm Bureau Main Street North Blountstown, Florida Phone: (850) Fax: (850) Charlotte County Farm Bureau 1278 South East US Highway 31 Arcadia, Florida Phone: (863) Fax: (863) Hernando-Citrus County Farm Bureau 617 Lamar Avenue Brooksville, Florida Phone: (352) Fax: (352) Clay County Farm Bureau 3960 Lazy Acres Road Middleburg, Florida Phone: (904) Fax: (904) Collier County Farm Bureau 1101 West Main Street, Suite 2 Immokalee, Florida Phone: (239) Fax: (239) Columbia County Farm Bureau 605 South West State Road 47 Lake City, Florida Phone: (386) Fax: (386) Brevard County Farm Bureau 111 Virginia Avenue Cocoa, Florida Phone: (321) Fax: (321)
155 Dade County Farm Bureau 1850 Old Dixie Highway Homestead, Florida Phone: (305) Fax: (305) Website: DeSoto County Farm Bureau 1278 South East US Highway 31 Arcadia, Florida Phone: (863) Fax: (863) Dixie County Farm Bureau Post Office Box 426 Trenton, Florida Phone: (352) Fax: (352) Duval County Farm Bureau 5542 Dunn Avenue Jacksonville, Florida Phone: (904) Fax: (904) Escambia County Farm Bureau 153 Highway 97 Molino, Florida Phone: (850) Fax: (850) Flagler County Farm Bureau 1000 Palm Coast Parkway Southwest, Suite 202 Palm Coast, Florida Phone: (386) Fax: (386) Franklin County Farm Bureau Please contact main office Phone: (352) Gadsden County Farm Bureau 2111 West Jefferson Street Quincy, Florida Phone: (850) Fax: (850) Gilchrist County Farm Bureau 306 West Wade Street Trenton, Florida Phone: (352) Fax: (352) Glades County Farm Bureau Post Office Box 1365 LaBelle, Florida Phone: (863) Fax: (863) Calhoun-Gulf County Farm Bureau Main Street North Blountstown, Florida Phone: (850) Fax: (850) Hamilton County Farm Bureau 1117 US Highway 41 North West Jasper, Florida Phone: (386) Fax: (386) Hardee County Farm Bureau 1017 US Highway 17 North Wauchula, Florida Phone: (863) Fax: (863) Hendry County Farm Bureau Post Office Box 1365 LaBelle, Florida Phone: (863) Fax: (863) Hernando-Citrus County Farm Bureau 617 Lamar Avenue Brooksville, Florida Phone: (352) Fax: (352) Highlands County Farm Bureau 6419 US Highway 27 South Sebring, Florida Phone: (863) Fax: (863) Website: 155
156 Hillsborough County Farm Bureau 100 South Mulrennan Road Valrico, Florida Phone: (813) Fax: (813) Website: Holmes County Farm Bureau 1108 North Waukesha Street Bonifay, Florida Phone: (850) Fax: (850) Indian River County Farm Bureau th Street, Suite A Vero Beach, Florida Phone: (772) Fax: (772) Jackson County Farm Bureau 4379 Lafayette Street Marianna, Florida Phone: (850) Fax: (850) Jefferson County Farm Bureau 105 West Anderson Street Monticello, Florida Phone: (850) Fax: (850) Lafayette County Farm Bureau Post Office Box 336 Mayo, Florida Phone: (386) Fax: (386) Lake County Farm Bureau State Road 19 Tavares, Florida Phone: (352) Fax: (352) Lee County Farm Bureau Metropolis Avenue, Suite 1 Fort Myers, Florida Phone: (239) Fax: (239) Leon County Farm Bureau 3375-C Capital Circle Northeast Tallahassee, Florida Phone: (850) Fax: (850) Website: Levy County Farm Bureau Post Office Box 998 Chiefland, Florida Phone: (352) Fax: (352) Liberty County Farm Bureau Main Street North Blountstown, Florida Phone: (850) Madison County Farm Bureau 233 West Base Street Madison, Florida Phone: (850) Fax: (850) Manatee County Farm Bureau 5620 Tara Boulevard, Suite 101 Bradenton, Florida Phone: (941) Fax: (941) Website: Marion County Farm Bureau 5800 South West 20th Street Ocala, Florida Phone: (352) Fax: (352) Website: Martin County Farm Bureau 506 South West Federal Highway, Suite 102 Stuart, Florida Phone: (772) Fax: (772) Monroe County Farm Bureau Please contact main office Phone: (352)
157 Nassau County Farm Bureau Post Office Box 5007 Callahan, Florida Phone: (904) Fax: (904) Okaloosa County Farm Bureau 921 West James Lee Boulevard Crestview, Florida Phone: (850) Fax: (850) Okeechobee County Farm Bureau 401 North West 4th Street Okeechobee, Florida Phone: (863) Fax: (863) Orange County Farm Bureau Post Office Box Orlando, Florida Phone: (407) Fax: (407) Osceola County Farm Bureau 1680 East Irlo Bronson Memorial Highway Kissimmee, Florida Phone: (407) Fax: (407) Palm Beach County Farm Bureau Military Trail Delray Beach, Florida Phone: (561) Fax: (561) st Location: (Western) Palm Beach County Farm Bureau 3019 State Road 15, Suite 5 Belle Glade, Florida Phone: (561) Fax: (561) nd Location: (Western) Palm Beach County Farm Bureau West Forest Hill Boulevard, Suite 104 Wellington, Florida Phone: (561) Pasco County Farm Bureau US Highway 301 Dade City, Florida Phone: (352) Fax: (352) Pinellas County Farm Bureau 1165 Lakeview Road Clearwater, Florida Phone: (727) Fax: (727) Polk County Farm Bureau 1715 US Highway 17 South Bartow, Florida Phone: (863) Fax: (863) Website: Putnam - St. Johns County Farm Bureau 1470 South US Highway 17 East Palatka, Florida Phone: (386) Fax: (386) Santa Rosa County Farm Bureau Post Office Box 490 Jay, Florida Phone: (850) Fax: (850) Sarasota County Farm Bureau 7289 Palmer Boulevard Sarasota, Florida Phone: (941) Fax: (941) Seminole County Farm Bureau Post Office Box Orlando, Florida Phone: (407) Fax: (407)
158 Putnam-Saint Johns County Farm Bureau 147 South US Highway 17 East Palatka, Florida Phone: (386) Fax: (386) Saint Lucie County Farm Bureau 3327 Orange Avenue Fort Pierce, Florida Phone: (772) Fax: (772) Sumter County Farm Bureau 7610 State Road 471 Bushnell, Florida Phone: (352) Fax: (352) Suwannee County Farm Bureau 407 Dowling Avenue South East Live Oak, Florida Phone: (386) Fax: (386) Taylor County Farm Bureau 813 South Washington Street Perry, Florida Phone: (850) Fax: (850) Union County Farm Bureau 325 South East 6th Street Lake Butler, Florida Phone: (386) Fax: (386) Volusia County Farm Bureau 3090 East New York Avenue DeLand, Florida Phone: (386) Fax: (386) Walton County Farm Bureau 684 North 9th Street DeFuniak Springs, Florida Phone: (850) Fax: (850) Washington County Farm Bureau 1361 Jackson Avenue Chipley, Florida Phone: (850) Fax: (850) USDA Service Centers USDA Service Centers are designed to be a single location where customers can access the services provided by the Farm Service Agency, Natural Resources Conservation Service and the Rural Development agencies. This website will provide the address of a USDA Service Center and other Agency offices serving your area along with information on how to contact them. Farm Service Agency State Office (Florida) Post Office Box Gainesville, Florida Phone: (352) Fax: (352) USDA Natural Resource Conservation Service State Office (Florida) Post Office Box Gainesville, Florida Phone: (352) Fax: (352) USDA Rural Development State Office (Florida) Post Office Box Gainesville, Florida Phone: (352) Fax: (352) Wakulla County Farm Bureau 2468 Crawfordville Highway Crawfordville, Florida Phone: (850) Fax: (850)
159 Alachua County Gainesville Service Center 5709 NW 13th Street Gainesville, Florida Phone: (352) Fax: (352) Farm Service Agency Natural Resources Conservation Service Conservation District Ocala Service Center 2441 North East 3rd Street, Suite 204 Ocala, Florida Phone: (352) Fax: (352) Rural Development (Area Office) Baker County Baldwin Service Center 260 US Highway 301 North Baldwin, Florida Phone: (904) Fax: (904) Farm Service Agency Natural Resources Conservation Service Rural Development Lake City Area 3 Office 971 West Duval Street, Suite 190 Lake City, Florida Phone: (386) Fax: (386) Rural Development (Area Office) Bay County Bonifay Service Center 103 North Oklahoma Street Bonifay, Florida Phone: (850) Fax: (850) Farm Service Agency Natural Resources Conservation Service Bradford County Gainesville Service Center 5709 North West 13th Street Gainesville, Florida Phone: (352) Fax: (352) Farm Service Agency Natural Resources Conservation Service Rural Development Lake City Area 3 Office 971 West Duval Street, Suite 190 Lake City, Florida Phone: (386) Fax: (386) Rural Development (Area Office) Brevard County Kissimmee Service Center 1921 Kissimmee Valley Lane Kissimmee, Florida Phone: (407) Fax: (407) Farm Service Agency Rural Development Area Office 2629 Waverly Barn Road, Suite 129 Davenport, Florida Phone: (863) Fax: (863) Rural Development (Area Office) Broward County Royal Palm Beach Service Center 420 South State Road 7 Royal Palm Beach, Florida Phone: (561) Fax: (561) Natural Resources Conservation Service Conservation District Rural Development (Area Office) Marianna Service Center 2741 Pennsylvania Avenue Marianna, Florida Phone: (850) Fax: (850) Rural Development (Area Office) 159
160 Calhoun County Blountstown Service Center North West Leonard Street Blountstown, Florida Phone: (850) Fax: (850) Farm Service Agency Natural Resources Conservation Service Conservation District Marianna Service Center 2741 Pennsylvania Avenue Marianna, Florida Phone: (850) Fax: (850) Rural Development (Area Office) Charlotte County Ft. Myers Service Center 3434 Hancock Bridge Parkway Fort Myers, Florida Phone: (239) Fax: (239) Farm Service Agency Natural Resources Conservation Service Rural Development (Area Office) Sarasota Service Center 6942 Professional Parkway East Sarasota, Florida Phone: (941) Fax: (941) Natural Resources Conservation Service Citrus County Bushnell Service Center Office 7620 State Road 471, Suite 3 Bushnell, Florida Phone: (352) Fax: (352) Farm Service Agency Ocala Service Center 2441 North East 3rd Street, Suite 204 Ocala, Florida Phone: (352) Fax: (352) Natural Resources Conservation Service Rural Development (Area Office) Clay County East Palatka Service Center 111 Yelvington Road, Suite 3 East Palatka, Florida Phone: (386) Fax: (386) Farm Service Agency Natural Resources Conservation Service Rural Development Lake City Area 3 Office 971 West Duval Street, Suite 190 Lake City, Florida Phone: (386) Fax: (386) Rural Development (Area Office) Collier County Naples Service Center Immokalee Road Naples, Florida Phone: (239) Fax: (239) Natural Resources Conservation Service Conservation District Fort Myers Service Center 3434 Hancock Bridge Parkway Fort Myers, Florida Phone: (239) Fax: (239) Farm Service Agency Natural Resources Conservation Service Conservation District Rural Development (Area Office) Columbia County Lake City Service Center 2304 South West Main Boulevard, Suite 103 Lake City, Florida Phone: (386) Fax: (386) Farm Service Agency Natural Resources Conservation Service Conservation District 160
161 Rural Development Lake City Area 3 Office 971 West Duval Street, Suite 190 Lake City, Florida Phone: (386) Fax: (386) Rural Development (Area Office) DeSoto County Wauchula Service Center 316 North 7th Avenue Wauchula, Florida Phone: (863) Fax: (863) Farm Service Agency Natural Resources Conservation Service Conservation District Fort Myers Service Center 3434 Hancock Bridge Parkway Fort Myers, Florida Phone: (239) Fax: (239) Rural Development (Area Office) Dixie County Bronson Service Center 625 North Hathaway Avenue Bronson, Florida Phone: (352) Fax: (352) Natural Resources Conservation Service Conservation District Trenton Service Center 723 East Wade Street Trenton, Florida Phone: (352) Fax: (352) Farm Service Agency Ocala Service Center 2441 North East 3rd Street, Suite 204 Ocala, Florida Phone: (352) Fax: (352) Rural Development (Area Office) Duval County Baldwin Service Center 260 US Highway 301 North Baldwin, Florida Phone: (904) Fax: (904) Farm Service Agency Natural Resources Conservation Service Conservation District Rural Development Lake City Area 3 Office 971 West Duval Street, Suite 190 Lake City, Florida Phone: (386) Fax: (386) Rural Development (Area Office) Escambia County Molino Service Center 151 State Highway 97 Molino, Florida Phone: (850) Fax: (850) Farm Service Agency Natural Resources Conservation Service Conservation District Milton Service Center 6277 Dogwood Drive Milton, Florida Phone: (850) Fax: (850) Farm Service Center Crestview Service Center 934 North Ferdon Boulevard Crestview, Florida Phone: (850) Fax: (850) Rural Development (Area Office) Flagler County East Palatka Service Center 111 Yelvington Road Suite 3 East Palatka, Florida Phone: (386) Fax: (386) Farm Service Agency 161
162 Flagler County (continued) Deland Service Center 101 Heavensgate Road DeLand, Florida Phone: (386) Fax: (386) Natural Resources Conservation Service Conservation District Ocala Service Center 2441 North East 3rd Street, Suite 204 Ocala, Florida Phone: (352) Fax: (352) Rural Development (Area Office) Franklin County Blountstown Service Center North West Leonard Street Blountstown, Florida Phone: (850) Fax: (850) Farm Service Agency Natural Resources Conservation Service Marianna Service Center 2741 Pennsylvania Avenue Marianna, Florida Phone: (850) Fax: (850) Rural Development (Area Office) Gadsden County Quincy Service Center 2144 West Jefferson Street Quincy, Florida Phone: (850) Fax: (850) Farm Service Agency Natural Resources Conservation Service Conservation District Marianna Service Center 2741 Pennsylvania Avenue Marianna, Florida Phone: (850) Fax: (850) Rural Development (Area Office) Gilchrist County Trenton Service Center 723 East Wade Street Trenton, Florida Phone: (352) Fax: (352) Farm Service Agency Bronson Service Center 625 North Hathaway Avenue Bronson, Florida Phone: (352) Fax: (352) Natural Resources Conservation Service Conservation District Ocala Service Center 2441 North East 3rd Street, Suite 204 Ocala, Florida Phone: (352) Fax: (352) Rural Development (Area Office) Glades County US Highway 27 Moore Haven, Florida Phone: (863) Fax: (863) Farm Service Agency LaBelle Service Center 1085 Pratt Boulevard La Belle, Florida Phone: (863) Fax: (863) Natural Resources Conservation Service Conservation District Royal Palm Beach Service Center 420 South State Road 7 Royal Palm Beach, Florida Phone: (561) Fax: (561) Rural Development (Area Office) 162
163 Gulf County Blountstown Service Center North West Leonard Street Blountstown, Florida Phone: (850) Fax: (850) Farm Service Agency Natural Resources Conservation Service Marianna Service Center 2741 Pennsylvania Avenue Marianna, Florida Phone: (850) Fax: (850) Rural Development (Area Office) Hamilton County Live Oak Service Center US Highway 129 Live Oak, Florida Phone: (386) Fax: (386) Farm Service Agency Natural Resources Conservation Service Rural Development Lake City Area 3 Office 971 West Duval Street, Suite 190 Lake City, Florida Phone: (386) Fax: (386) Rural Development (Area Office) Hardee County Wauchula Service Center 316 North 7th Avenue Wauchula, Florida Phone: (863) Fax: (863) Farm Service Agency Natural Resources Conservation Service Conservation District Hendry County Moore Haven Service Center Post Office Box 1339 Moore Haven, Florida Phone: Temporary (863) Fax: Temporary (863) Farm Service Agency LaBelle Service Center 1085 Pratt Boulevard LaBelle, Florida Phone: (863) Fax: (863) Natural Resources Conservation Service Conservation District Royal Palm Beach Service Center 420 South State Road 7 Royal Palm Beach, Florida Phone: (561) Fax: (561) Rural Development (Area Office) Hernando County San Antonio Service Center Commerce Drive, Suite 103 San Antonio, Florida Phone: (352) Fax: (352) Farm Service Agency Natural Resources Conservation Service Rural Development Area Office 2629 Waverly Barn Road, Suite 129 Davenport, Florida Phone: (863) Fax: (863) Rural Development (Area Office) Fort Myers Service Center 3434 Hancock Bridge Parkway Fort Myers, Florida Phone: (239) Fax: (239) Rural Development (Area Office) 163
164 Highlands County Sebring Service Center 4505/4507 George Boulevard Sebring, Florida Phone: (863) Fax: (863) Farm Service Agency Natural Resources Conservation Service Conservation District Okeechobee Service Center 450 US Highway 98 North Okeechobee, Florida Phone: (863) Fax: (86) Farm Service Agency Royal Palm Beach Service Center 420 South State Road 7 Royal Palm Beach, Florida Phone: (561) Fax: (561) Rural Development (Area Office) Hillsborough County Plant City Service Center 201 South Collins Street Suite 201 Plant City, Florida Phone: (813) Fax: (813) Farm Service Agency Natural Resources Conservation Service Conservation District Rural Development Area Office 2629 Waverly Barn Road, Suite 129 Davenport, Florida Phone: (863) Fax: (863) Rural Development (Area Office) Holmes County Bonifay Service Center 103 North Oklahoma Street Bonifay, Florida Phone: (850) Fax: (850) Farm Service Agency Natural Resources Conservation Service Conservation District Crestview Service Center 934 North Ferdon Boulevard Crestview, Florida Phone: (850) Fax: (850) Rural Development (Area Office) Indian River County Fort Pierce Service Center 8400 Picos Road Fort Pierce, Florida Phone: (772) Fax: (772) Farm Service Agency Natural Resources Conservation Service Royal Palm Beach Service Center 420 South State Road 7 Royal Palm Beach, Florida Phone: (561) Fax: (561) Rural Development (Area Office) Jackson County Marianna Service Center 2741 Pennsylvania Avenue Marianna, Florida Phone: (850) Fax: (850) Farm Service Agency Natural Resources Conservation Service Conservation District Rural Development (Area Office) Jefferson County Monticello Service Center 1244 North Jefferson Street Monticello, Florida Phone: (850) Fax: (850) Farm Service Agency Natural Resources Conservation Service Conservation District 164
165 Marianna Service Center 2741 Pennsylvania Avenue Marianna, Florida Phone: (850) Fax: (850) Rural Development (Area Office) Rural Development Lake City Area 3 Office 971 West Duval Street Lake City, Florida Phone: (386) Fax: (352) Rural Development (Area Office) Lafayette County Mayo Service Center 176 South West Community Circle, Suite B Mayo, Florida Phone: (386) Fax: (384) Farm Service Agency Natural Resources Conservation Service Conservation District Rural Development Lake City Area 3 Office 971 West Duval Street Lake City, Florida Phone: (386) Fax: (386) Rural Development (Area Office) Lake County Tavares Service Center 1725 David Walker Drive Tavares, Florida Phone: (352) Fax: (352) Farm Service Agency Natural Resources Conservation Service Conservation District Ocala Service Center 2441 North East 3rd Street, Suite 204 Ocala, Florida Phone: (352) Fax: (352) Rural Development (Area office) Lee County Fort Myers Service Center 3434 Hancock Bridge Parkway Fort Myers, Florida Phone: (239) Fax: (239) Farm Service Agency Natural Resources Conservation Service Conservation District Rural Development Leon County Tallahassee Service Center 615 Paul Russell Road Tallahassee, Florida Phone: (850) Fax: (850) Natural Resources Conservation Service Conservation District Monticello Service Center 1244 North Jefferson Street Monticello, Florida Phone: (850) Fax: (850) Farm Service Agency Marianna Service Center 2741 Pennsylvania Avenue Marianna, Florida Phone: (850) Fax: (850) Rural Development (Area Office) Levy County Bronson Service Center 625 North Hathaway Avenue Bronson, Florida Phone: (352) Fax: (352) Farm Service Agency Natural Resources Conservation Service Conservation District 165
166 Levy County (continued) Ocala Service Center 2441 North East 3rd Street, Suite 204 Ocala, Florida Phone: (352) Fax: (352) Rural Development (Area office) Liberty County Blountstown Service Center North West Leonard Street Blountstown, Florida Phone: (850) Fax: (850) Farm Service Agency Natural Resources Conservation Service Marianna Service Center 2741 Pennsylvania Avenue Marianna, Florida Phone: (850) Fax: (850) Rural Development (Area Office) Madison County Madison Service Center 1416 East US 90, Unit 1 Madison, Florida Phone: (850) Fax: (850) Farm Service Agency Natural Resources Conservation Service Conservation District Rural Development Lake City Area 3 Office 971 West Duval Street, Suite 190 Lake City, Florida Phone: (386) Fax: (386) Rural Development (Area Office) Manatee County Wauchula Service Center 316 North 7th Avenue Wauchula, Florida Phone: (863) Fax: (863) Farm Service Agency Sarasota Service Center 6942 Professional Parkway East Sarasota, Florida Phone: (941) Fax: (941) Natural Resources Conservation Service Conservation District Fort Myers Service Center 3434 Hancock Bridge Parkway Fort Myers, Florida Phone: (239) Fax: (239) Rural Development (Area Office) Marion County Ocala Service Center 2441 North East 3rd Street, Suite 204 Ocala, Florida Phone: (352) Fax: (352) Farm Service Agency Natural Resources Conservation Service Rural Development (Area Office) Conservation District Martin County Fort Pierce Service Center 8400 Picos Road Fort Pierce, Florida Phone: (772) Fax: (772) Farm Service Agency Natural Resources Conservation Service Royal Palm Beach Service Center 420 South State Road 7 Royal Palm Beach, Florida Phone: (561) Fax: (561) Rural Development (Area Office) 166
167 Miami-Dade Florida City Service Center 1450 North Krome Avenue, Suite 102 Florida City, Florida Phone: (305) Fax: (305) Farm Service Agency Natural Resources Conservation Service Conservation District Royal Palm Beach Service Center 420 South State Road 7 Royal Palm Beach, Florida Phone: (561) Fax: (561) Rural Development (Area Office) Monroe County Florida City Service Center 1450 North Krome Avenue, Suite 102 Florida City, Florida Phone: (305) Fax: (305) Farm Service Agency Natural Resources Conservation Service Conservation District Royal Palm Beach Service Center 420 South State Road 7 Royal Palm Beach, Florida Phone: (561) Fax: (561) Rural Development (Area Office) Nassau County Baldwin Service Center 260 US Highway 301 North Baldwin, Florida Phone: (904) Fax: (904) Farm Service Agency Natural Resources Conservation Service Rural Development Lake City Area 3 Office 971 West Duval Street, Suite 190 Lake City, Florida Phone: (386) Fax: (386) Rural Development (Area Office Okaloosa County Crestview Service Center 934 North Ferdon Boulevard Crestview, Florida Phone: (850) Fax: (850) Farm Service Agency Natural Resources Conservation Service Rural Development Conservation District Okeechobee County Okeechobee Service Center 450 US Highway 98 North Okeechobee, Florida Phone: (863) Fax: (863) Farm Service Agency Natural Resources Conservation Service Conservation District Royal Palm Beach Service Center 420 South State Road 7 Royal Palm Beach, Florida Phone: (561) Fax: (561) Rural Development (Area Office) Orange County Tavares Service Center 1725 David Walker Drive Tavares, Florida Phone: (352) Fax: (352) Farm Service Agency 167
168 Orange County (continued) Kissimmee Service Center 1921 Kissimmee Valley Lane Kissimmee, Florida Phone: (407) Fax: (407) Natural Resources Conservation Service Rural Development Area Office 2629 Waverly Barn Road, Suite 129 Davenport, Florida Phone: (863) Fax: (863) Rural Development (Area Office) Osceola County Kissimmee Service Center 1921 Kissimmee Valley Lane Kissimmee, Florida Phone: (407) Fax: (407) Farm Service Agency Natural Resources Conservation Service Conservation District Rural Development Area Office 2629 Waverly Barn Road, Suite 129 Davenport, Florida Phone: (863) Fax: (863) Rural Development (Area Office) Palm Beach County Royal Palm Beach Service Center 420 South State Road 7 Royal Palm Beach, Florida Phone: (561) Fax: (561) Farm Service Agency Natural Resources Conservation Service Rural Development (Area Office) Conservation District Pasco County San Antonio Service Center Commerce Drive, Suite 103 San Antonio, Florida Phone: (352) Fax: (352) Farm Service Agency Natural Resources Conservation Service Conservation District Rural Development Area Office 2629 Waverly Barn Road, Suite 129 Davenport, Florida Phone: (863) Fax: (863) Rural Development (Area Office) Pinellas County Plant City Service Center 201 South Collins Street, Suite 201 Plant City, Florida Phone: (813) Fax: (813) Farm Service Agency Natural Resources Conservation Service Conservation District Rural Development Area Office 2629 Waverly Barn Road, Suite 129 Davenport, Florida Phone: (863) Fax: (863) Rural Development (Area Office) Polk County Bartow Service Center 1700 Highway 17 South Bartow, Florida Phone: (863) Fax: (863) Farm Service Agency Natural Resources Conservation Service Conservation District 168
169 Rural Development Area Office 2629 Waverly Barn Road, Suite 129 Davenport, Florida Phone: (863) Fax: (863) Rural Development (Area Office) Putnam County East Palatka Service Center 111 Yelvington Road Suite 3 East Palatka, Florida Phone: (386) Fax: (386) Farm Service Agency Natural Resources Conservation Service Conservation District Ocala Service Center 2441 NE 3rd Street Suite 204 Ocala, Florida Phone: (352) Fax: (352) Rural Development (Area Office) Santa Rosa County Milton Service Center 6277 Dogwood Drive Milton, Florida Phone: (850) Fax: (850) Farm Service Agency Natural Resources Conservation Service Conservation District Crestview Service Center 934 North Ferdon Boulevard Crestview, Florida Phone: (850) Fax: (850) Rural Development (Area Office) Sarasota County Sarasota Service Center 6942 Professional Parkway East Sarasota, Florida Phone: (941) Fax: (941) Natural Resources Conservation Service Conservation District Wauchula Service Center 316 North 7th Avenue Wauchula, Florida Phone: (863) Fax: (863) Farm Service Agency Fort Myers Service Center 3434 Hancock Bridge Parkway Fort Myers, Florida Phone: (239) Fax: (239) Rural Development (Area Office) Seminole County DeLand Service Center 101 Heavensgate Road DeLand, Florida Phone: (386) Fax: (386) Farm Service Agency Ocala Service Center 2441 North East 3rd Street, Suite 204 Ocala, Florida Phone: (352) Fax: (352) Rural Development (Area Office) Saint Johns County East Palatka Service Center 111 Yelvington Road Suite 3 East Palatka, Florida Phone: (386) Fax: (386) Farm Service Agency Natural Resources Conservation Service Conservation District 169
170 St. John s County (continued) Rural Development Lake City Area 3 Office 971 West Duval Street, Suite 190 Lake City, Florida Phone: (386) Fax: (386) Rural Development (Area Office) Saint Lucie County Fort Pierce Service Center 8400 Picos Road Fort Pierce, Florida Phone: (772) Fax: (772) Farm Service Agency Natural Resources Conservation Service Conservation District Royal Palm Beach Service Center 420 South State Road 7 Royal Palm Beach, Florida Phone: (561) Fax: (561) Rural Development (Area Office Sumter County Bushnell Service Center 7620 State Road 471, Suite 3 Bushnell, Florida Phone: (352) Fax: (352) Farm Service Agency Tavares Service Center 1725 David Walker Drive Tavares, Florida Phone: (352) Fax: (352) Natural Resources Conservation Service Conservation District Ocala Service Center 2441 North East 3rd Street, Suite 204 Ocala, Florida Phone: (352) Fax: (352) Rural Development (Area Office) Suwannee County Live Oak Service Center US Highway 129 Live Oak, Florida Phone: (386) Fax: (386) Farm Service Agency Natural Resources Conservation Service Conservation District Rural Development Lake City Area 3 Office 971 West Duval Street, Suite 190 Lake City, Florida Phone: (386) Fax: (386) Rural Development (Area Office) Taylor County Mayo Service Center 176 South West Community Circle, Suite B Mayo, Florida Phone: (386) Fax: (386) Farm Service Agency Natural Resources Conservation Service Conservation District Rural Development Lake City Area 3 Office 971 West Duval Street, Suite 190 Lake City, Florida Phone: (386) Fax: (386) Rural Development (Area Office) Union County Lake City Service Center 2304 South West Main Boulevard, Suite 103 Lake City, Florida Phone: (386) Fax: (386) Farm Service Agency Natural Resources Conservation Service Conservation District 170
171 Rural Development Lake City Area 3 Office 971 West Duval Street, Suite 190 Lake City, Florida Phone: (386) Fax: (386) Rural Development (Area Office) Volusia County DeLand Service Center 101 Heavensgate Road DeLand, Florida Phone: (386) Fax: (386) Farm Service Agency Natural Resources Conservation Service Conservation District Ocala Service Center 2441 North East 3rd Street, Suite 204 Ocala, Florida Phone: (352) Fax: (352) Rural Development (Area Office) Crestview Service Center 934 North Ferdon Boulevard Crestview, Florida Phone: (850) Fax: (850) Rural Development (Area Office) Washington County Bonifay Service Center 103 North Oklahoma Street Bonifay, Florida Phone: (850) Fax: (850) Farm Service Agency Natural Resources Conservation Service Conservation District Marianna Service Center 2741 Pennsylvania Avenue Marianna, Florida Phone: (850) Fax: (850) Rural Development (Area Office) Wakulla County Monticello Service Center 1244 North Jefferson Street Monticello, Florida Phone: (850) Fax: (850) Farm Service Agency Marianna Service Center 2741 Pennsylvania Avenue Marianna, Florida Phone: (850) Fax: (850) Rural Development (Area Office) Walton County DeFuniak Springs Service Center 239 John Baldwin Road DeFuniak Springs, Florida Phone: (850) Fax: (850) Farm Service Agency Natural Resources Conservation Service Conservation District 171
172 FLORIDA DEPARTMENT OF AGRICULTURE AND CONSUMER SERVICES Commissioner s Office The Capitol, Level 10 Tallahassee, Florida (850) Office of Agricultural Emergency Preparedness Office of Energy Office of Agricultural Law Enforcement Office of Inspector General Office of Legislative Affairs Office of Policy and Budget Cabinet Affairs Executive Programs General Counsel Division of Animal Industry Office of the State Veterinarian 407 South Calhoun St. 328 Mayo Building Tallahassee, Florida (850) Bureau of Animal Disease Control Bureau of Diagnostic Laboratories Kissimmee, Florida (321) Live Oak, Florida (386) Division of Administration 407 South Calhoun St. 509 Mayo Building Tallahassee, Florida (850) Bureau of Agriculture Management Information Center (AGMIC) Bureau of Finance and Accounting Bureau of General Services Bureau of Personnel Management Division of Agricultural Environmental Services 3125 Conner Blvd. 130 Administration Building Tallahassee, Florida (850) Bureau of Agriculture Environmental Laboratories (850) Bureau of Compliance Monitoring (850) Bureau of Entomology and Pest Control (850) Bureau of Pesticides (850) Office of Agricultural Water Policy 1203 Governors Square Blvd., Suite 200 Tallahassee, FL (850) Division of Aquaculture 1203 Governors Square Suite 501 Tallahassee, Florida (850) Bureau of Aquaculture Development Bureau of Aquaculture Environmental Services Division of Consumer Services 2005 Apalachee Parkway Tallahassee, Florida (850) Bureau of Compliance Bureau of Mediation and Enforcement Consumer Hotline: HELP-FLA En Espańol: FL-AYUDA Bureau of Fair Rides Inspection (850) Bureau of Liquified Petroleum Gas Inspections (850) Bureau of Standards (850) Fort Lauderdale, Field Office Port Everglades Petroleum Testing Laboratory (954) Tampa, Field Office Tampa Petroleum Testing Laboratory (813)
173 Florida Forest Service 3125 Conner Blvd. 228 Administration Building Tallahassee, Florida (850) Bureau of Forest Protection (850) Bureau of Forest Management (850) Bureau of Forest Logistics and Support (850) Bureau of Field Operations (850) Blackwater Forestry Center (850) Chipola Forestry Center (850) Tallahassee Forestry Center (850) Perry District Office (850) Suwannee District Office (386) Jacksonville District Office (904) Wacassassa Forestry Center (352) Bunnell District Office (386) Withlacoochee Forestry Center (352) Orlando District Office (407) Lakeland District Office (863) Myakka River District Office (941) Okeechobee District Office (863) Caloosahatchee District Office (239) Everglades District Office (954) Division of Food Safety 3125 Conner Boulevard, Suite D 101 Administration Building Tallahassee, Florida (850) Compliance Section Food Export Certificates Bureau of Chemical Residue Labs (850) Bureau of Dairy Industry (850) Bureau of Food Laboratories (850) Bureau of Food and Meat Inspection (850) Division of Food Nutrition and Wellness 600 South Calhoun St., Suite 120 Tallahassee, Florida (850) Customer Service Summer Food Service Program Hotline Division of Fruit and Vegetables 500 Third Street Northwest Winter Haven, FL (863) Bureau of Inspection Bureau of Technical Control
174 Division of Licensing Post Office Box 6687 Tallahassee, Florida (850) Bureau of License Issuance Bureau of Regulation and Enforcement Bureau of Support Services Fort Walton Regional Office (850) Tallahassee Regional Office (850) Jacksonville Regional Office (904) Orlando Regional Office (407) Tampa Regional Office (813) Punta Gorda Regional Office (941) West Palm Beach Regional Office (561) Miami Regional Office (305) Division of Marketing and Development 407 South Calhoun St. 435 Mayo Building Tallahassee, Florida (850) Bureau of Agricultural Dealer s Licenses Bureau of Development and Information Bureau of Education and Communication Bureau of Food Distribution Bureau of Seafood and Aquaculture Marketing Bureau of State Farmers Markets Ag In The Classroom (352) Florida Agricultural Museum (386) Florida Agricultural Promotional Campaign (FAPC) (850) Florida Market Bulletin (850) Research, Development and Information Services Section (850) Fruit and Vegetable Market News (407) Bureau of State Farmers Market (850) Florida City Farmers Market Paul Cardwell, Senior Market Manager (305) Fort Myers Farmers Market Lee Crews, Senior Market Manager (239) Fort Pierce Farmers Market Michael Brown, Senior Market Manager (772) Gadsden Farmers Market (850) Immokalee Farmers Market Jerry Hubbart, Senior Market Manager (239) Palatka Farmers Market Terry Driggers, Senior Market Manager (386) Florida Agricultural Statistics Services (407)
175 Plant City Farmers Market Fred Irwin, Senior Market Manager (813) Pompano Farmers Market Joseph Swick, Senior Market Manager (954) Sanford Farmers Market Doris Denis, Senior Market Manager (407) Starke Farmers Market Terry Driggers, Senior Market Manager (386) Suwannee Valley Farmers Market Jay Thomas, Market Specialist III (386) Trenton Farmers Market Terry Driggers, Senior Market Manager (386) Wauchula Farmers Market Diana Durrance, Senior Market Manager (863) Division of Plant Industry 1911 Southwest 34th St. Gainesville, Florida (352) Mailing Address: P.O. Box Gainesville, Florida Bureau of Citrus Budwood Registration Bureau of Entomology, Nematology and Plant Pathology Bureau of Methods Development and Biological Control Bureau of Pest Eradication and Control Bureau of Plant and Apiary Inspection Plant Industry Helpline: (888) Citrus Health Response Program: (800)
176 AGRICULTURAL STATISTICS & OTHER INFORMATION Internet NASS national & State reports and data are available on the World Wide Web, the Internet. National Homepage The national homepage has links to all agency products and services such as publications, graphics, historic data, State information, statistical research, Census of Agriculture, a search engine and a Published Estimates Data Base to query and download State or county historic data. There are also links to our Customer Service unit, a Kids Page, and all other federal statistics outside the National Agricultural Statistics Service. For a monthly summary of USDA estimates, forecasts and projections of commodities, prices, trade issues, and world crop developments, see: Ag_Newsletter/index.asp Florida Homepage The Florida web site offers much of the same information as the national homepage but in a format designed for Florida customers. The reports contain the same statistics but offer more details about agriculture in Florida. Links are also available to other sites such as the Florida Department of Agriculture, University of Florida and other NASS field offices. Printer Reports & Computer Format All NASS reports are still printed on paper. Census reports are only available while supplies last; contact the Florida office for a copy. NASS also offers a wide variety of data on diskettes or CD-ROM with national, State, and county statistics. Most of these products are in Lotus spreadsheet format or comma separated (CSV) files. A listing of all paper reports and computer products can be found in the Products & Services catalog issued every December. To order a free Products & Services catalog or purchase paper reports, diskettes or CD-ROMs, call the order disk at: Subscriptions Free subscriptions are available via automated mailing lists for National and State reports. You can subscribe to individual reports and they will be sent directly to your address soon after the official release time. National Reports via National reports contain statistics from all states and are the most timely source of data. For more information, see: or send to: usda-reports@usda.mannlib.cornell.edu and in the body of the message type the word: State Reports via list State reports are distributed after national reports but they usually contain more local information. To learn more about this service, see: index.asp or send to: listserv@newsbox.usda.gov and in the message text (not the subject), type two lines with one word on each line: lists help To subscribe to the Florida Weather & Crop News the message text (not the subject) would be: subscribe usda-fl-crop-weather [your name] Auto-Fax Selected NASS reports and information items are available from a free fax service called NASS-Fax. To receive the items, use a touch tone telephone connected to your FAX machine to call: Voice prompts will guide you to selected items of interest. The first time you access the system, request Document number 0411 which will provide a listing of the information that is available in reports. 176

177 177 The Fresh From Florida brand is a symbol of quality and the logo is recognized around the globe. Behind the logo is our dedicated team of marketing professionals with a proven track record of increasing sales of Florida agricultural products. Direct benefits* of membership in the program include: Use of the widely recognized Fresh From Florida logo on products, packaging, advertising and promotional materials Point of purchase materials to display with Florida grown products Choice of customized FFF business signage - 2x3 metal farm gate sign, 3x6 vinyl weatherproof banner or 2x6 vinyl weatherproof banner Participation in the logo incentive program Company listing and website link on the Fresh From Florida website Subscription to the Fresh From Florida magazine and e-newsletter *Benefits of the program are subject to change. Join Today! Visit FreshFromFlorida.com or call us at (850)


178 GADSDEN SUWANEE VALLEY Providing Essential Marketing Infrastructure State Farmers Markets assist in the marketing of farm products by providing modern marketing facilties to move products from the farm to the consumer. There are 13 State Farmers Markets that offer attendant services such as refrigeration, truck weigh scales, packing houses, coolers, offices, farm supplies, restaurants, produce brokerage sales, and produce and freight shipping companies. Through volume production and marketing, effective competition is assured for both small amd large growers and buyers. TRENTON STARKE SANFORD PLANT CITY WAUCHULA PALATKA FORT MYERS FORT PIERCE IMMOKALEE POMPANO FLORIDA CITY
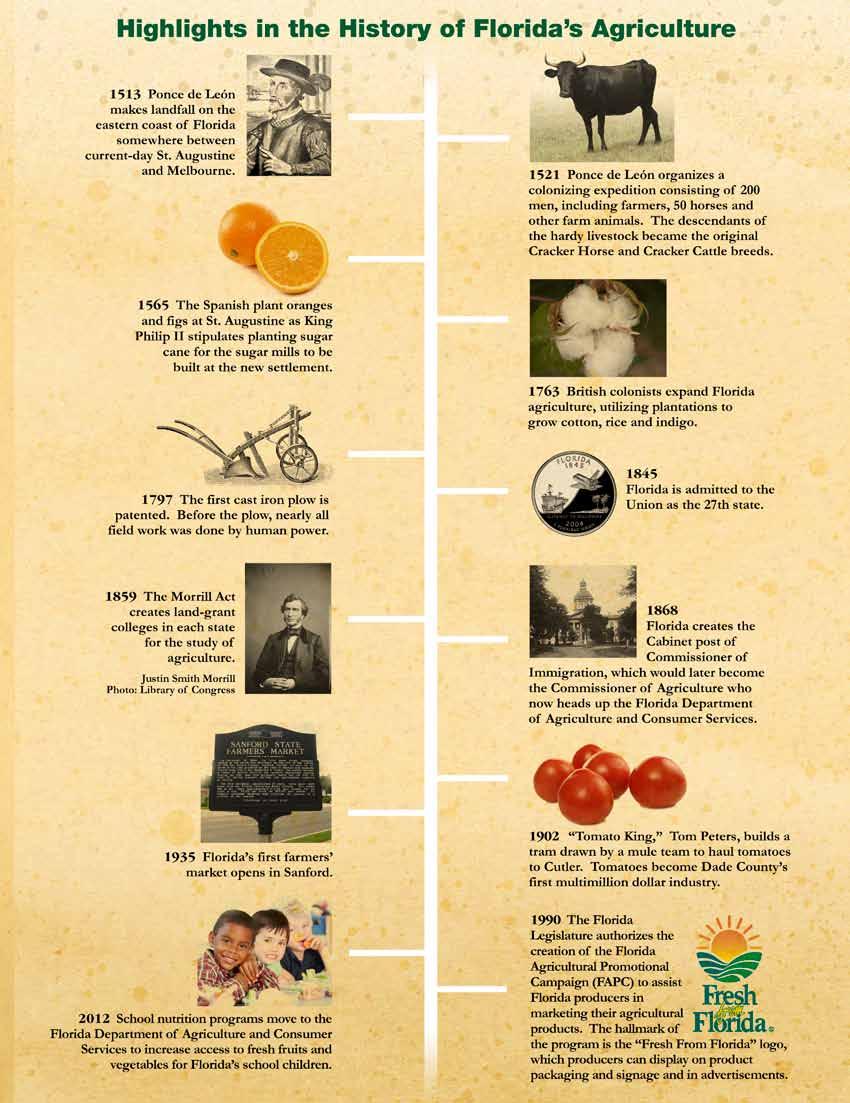
179 179
180 180
GRAPH P-1: YEARS OF LIFE EXPECTANCY AT BIRTH, FLORIDA AND UNITED STATES, CENSUS YEARS AND YEAR
 Population CHART P-1: YEARS OF LIFE EXPECTANCY AT BIRTH, BY RACE, ETHNICITY, AND GENDER, FOR FLORIDA RESIDENTS AND UNITED STATES, CENSUS YEARS 1970-2000 AND 2004-2014 FLORIDA UNITED STATES 1 1 2 WHITE
2017 Income Limits and Rent Limits Florida Housing Finance Corporation SHIP Program
 Alachua County 30% 13,650 16,240 20,420 24,600 28,780 32,960 37,140 41,320 Refer to HUD 341 373 510 667 824 980 (Gainesville MSA) 50% 22,750 26,000 29,250 32,450 35,050 37,650 40,250 42,850 45,430 48,026
Money Bayou Outfall Relocation Project
 Permit Sketches and General Notes Money Bayou Outfall Relocation Project 76 & 768 State Road (SR) Port St. Joe, Florida 2456 Section 9, Township 9S, Range W Gulf County, Florida 29 4.8' N, 85 7.2' W APPLICANT
IRIS External Interfaces
 IRIS External Interfaces FRS Participating Agencies: https://www.rol.frs.state.fl.us/forms/part-emp.pdf SAMAS (State Automated Management Accounting System)/State Comptroller, Florida Department of Financial
Our Oath. Monday, Lunch on your own. Single Officer Response to an Active Shooter. A.J. DeAndrea. 7:00-9:30 Coffee Bar
 Our Oath Monday, 7-8-19 7:00-9:30 Coffee Bar 9:00-12:00 Opening Ceremonies 12:00-1:00 Lunch on your own Single Officer Response to an Active Shooter A.J. DeAndrea Tuesday 7-9-19 Threat Assessment and De-Escalation
ATTACHMENT E. IRIS External Interfaces
 ATTACHMENT E IRIS External Interfaces 1099-R Print Vendor Actuary Consultant Department of Financial Services (DFS) Florida Auditor General s Office (AG) Florida Department of Children and Families (DCF)
Cattle and Beef Markets: Short and Long Run Challenges and Opportunities
 Cattle and Beef Markets: Short and Long Run Challenges and Opportunities Derrell S. Peel Breedlove Professor of Agribusiness and Extension Livestock Marketing Specialist Oklahoma State University Major
Your NAMI State Organization
 Your NAMI State Organization State: State Organization: Florida NAMI Florida NAMI Florida PO Box 961 Tallahassee, FL 32302 Phone: (850) 671-4445 Fax: (850) 671-5272 Email Additional Contact Info: info@namiflorida.org
Government of Puerto Rico Department of Labor and Human Resources Bureau of Labor Statistics BUSINESS EMPLOYMENT DYNAMICS: FOURTH QUARTER
 Government of Puerto Rico Department of Labor and Human Resources Bureau of Labor Statistics BUSINESS EMPLOYMENT DYNAMICS: FOURTH QUARTER 2011 TABLE OF CONTENTS Introduction.1 Business Employment Dynamics:
Past, Present and Future U.S. Lamb Market, 2013
 Past, Present and Future U.S. Lamb Market, 2013 Tim Petry Livestock Economist www.ag.ndsu.edu/livestockeconomics It was the best of times, it was the worst of times Source: Chapter 1, A Tale of Two Cities
BUSINESS EMPLOYMENT DYNAMICS THIRD QUARTER
 The Commonwealth of Puerto Rico Department of Labor and Human Resources Bureau of Labor Statistics BUSINESS EMPLOYMENT DYNAMICS THIRD QUARTER 2012 TABLE OF CONTENTS Introduction.1 Business Employment
New Approaches and Methods for the 1950 Census of Agriculture
 6 AGRICULTURAL ECONOMICS RESEARCH A Journal of Economic and Statistical Research in the Bureau of Agricultural Economics and Cooperating Agencies Volume III OCTOBER 1951 Number 4 New Approaches and Methods
THIS REPORT CONTAINS ASSESSMENTS OF COMMODITY AND TRADE ISSUES MADE BY USDA STAFF AND NOT NECESSARILY STATEMENTS OF OFFICIAL U.S.
 THIS REPORT CONTAINS ASSESSMENTS OF COMMODITY AND TRADE ISSUES MADE BY USDA STAFF AND NOT NECESSARILY STATEMENTS OF OFFICIAL U.S. GOVERNMENT POLICY Required Report - public distribution Date: GAIN Report
Merry Christmas and Happy New Year
 Irwin County Extension 107 West Fourth Street Ocilla, Georgia 31774-1401 Merry Christmas and Happy New Year Office Phone: (229) 468-7409 E-mail: pedwards@uga.edu Webpage: http://www.ugaextension.com/irwin
Beef Breeding Record Book : Extension Circular
 University of Nebraska - Lincoln DigitalCommons@University of Nebraska - Lincoln Nebraska 4-H Clubs: Historical Materials and Publications 4-H Youth Development 1955 Beef Breeding Record Book : Extension
Contents. Illustrations
 Copyright IDSA 2001 Contents Executive Summary 3 1.0 Introduction 4 2.0 Direct Effects of Consumer Demand for Computer and Video Games 6 2.1 Sectors and Industries Directly Affected and Included 6 Information
FEDERAL DEPOSIT INSURANCE CORPORATION Effective: 12/1/2011 STATE:FLORIDA A D J U S T E D I N C O M E L I M I T S
 Cape Coral-Fort Myers, FL MSA VERY LOW INCOME 19950 22800 25650 28500 30800 33100 35350 37650 65% LIMITS 25950 29650 33350 37050 40050 43000 45950 48950 LOW INCOME 31950 36500 41050 45600 49250 52900 56550
EagleWatch By The Numbers ( ) 511 nest monitored statewide volunteers & partners. 7,200 reports of nest activity
 511 nest monitored statewide volunteers & partners. 7,200 reports of nest activity") 2016-2017 EagleWatch By The Numbers (2016-2017) Audubon EagleWatch experienced significant growth in monitoring efforts for the 2016-2017 nesting season. Photo: Kathy Abbott 230+ volunteers & partners
2016-2017 EagleWatch By The Numbers (2016-2017) Audubon EagleWatch experienced significant growth in monitoring efforts for the 2016-2017 nesting season. Photo: Kathy Abbott 230+ volunteers & partners
ST. VINCENT & THE GRENADINES - Agricultural Census 2000 Main Results
 ST. VINCENT & THE GRENADINES - Agricultural Census 2000 Main Results Please refer to the Explanatory Notes given at the end of the tables Number and area of holdings Number of holdings Area (ha) Total
Notes from U.S. Census Nonpopulation Schedules 1860 Davis & Jordan Adams & Hull
 Notes from U.S. Census Nonpopulation Schedules Extracted and Transcribed for the Friends of the Cowell Lime Works Historic District University of California, Santa Cruz February, 2011! In addition the
Entropy Based Measurement of Geographic. Concentration in U.S. Hog Production. Bryan J. Hubbell FS January 1997
 Entropy Based Measurement of Geographic Concentration in U.S. Hog Production Bryan J. Hubbell FS-97-02 January 1997 Bryan Hubbell is an Assistant Professor in the Department of Agricultural and Applied
Economic and Real Estate Market Outlook
 Economic and Real Estate Market Outlook By Lawrence Yun, Ph.D. Chief Economist, National Association of REALTORS Presentation at Miami International Congress Miami, FL November 1, 2016 Lifetime Wealth
Canada Agricultural Census 2011 Explanatory notes
 Canada Agricultural Census 2011 Explanatory notes 1. Historical outline The British North America Act of 1867 included the requirement for a census to be taken every 10 years starting in 1871. However,
NEWS RELEASE FOR WIRE TRANSMISSION: 8:30 A.M. EDT, FRIDAY, APRIL 17, William Zeile: (202) BEA 09-14
 BEA 09-14") NEWS RELEASE FOR WIRE TRANSMISSION: 8:30 A.M. EDT, FRIDAY, APRIL 17, 2009 William Zeile: (202) 606-9893 BEA 09-14 Summary Estimates for Multinational Companies: Employment, Sales, and Capital Expenditures
NEWS RELEASE FOR WIRE TRANSMISSION: 8:30 A.M. EDT, FRIDAY, APRIL 17, 2009 William Zeile: (202) 606-9893 BEA 09-14 Summary Estimates for Multinational Companies: Employment, Sales, and Capital Expenditures
Production and Value of Honey and Maple Products
 Catalogue no. 23-221-X. Service bulletin Production and Value of Honey and Maple Products 2011. Highlights Honey In 2011, Canadian beekeepers produced 78.1 million pounds of honey, a decline of nearly
BUSINESS EMPLOYMENT DYNAMICS
 BUSINESS EMPLOYMENT DYNAMICS First Quarter 2018 Office of Research Kurt Westby, Commissioner Andrew Condon, Director of Research WETHERSFIELD, November 7th, 2018 - (BED) data published quarterly by the
A Compendium of National Statistics on Women-Owned Businesses in the U.S. Executive Summary and Data Report
 A Compendium of National Statistics on Women-Owned Businesses in the U.S. Executive Summary and Data Report Prepared for National Women s Business Council September 2001 Table of Contents Introduction...1
Enterprise Florida Board of Director s Meeting. January 29, 2016 Tallahassee, Florida
 Enterprise Florida Board of Director s Meeting January 29, 2016 Tallahassee, Florida Welcome Alan Becker Board of Directors Vice Chair ROLL CALL Chairman s Welcome Governor Rick Scott Job Creator Awards
Toward A Stronger and More Resilient
 Toward A Stronger and More Resilient U.S.- Relationship 1 The unshakable U.S.- Alliance is the cornerstone of peace, prosperity, and freedom in the Asia-Pacific region. [The leaders of and the States]
Agricultural Trade Office The U.S. Embassy, Seoul
 Agricultural Trade Office The U.S. Embassy, Seoul www.atoseoul.com Data Source: Global Trade Atlas (www.gtis.com), CIF Value Basis, This presentation tracks Korea s imports of agricultural products on
2012 ACCE Industry Advisory Board Best Practices Positioning Your Firm After the Great Recession
 2012 ACCE Industry Advisory Board Best Practices Positioning Your Firm After the Great Recession 2012 FMI Corporation 0 The Great Recession 2012 FMI Corporation 1 FMI Corporation 2010 1 Market Truths You
Production and Value of Honey and Maple Products
 . Catalogue no. 23-221-X Agriculture Division Production and Value of Honey and Maple Products. 2007 Highlights Honey Canadian honey production in 2007 was 61.4 million pounds, over 40% less than 2006
2019 OXFORD EWE LAMB FUTURITY (Sponsored by the American Oxford Sheep Association, Inc.)
") 2019 OXFORD EWE LAMB FUTURITY (Sponsored by the American Oxford Sheep Association, Inc.) The American Oxford Sheep Association, Inc. ( AOSA ) is sponsoring its 10th annual ewe lamb youth futurity program
2019 OXFORD EWE LAMB FUTURITY (Sponsored by the American Oxford Sheep Association, Inc.) The American Oxford Sheep Association, Inc. ( AOSA ) is sponsoring its 10th annual ewe lamb youth futurity program
Missouri Economic Indicator Brief: Manufacturing Industries
 Missouri Economic Indicator Brief: Manufacturing Industries Manufacturing is a major component of Missouri s $293.4 billion economy. It represents 13.1 percent ($38.5 billion) of the 2015 Gross State Product
How New Jersey's Economy Benefits from International Trade & Investment
 How New Jersey's Economy Benefits from International Trade & Investment With more than 95 percent of the world s population and 80 percent of the world s purchasing power outside the United States, future
Production and Value of Honey and Maple Products
 . Catalogue no. 23-221-XIE Vol. 0, No 0 Agriculture Division Production and Value of Honey and Products. 2006 Highlights Honey Things were sweet for honey producers in 2006 as they reported having the
Production and Value of Honey and Maple Products
 Catalogue no. 23-221-X. Service bulletin Production and Value of Honey and Maple Products 2008. Highlights Honey Canada produced 62 million pounds of honey in 2008, which was one-tenth less than the 69
A Hiring Engine: A Breakdown of the Job Openings in Manufacturing
 A Hiring Engine: A Breakdown of the Job Openings in By Chad Moutray, Ph.D., CBE In many ways, manufacturing in America has never been doing better. The National Association of Manufacturers quarterly Manufacturers
Asia and Pacific Commission on Agricultural Statistics
 October 2012 Asia and Pacific Commission on Agricultural Statistics Twenty-fourth Session Da Lat, Viet Nam, 8-12 October 2012 Agenda Item 7 RURAL, AGRICULTURAL & FISHERY CENSUS IN VIETNAM 1 1 Prepared
2020 Census Local Update of Census Addresses. Operation (LUCA) Promotion
 Promotion") 2020 Census Local Update of Census Addresses Atlanta Regional Office Managing Census Operations in: AL, FL, GA, LA, MS, NC, SC Operation (LUCA) Promotion 2020 Census Overview What is LUCA? Agenda LUCA
2020 Census Local Update of Census Addresses Atlanta Regional Office Managing Census Operations in: AL, FL, GA, LA, MS, NC, SC Operation (LUCA) Promotion 2020 Census Overview What is LUCA? Agenda LUCA
India s Imported Fruit Market The Washington Apple Story
 India s Imported Fruit Market The Washington Apple Story Citrus Australia Market Outlook Forum 2018 Sydney, NSW. March 14, 2018 India s Imported Fruit Market The Washington Apple Story India: At A Glance
FORM G-37. Name of Regulated Entity: Public Resources Advisory Group, Inc. Report Period: Second Quarter of 2018
 Name of Regulated Entity: Public Resources Advisory Group, Inc. Report Period: Second Quarter of 2018 I. CONTRIBUTIONS made to officials of a municipal entity (list by state) Complete name, title (including
BEFORE THE BOARD OF COUNTY COMMISSIONERS OF DESCHUTES COUNTY, OREGON * * * *
 REVIEWED LEGAL COUNSEL For Recording Stamp Only BEFORE THE BOARD OF COUNTY COMMISSIONERS OF DESCHUTES COUNTY, OREGON An Ordinance Amending Deschutes County Code Title 18 to Provide a Definition of Agricultural
Production and Value of Honey and Maple Products
 Catalogue no. 23-221-X. Service bulletin Production and Value of Honey and Maple Products 2010. Highlights Honey In 2010, production of honey amounted to 74.3 million pounds, roughly 4.0 million pounds,
California Public-Safety Radio Association
 Association Orientation Note: This slide presentation is timed to run automatically. Or, you may press the Left or Right arrow keys to change slides. Thank You! CPRA is the Southern California chapter
Economic and Housing Market Outlook
 Economic and Housing Market Outlook By Lawrence Yun, Ph.D. Chief Economist, National Association of REALTORS Presentations At Raleigh Regional Association of REALTORS At Orange-Chatham Association of REALTORS
Economic & Housing Market Outlook
 Economic & Housing Market Outlook By Lawrence Yun, Ph.D. Chief Economist, National Association of REALTORS Presentations to NAR Annual Conference Boston, MA November 2, 2018 Existing Home Sales Since
Employer Location file. Codebook
 232 Employer Location file Codebook Number of Variables 2 Wednesday July 8 28 :9 PM 232 Employer Location file EMPV "RELEASE NUMBER" NUM(.) Release number Release : 7/28, SAS proc geocode and proc ginside
Summer Assignment for AP Environmental Science
 Summer Assignment for AP Environmental Science 1. Reading Writing Critically about Environmental Science Issues Read The Ghost Map and write a paper in which you focus on: How the water supply and delivery
BACCARAT: A LONGITUDINAL MICRO-STUDY
 BACCARAT: A LONGITUDINAL MICRO-STUDY FIELD RESULTS FROM ONE ATLANTIC CITY CASINO, JANUARY 2004 TO JUNE 2010 CENTER FOR GAMING RESEARCH, JULY 2010 Baccarat is the most important game in the world s biggest
SAN DIEGO S QUARTERLY ECONOMIC SNAPSHOT
 SAN DIEGO S QUARTERLY ECONOMIC SNAPSHOT December 2018 SAN DIEGO HIGHLIGHTS IN THIS ISSUE Every quarter San Diego Regional EDC analyzes key economic indicators that are important to understanding the regional
Brisbane. Cattle and beef industry projections workshop. Presented by: Len Steiner. Monday, 30 th of November, 2015
 Cattle and beef industry projections workshop 2015 - Brisbane Monday, 30 th of November, 2015 Presented by: Len Steiner Steiner Consulting Group, +1.603.424.9664 Main Discussion Points Today #1: Previous
economy City of Rohnert Park : Local Economic Report EDB Sonoma County
 EDB Sonoma County Economic Development Board economy 2010-11 City of Rohnert Park : Local Economic Report E c o n o m i c D e v e l o p m e n t B o a r d 4 0 1 C o l l e g e Av e n u e S u i t e D S a
Dollar Tree for Sale N. Monroe St. Tallahassee, FL
 Dollar Tree for Sale 3706 N. Monroe St. Tallahassee, FL Table of Contents FOR FURTHER INFORMATION Joe Boyd office 843.973.8283 mobile 843.906.7751 email joe@twinriverscap.com 3706 N. Monroe St. Tallahassee,
Tobacco Outlook. Electronic Outlook Report from the Economic Research Service. Tobacco Data from USDA
 United States Department of Agriculture Electronic Outlook Report from the Economic Research Service www.ers.usda.gov TBS-263 Oct. 24, 2007 Tobacco Outlook List of Tables -------------- Approved by the
THE U.S. SEMICONDUCTOR INDUSTRY:
 THE U.S. SEMICONDUCTOR INDUSTRY: KEY CONTRIBUTOR TO U.S. ECONOMIC GROWTH Matti Parpala 1 August 2014 The U.S. Semiconductor Industry: Key Contributor To U.S. Economic Growth August 2014 1 INTRO The U.S.
Event History Calendar (EHC) Between-Wave Moves File. Codebook
 Between-Wave Moves File. Codebook") 2325 Event History Calendar (EHC) BetweenWave Moves File Codebook Number of Variables 23 Thursday July 2 28 4:5 PM 2325 Event History Calendar (EHC) BetweenWave Moves File EHCV "RELEASE NUMBER" NUM(.)
2325 Event History Calendar (EHC) BetweenWave Moves File Codebook Number of Variables 23 Thursday July 2 28 4:5 PM 2325 Event History Calendar (EHC) BetweenWave Moves File EHCV "RELEASE NUMBER" NUM(.)
Dollar Tree for Sale N. Monroe St. Tallahassee, FL
 Dollar Tree for Sale 3706 N. Monroe St. Tallahassee, FL Table of Contents FOR FURTHER INFORMATION Joe Boyd office 843.973.8283 mobile 843.906.7751 email joe@twinriverscap.com 3706 N. Monroe St. Tallahassee,
Florida Field Naturalist
 Florida Field Naturalist PUBLISHED BY THE FLORIDA ORNITHOLOGICAL SOCIETY VOL. 33, NO. 1 FEBRUARY 2005 PAGES 1-27 Florida Field Naturalist 33(1):1-14, 2005. POPULATION GROWTH OF MONK PARAKEETS IN FLORIDA
TOBACCO QUOTA BUYOUT LEGISLATION: ECONOMIC IMPACTS IN THE SOUTHEAST
 TOBACCO QUOTA BUYOUT LEGISLATION: ECONOMIC IMPACTS IN THE SOUTHEAST Kelly J. Tiller, Burton C. English and R. Jamey Menard University of Tennessee 310 Morgan Hall 2621 Morgan Circle Knoxville, TN 37996-4519
2O2O WOMEN ON BOARDS GENDER DIVERSITY INDEX
 2O2O WOMEN ON BOARDS GENDER DIVERSITY INDEX 2018 Progress of Women Corporate Directors by Company Size, State and Industry Sector BOARDROOM DIVERSITY: A STRATEGIC IMPERATIVE WHAT IS THE GENDER DIVERSITY
Tobacco Outlook. Tom Capehart. Leaf Production Plummets With End Of Program. Electronic Outlook Report from the Economic Research Service
 United States Department of Agriculture Electronic Outlook Report from the Economic Research Service www.ers.usda.gov TBS-259 Sept. 23, 2005 Tobacco Outlook Tom Capehart Leaf Production Plummets With End
THE 3905 CENTURY CLUB, INC POINT AWARD APPLICATION (AND SUBSEQUENT 1000-POINT INCREMENTS) (EACH BAND/MODE SEPARATELY) (NOT ENDORSABLE)
 (EACH BAND/MODE SEPARATELY) (NOT ENDORSABLE)") THE 3905 CENTURY CLUB, INC. 2000-POINT AWARD APPLICATION (AND SUBSEQUENT 1000-POINT INCREMENTS) (EACH BAND/MODE SEPARATELY) (NOT ENDORSABLE) The requirements for the 2000-Point Award are simple. You just
THE 3905 CENTURY CLUB, INC. 2000-POINT AWARD APPLICATION (AND SUBSEQUENT 1000-POINT INCREMENTS) (EACH BAND/MODE SEPARATELY) (NOT ENDORSABLE) The requirements for the 2000-Point Award are simple. You just
Index Public Library Funding & Technology Access Study,
 Index Public Library Funding & Technology Access Study, 2010-2011 Discussions of urban, suburban, or rural libraries in the summary sections are indexed. Additional data for all types of metropolitan status
Is the scanned image stored as a color, grayscale, or black and white image? If applicable, what resolution is used?
 Topic: Trademarks, Trade names, Service marks Question by: Mandy Harlan/LA s IT staff Jurisdiction: Louisiana Date: 25 August 2010 Jurisdiction Question(s) Manitoba Corporations Canada Alabama Alaska Arizona
2018 Indiana VENTURE REPORT
 218 Indiana VENTURE REPORT Content Overview................................ 2 Indiana s Growing Economy................. 3 Indiana s Value for Business................. 3 National Venture Capital Trends..............
American Community Survey: Sample Design Issues and Challenges Steven P. Hefter, Andre L. Williams U.S. Census Bureau Washington, D.C.
 American Community Survey: Sample Design Issues and Challenges Steven P. Hefter, Andre L. Williams U.S. Census Bureau Washington, D.C. 20233 Abstract In 2005, the American Community Survey (ACS) selected
: Geocode File - Census Tract, Block-Group and Block. Codebook
 196815: Geocode File Census Tract, BlockGroup and Block Codebook Number of Variables 15 Friday June 17 8:49 AM 196815: Geocode File Census Tract, BlockGroup and Block RLS1 "RELEASE NUMBER" NUM(1.) Release
FORM G-37. Name of Regulated Entity: Public Resources Advisory Group, Inc. Report Period: Third Quarter of 2017
 Name of Regulated Entity: Public Resources Advisory Group, Inc. Report Period: Third Quarter of 2017 I. CONTRIBUTIONS made to officials of a municipal entity (list by state) Complete name, title (including
AC*. Alliance For Capital Access
 AC*. Alliance For Capital Access LEVERAGED BUYOUT SUCCESS STORIES 1919 Pennsylvania Avenue, N.W. Suite 701 Washington, DC 20006 202/429-9628 MaaneTek, Inc. Los Angeles, CA Five years ago, MagneTek existed
Bayport Securitisation (RF) Ltd Investor Report May 2013
 Ltd Investor Report May 2013") Bayport Securitisation (RF) Ltd Investor Report May 2013 Financial statistics for the period ended May 2013 May 13 Apr 13 Mar 13 Feb 13 Jan 13 Dec 12 Nov 12 Oct 12 Sep 12 Aug 12 Jul 12 Jun 12 Performance
Bayport Securitisation (RF) Ltd Investor Report May 2013 Financial statistics for the period ended May 2013 May 13 Apr 13 Mar 13 Feb 13 Jan 13 Dec 12 Nov 12 Oct 12 Sep 12 Aug 12 Jul 12 Jun 12 Performance
2008 Statistics and Projections to the Year Preliminary Data
 2008 Statistics and Projections to the Year 2025 2009 Preliminary Data Presented at the 92nd Annual Convention Honolulu, Hawaii August 4-7, 2010 Updated October 2010 Prepared by: Market Research & Statistics
Size of California s economy US$ trillions, 2009
 Size of California s economy US$ trillions, 2009 Rank Country Gross domestic product 1 United States 14 2 Japan 5.1 3 China 4.9 4 Germany 3.3 5 France 2.6 6 United Kingdom 2.2 7 44 Italy 2.1 8 California
Polling Question 1: What is the most important issue for job creation in California?
 Polling Question 1: What is the most important issue for job creation in California? 1. Improving state s regulatory climate 2. Increasing access to credit for small businesses 3. Retaining talent / developing
October 25, John Coleman, Executive Director Bay Planning Coalition
 October 25, 2012 John Coleman, Executive Director Bay Planning Coalition Northern California Port Data Port of Oakland 5 th busiest seaport in the nation 35 th busiest airport in the nation Economic Impacts
Ensuring an Accurate Count of the Nation s Latinos in Census 2020
 Ensuring an Accurate Count of the Nation s Latinos in Census 2020 February 15, 2018 Arturo Vargas Executive Director NALEO Educational Fund ARTICLE I, SECTION 2 Representatives and direct Taxes shall be
Girly Goats Hidden Springs Farm
 Girly Goats Hidden Springs Farm NEW THIS YEAR: Chicken Processing, Breadmaking, Advanced Soap Making, and MORE! Some classes also available ONLINE 2013 Workshop & Class Schedule Keep Learning... Benjamin
2017 Monarch Butterfly Conservation Fund Grant Slate
 2017 Monarch Butterfly Conservation Fund Grant Slate NFWF CONTACT Todd Hogrefe Director, Central Regional Office todd.hogrefe@nfwf.org 612-564-7286 PARTNERS Monarch butterflies ABOUT NFWF The National
The Florida Turnaround Story
 The Florida Turnaround Story In 2010, Florida was in a free fall. Florida lost more than 800,000 jobs, the real estate market had collapsed and tourism was on the decline. State debt had grown by about
Adopted March 17, 2009 (Ordinance 09-15)
") ECONOMIC ELEMENT of the PINELLAS COUNTY COMPREHENSIVE PLAN Prepared By: The Pinellas County Planning Department as staff to the LOCAL PLANNING AGENCY for THE BOARD OF COUNTY COMMISSIONERS OF PINELLAS COUNTY,
ECONOMIC ELEMENT of the PINELLAS COUNTY COMPREHENSIVE PLAN Prepared By: The Pinellas County Planning Department as staff to the LOCAL PLANNING AGENCY for THE BOARD OF COUNTY COMMISSIONERS OF PINELLAS COUNTY,
Completeness of Birth Registration
 Vol. 33 A,S Completeness of Birth Registration in the United States in 1940 ROBERT F. LENHART, M.S.P.A. Chief, Vital Statistics Consulting Service, Division of Vital Statistics, Bureau of the Census, Suitland,
Real Estate Trends and Outlook
 Real Estate Trends and Outlook Lawrence Yun, Ph.D. Chief Economist NATIONAL ASSOCIATION OF REALTORS Presentation at NAR Region XII Conference Coeur d Alene, ID March 5, 2015 GDP Burst in 2014 Q2, Q3, Q4
Alternate Assessment Coordinators County Name Address/Phone/Fax
 Alachua Regina Currens 1817 E. University Ave. Gainesville, FL 32601 Phone: (352)955-7671 Ext: 1630 Fax: (352)955-7129 currenrm@gm.sbac.edu Baker Lara Manalo 290 Jonathan Street E Macclenny, FL 32063 Phone:
Removing Duplication from the 2002 Census of Agriculture
 Removing Duplication from the 2002 Census of Agriculture Kara Daniel, Tom Pordugal United States Department of Agriculture, National Agricultural Statistics Service 1400 Independence Ave, SW, Washington,
DIRECTORATE FOOD SAFETY AND QUALITY ASSURANCE
 DIRECTORATE FOOD SAFETY AND QUALITY ASSURANCE AGRICULTURAL PRODUCT ACT, 1990 (ACT No. 119 OF 1990) LIST OF PUBLISHED, AND REQUIREMENTS LAST UPDATE: March 2017 Codes E = Export L = Local @ Administered
Private Equity: Top States and Districts in
 Private Equity: Top States and Districts in 2015 www.investmentcouncil.org 2 Top 20 states receiving private equity investment in 2015 $12 $87 $18 $13 $13 $12 $95 $12 $14 $16 $24 $15 $18 $57 $15 $16 $9
Legislative Joint Transportation Committee Meeting. Arkansas Convention Center Texarkana Thursday, November 21, 2013
 Arkansas State Highway and Transportation Department Legislative Joint Transportation Committee Meeting Arkansas Convention Center Texarkana Thursday, November 21, 2013 Recent Voter Approved Programs November
Copyright March, Published by:
 Republic of Trinidad & Tobago Ministry of Planning and Development Central Statistical Office in collaboration with The Ministry of Agriculture, Land & Marine Resources 2004 AGRICULTURAL CENSUS Published
Concern for Community
 Valued Patrons + A Cooperative s Principles Equity Cooperative Livestock Sales Association = Family Values Education, Training and Information Your Contributions Count Working Together Open to All People
Economic & Real Estate Outlook. Tax Reform. Michigan 4/26/18
 Economic & Real Estate Outlook By Lawrence Yun, Ph.D. Chief Economist, National Association of REALTORS Presentations at Michigan REALTORS Broker Summit Plymouth, MI April 25, 2018 Tax Reform Mortgage
A S TATE OF ACHIE V EMENT. West Virginia s welcoming business climate
 A S TATE OF ACHIE V EMENT West Virginia s welcoming business climate The Development Office was terrific. There was complete transparency, which builds a lot of confidence that you re working with an organization
1 HB By Representatives Boothe, Clouse, Rowe and Martin. 4 RFD: State Government. 5 First Read: 02-MAR-17. Page 0
 1 HB354 2 183292-1 3 By Representatives Boothe, Clouse, Rowe and Martin 4 RFD: State Government 5 First Read: 02-MAR-17 Page 0 1 183292-1:n:03/01/2017:MA/mfc LRS2017-868 2 3 4 5 6 7 8 SYNOPSIS: Under existing
Bayport Securitisation (RF) Ltd Investor Report February 2013
 Ltd Investor Report February 2013") Bayport Securitisation (RF) Ltd Investor Report February 2013 Financial statistics for the period ended February 2013 Feb 13 Jan 13 Dec 12 Nov 12 Oct 12 Sep 12 Aug 12 Jul 12 Jun 12 May 12 Apr 12 Mar 12
Bayport Securitisation (RF) Ltd Investor Report February 2013 Financial statistics for the period ended February 2013 Feb 13 Jan 13 Dec 12 Nov 12 Oct 12 Sep 12 Aug 12 Jul 12 Jun 12 May 12 Apr 12 Mar 12
Background Population Exposure Estimates Using E. coli O157 Case Interviews
 Background ulation Exposure Estimates Using E. coli O157 Case Interviews INTRODUCTION/INTENDED USE The following data comprise exposure frequencies for sporadic culture-confirmed Escherichia coli O157
Capital Street Business News Institutional Investors. FIG Media Corporation Institutional Investors
 Capital Street Business News Institutional Investors FIG Media Corporation Institutional Investors European and United States Investment Banker Limited Partner Shareholder Contracts Hiram R. Davis Founding
BAYPORT SECURITISATION (RF) LTD INVESTOR REPORT DECEMBER 2014
 LTD INVESTOR REPORT DECEMBER 2014") BAYPORT SECURITISATION (RF) LTD INVESTOR REPORT DECEMBER 2014 Financial statistics for the period ended December 2014 Dec 14 Nov 14 Oct 14 Sept 14 Aug 14 Jul 14 Jun 14 May 14 Apr 14 Mar 14 Feb 14 Jan 14
BAYPORT SECURITISATION (RF) LTD INVESTOR REPORT DECEMBER 2014 Financial statistics for the period ended December 2014 Dec 14 Nov 14 Oct 14 Sept 14 Aug 14 Jul 14 Jun 14 May 14 Apr 14 Mar 14 Feb 14 Jan 14
Florida Department of Education Office of Educational Facilities Charter School FCO Allocations Final Enrollment Data from FY
 ALACHUA DSB 950 THE ONE ROOM SCHOOL HOUSE PROJ 148 - - 8,514 8,514 ALACHUA DSB 951 MICANOPY AREA COOPERATIVE SCHL 120 - - 6,903 6,903 ALACHUA DSB 953 CARING & SHARING LEARNING SCH 108 - - 6,213 6,213 ALACHUA
ECONOMIC SNAPSHOT. A Summary of the San Diego Regional Economy UNEMPLOYMENT
 A Summary of the San Diego Regional Economy UNEMPLOYMENT San Diego Regional EDC analyzes key economic metrics that are important to understanding the regional economy and San Diego's standing relative
Active Cable TV Connections. Active Residential Cable Modem Customers. Page FIRST QUARTER REPORT
 21-22 FIRST QUARTER REPORT Active Cable TV Connections AFN Cable connections in the business plan are projected to be 2,44 by July 22. As of October 31, 21, there are 1,895 connections, which means AFN
Display Advertising Networks - National Rate Sheet
 Alabama 2x2 $1,000 127 893,708 Monday, 5pm North 2x2 $400 46 393,125 Central 2x2 $400 40 302,717 South 2x2 $400 41 197,866 2x2-2 regions $750 Retail Network 2x3: 1 region $600, 2 regions, $1,100, statewide