Vegetation Transect Monitoring Method
|
|
|
- Eleanor Turner
- 6 years ago
- Views:
Transcription


1 Vegetation Transect Monitoring Method GREAT OCEAN ROAD COAST COMMITTEE March

2 ACKNOWLEDGEMENTS Beacon Ecological would like to acknowledge the following for their contribution to the project: Alex Sedger and Georgie Beale (Great Ocean Road Coast Committee) for reviewing the methodology. Beacon Ecological 3 Menczer Lane Jan Juc Victoria luke@beaconecological.com.au Web: ABN: Report Version: FINAL V1 28 April 2015 Field assessment: Luke Hynes Report: Luke Hynes Photography: Luke Hynes Review: Jane Currie Cover Photo: Transect monitoring tools. DISCLAIMER The author advises that the information presented in this report, including any management advice, has been prepared with all due diligence and care, and based on the best available knowledge and research. However the author takes no responsibility for any loss, injury or financial damage resulting from the reliance and/or application of management advice provided in the report. 2
3 TABLE OF CONTENTS TABLE OF CONTENTS INTRODUCTION DATA COLLECTION METHODOLOGY PLACEMENT OF TRANSECTS FIELD SETUP AND DATA COLLECTION DATA MANAGEMENT EVALUATING DATA... 9 REFERENCES APPENDIX
4 1 INTRODUCTION The 2015 review of the Great Ocean Road Coast Committee (GORCC) Native Vegetation and Weed Action Plan (Beacon Ecological 2015) includes recommendations for vegetation monitoring to assist determining the effectiveness of weed control on GORCC managed land. The monitoring program was to be robust enough to determine changes in vegetation composition, particularly levels of weed infestation. It also had to be easy to use, and able to be implemented by GORCC conservation team members. A review of suitable monitoring tools was undertaken with permanent pseudo-randomised line intercept transects and photopoints as per Monitoring manual for Bitou Bush control and native plant recovery (Hughes et al 2009) determined to the best meet the monitoring requirements. The transect assessments monitor shrub species only to allow for rapid and simple assessment and evaluation. Photopoints were also established at one end of each transect. Graphs and photopoints of 2015 assessments are provided in Appendix 1 of this report. 2 DATA COLLECTION METHODOLOGY The methodology has been separated into several sections including: 1. Placement of transects: How to set up transects using a pseudo-randomised transect methodology to ensure objective data collection. 2. Field Set Up and Data Collection: Details equipment required and how to collect data. 3. Data Management: How to collate the data and enter it into a form ready to be evaluated. 2.1 PLACEMENT OF TRANSECTS Sampling units need to be placed without bias to account for the variation present across monitoring sites. Transects have been placed using a pseudo-random placement, using existing tracks within sites to be monitored as a base transect. Pseudo-random placement is determined by randomly placing transects at right angles along the track using a random number generator to determine transect distances. See Figure 1 for an example pseudo-random placement. Transects have been oriented to run parallel to any gradients on the site, such as slope, i.e. transects would run up or down the slope. Variability on the site is then encompassed within each transect, rather than between transects. Transects have been placed to also run parallel to one another to ensure they do not sample the same area. 4


.")

5 35 m 41 m 50 m transect 81 m 77 m Figure 1. Example pseudo-random transect placement on the Jan Juc Clifftops. Note that a random number generator has been used to determine distances to place transects along the track. 2.2 FIELD SETUP AND DATA COLLECTION Office component 1. Print out maps and GPS points of previously established transects to be monitored. 2. Collect the following items: a. Printed data sheets (See Appendix 1). Note that you will need a separate data sheet for each transect. b. Clipboard. c. Compass. d. Pens. e. Camera. f. Plant identification guide. g. Plastic bags for plant samples to identify plants back in the office if required. h. 50 metre tape measure. i. Spare star pickets (length 50 centimetres). j. Mallet for driving in any missing star pickets. 5
 or a star picket. Plate 1.")
6 Field component: 1. Locate the start and end point your transect in the field using your site map and a GPS receiver or tape measure. Start points of transects have been marked with copper tag on the back of a fence post when starting on fence lines (Plate 1) or a star picket. Plate 1. Copper tag on rear of post to identify transect, 2. Complete the top section of the datasheet which contain the site and transect information. 3. Run tape measure between start and end points. 4. Walk along the transect and record the beginning and end values of the intercept of each shrub species (both native and introduced) as it occurs on a vertical projection of the tape measure, (See Figure 2), stopping at the predetermined end point. 5. Record the species name and actual start and end tape measure values in the Intercepts column (See Figure 3 for example sheet). The actual distance between them goes into the total length column. Note: Overlapping cover of the same species should not be counted twice, but should be recorded as continuous cover. Gap of less than 10 cm of the same species are considered to be continuous cover (See measurement d in Figure 2). 6
. 6.")

7 Figure 2. Example sampling transect. Note that target species can overlap cover on the transect. Also note that measurement d is continuous as the gap between the foliage of two plants of the one species is less than 10 centimetres (Source Hughes et al. 2009). 6. Ensure you record the entire intercept length irrespective of any canopy overlap by a different species. 7. Calculate the Total length (m) of each intercept. 2.3 DATA MANAGEMENT Figure 3. Example completed data sheet. Data should be entered electronically into the data spreadsheet as soon as possible after collection. Line-intercept transects can be used to determine the percentage cover of target weeds and other plants in your monitoring area. To calculate the percentage cover using collected data: 1. Sum the individual cover distances for an individual species over the transect. 7
8 2. Divide this total cover distance by the total transect length to calculate the proportion of the transect covered by a species. 3. Multiply this value by 100 to calculate the percentage cover for the transect. For example, take the individual distances for a Target Species A from Figure 2 (total transect length of 10 m): a = 0.5 m 1.3 m = 0.8 m b = 1.8 m 3.0 m = 1.2 m c = 3.3 m 5.0 m = 1.7 m d = 6.5 m 8.6 m = 2.1 m e = 9.3 m 10.0 m = 0.7 m The formula to calculate the percentage cover is: % cover = (Distance a + b + c + d + e) 100%/ total length of transect For the example above the percentage cover of the target species is: % cover = ( ) 100%/ 10 = 65% Repeat this calculation for all species within the quadrat and input them into the spreadsheet GORCC Transect Monitoring.xls with the date of data collection. 8

9 3 EVALUATING DATA To evaluate the data once entered into the excel spread sheet the data needs to be analysed and then graphed. 3.1 ANALYSING DATA Averages To analyse the data, the average of each species across the transects at a site needs to be derived. Use the AVERAGE excel function to do this as in Figure 4. This provides the average cover of each species within the sampled area. If new species are recorded in subsequent years of monitoring these will need to be added to the spreadsheet. Additional years of monitoring added this way Figure 4. Calculating the average cover of recorded species. Standard Deviation Standard deviation is also useful to know when looking at averages. The standard deviation is a measure of how spread out the numbers are that make up your average. In this case, a low standard deviation signifies the cover of a species across the transects are all close to the average. A higher standard deviation signifies that the cover values of each species are spread out. The standard deviation can 9


10 indicate how evenly distributed species are across the sample area. Generally, 68% of all values will be located within one standard deviation of the average, 95% within two and 99.7% within three. Use the standard deviation function from excel as in Figure 5 below. Figure 5. Calculating the standard deviation of the cover of recorded species. Repeat these steps for all subsequent monitoring events, moving right across the spreadsheet. 3.2 GRAPHING THE DATA This section outlines how to graph the data to view changes in cover over time. 1. Select the data required to be graphed then select insert column chart from the chart menu: 2. A graph showing the selected data should then appear. Colours, styles and labels of the graph can then be altered by selecting graph features and editing them. 3. To add the standard deviation to the graph right click on the columns and select Format Data Series. 4. Select Error Bars, then Both from the Display category and Cap from the End style category (Figure 6). 5. Select Custom from the Error Amount category and click Specify Value. 10

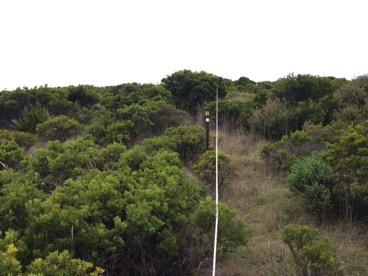
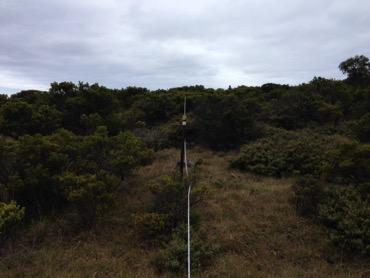
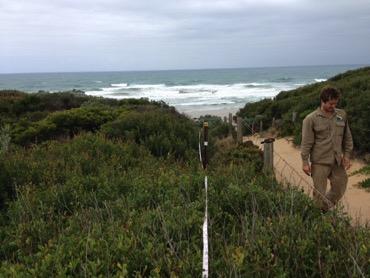
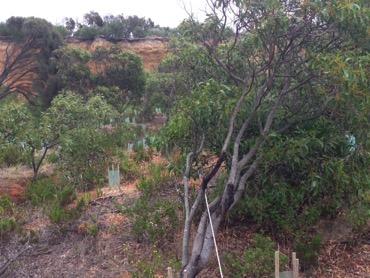
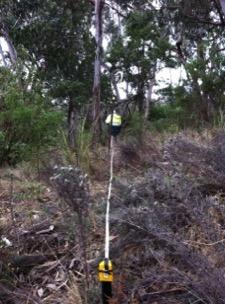
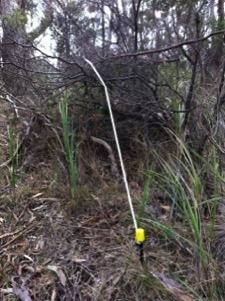
11 6. For both the Positive Error Value and Negative Error Value select the standard deviation calculated for the averages from the spread sheet. The standard error should now be shown on each bar value of the graph. 4 PHOTOPOINTS Figure 6. Format data series. Permanent photopoints were established at each transect by hammering a star-picket into the ground five metres from one end of the transect. The star picket is the photopoint reference and is positioned in the centre of the photo. A white band was placed on each reference picket at approximately one metre above ground level as a height reference. Photos were taken from approximately 165 centimetres above ground level. Photopoint photos are provided in Appendix 3 of this documents and as.jpg files. REFERENCES Beacon Ecological Great Ocean Road Coast Committee Native Vegetation and Weed Action Plan. Unpublished report for the Great Ocean Road Coast Committee. Hughes, NK, Burley, AL, King, SA and Downey, PO 2009 Monitoring manual for bitou bush control and native plant recovery, Department of Environment, Climate Change and Water NSW, Hurstville. 11
12 APPENDICES 12
13 APPENDIX 1. DATA RECORDING SHEET 13
14 Line Intercept Transect Field Datasheet Site ID Site Name Observers Date Transect Number Transect Length Transect Orientation ( ) GPS Location Position Target Species Intercepts (start and end measurements) Total Length (m) 14
15 Target Species Intercepts (start and end measurements) Total Length (m) 15
16 4.1 APPENDIX 2. GRAPHED DATA FROM 2015 MONITORING 16
17 17
18 18


19 APPENDIX 2. PHOTOPOINTS FROM 2015 MONITORING. Point Impossible Carpark Monitoring site Transect 1. Transect 2. Transect 3. Transect 4. Jan Juc Clifftops Monitoring site 19


20 Transect 1. Transect 2. Transect 3. Transect 4. O Donohues Monitoring site 20


21 Transect 1. Transect 2. Transect 3. Transect 4. Soapy Rocks Monitoring site Transect 1. Transect 2. 21


22 Transect 3. Transect 4. Split Point West Monitoring site Transect 1. Transect 2. 22


23 Transect 3. Transect 4. Queens Park Monitoring site Transect 1. Transect 2. 23

24 Transect 3. Transect 4. 24
Photo Grid Analysis. Concept
 Photo Grid Analysis Concept Changes in vegetation, soil, fuel loading, streambanks, or other photographed items can be monitored by outlining the items on a clear plastic sheet that is then placed over
A To draw a line graph showing the connection between the time and cost
 Hire a coach In this activity you will use Excel to draw line graphs which show the connection between variables in real situations. You will also study how features of the graphs are related to the information
Write a spreadsheet formula in cell A3 to calculate the next value of h. Formulae
 Hire a coach In this activity you will use Excel to draw line graphs which show the connection between variables in real situations. You will also study how features of the graphs are related to the information
Step 1: Set up the variables AB Design. Use the top cells to label the variables that will be displayed on the X and Y axes of the graph
 Step 1: Set up the variables AB Design Use the top cells to label the variables that will be displayed on the X and Y axes of the graph Step 1: Set up the variables X axis for AB Design Enter X axis label
Grassland Bird Survey Protocol Sauvie Island Wildlife Area
 Grassland Bird Survey Protocol Sauvie Island Wildlife Area Project Objective: Help determine if native grassland bird species are benefiting from restoration of grassland/pasture habitats at the Sauvie
SURNAME... FIRST NAME... (Block capitals, please) JUNIOR SCHOOL... SENIOR SCHOOL... COMMON ENTRANCE EXAMINATION AT 11+ MATHEMATICS
 JUNIOR SCHOOL... SENIOR SCHOOL... COMMON ENTRANCE EXAMINATION AT 11+ MATHEMATICS") SURNAME... FIRST NAME... (Block capitals, please) JUNIOR SCHOOL... SENIOR SCHOOL... COMMON ENTRANCE EXAMINATION AT 11+ MATHEMATICS Monday 16 January 2006 Please read this information before the examination
SURNAME... FIRST NAME... (Block capitals, please) JUNIOR SCHOOL... SENIOR SCHOOL... COMMON ENTRANCE EXAMINATION AT 11+ MATHEMATICS Monday 16 January 2006 Please read this information before the examination
Graphing Guidelines. Controlled variables refers to all the things that remain the same during the entire experiment.
 Graphing Graphing Guidelines Graphs must be neatly drawn using a straight edge and pencil. Use the x-axis for the manipulated variable and the y-axis for the responding variable. Manipulated Variable AKA
NCSS Statistical Software
 Chapter 147 Introduction A mosaic plot is a graphical display of the cell frequencies of a contingency table in which the area of boxes of the plot are proportional to the cell frequencies of the contingency
2014/15 Season. Muttonbird Monitoring on Aboriginal Islands Shaun Thurstans. Land Management Program, Tasmanian Aboriginal Centre.
 2014/15 Season. Muttonbird Monitoring on Aboriginal Islands Shaun Thurstans. Land Management Program, Tasmanian Aboriginal Centre. Species Targeted: Short-tailed Shearwater (Puffinus tenuirostris), (Muttonbird).
Where are the Birds? Urban Birds in a Heat Island
 Where are the Birds? Urban Birds in a Heat Island Objectives: Students will be able to: 1. propose a relationship for how urban heat island might affect birds. 2. test whether schoolyard microclimates
GCSE Mathematics Calculator Foundation Tier Mock 3, paper 2 1 hour 45 minutes. Materials needed for examination
 First Name Last Name Date Total Marks / 100 marks MathsMadeEasy GCSE Mathematics Calculator Foundation Tier Mock 3, paper 2 1 hour 45 minutes 3 Instructions Write your name and other details in the boxes
Assessing Measurement System Variation
 Example 1 Fuel Injector Nozzle Diameters Problem A manufacturer of fuel injector nozzles has installed a new digital measuring system. Investigators want to determine how well the new system measures the
Geo-Conservation and Geo-Tourism
 UNIVERSITY OF CANTERBURY & FRONTIERS ABROAD APPENDIX Geo-Conservation and Geo-Tourism Panama Rock Banks Peninsula Ailan Hurley, Natalie Smith, Olivia Watkins, Sam Davidson 10/13/2014 1 Appendix A: Photos
A Rapid Photo Point Monitoring Method
 A Rapid Photo Point Monitoring Method Pat Reece, Prairie & Montane Enterprises patreece@prairieme.com Tonya Haigh, National Drought Mitigation Center thaigh2@unl.edu Goal: To document the effects that
Assessing Measurement System Variation
 Assessing Measurement System Variation Example 1: Fuel Injector Nozzle Diameters Problem A manufacturer of fuel injector nozzles installs a new digital measuring system. Investigators want to determine
Numerical: Data with quantity Discrete: whole number answers Example: How many siblings do you have?
 Types of data Numerical: Data with quantity Discrete: whole number answers Example: How many siblings do you have? Continuous: Answers can fall anywhere in between two whole numbers. Usually any type of
Paper 1. Calculator not allowed. Mathematics test. First name. Last name. School. Remember KEY STAGE 3 TIER 5 7
 Ma KEY STAGE 3 Mathematics test TIER 5 7 Paper 1 Calculator not allowed First name Last name School 2007 Remember The test is 1 hour long. You must not use a calculator for any question in this test. You
First Practice Test 1 Levels 5-7 Calculator not allowed
 Mathematics First Practice Test 1 Levels 5-7 Calculator not allowed First name Last name School Remember The test is 1 hour long. You must not use a calculator for any question in this test. You will need:
MONITORING AND EVALUATION PLAN
 MONITORING AND EVALUATION PLAN Title: Monitoring and Evaluation Plan for Far and Away Islands, Republic of Pacifica Authors: V. Reed (NPC) Reviewers: R. View (Moore Consulting) Version History: VERSION
Servo Closed Loop Speed Control Transient Characteristics and Disturbances
 Exercise 5 Servo Closed Loop Speed Control Transient Characteristics and Disturbances EXERCISE OBJECTIVE When you have completed this exercise, you will be familiar with the transient behavior of a servo
AUTUMN 2016 GCSE 9-1 MOCK FOUNDATION PAPER 1 ALTERNATIVE VERSION
 AUTUMN 2016 GCSE 9-1 MOCK FOUNDATION PAPER 1 ALTERNATIVE VERSION This version was kindly put together by Graham Cumming at Edexcel and some of the questions have been adapted to strip out the sums as part
Sections Descriptive Statistics for Numerical Variables
 Math 243 Sections 2.1.2-2.2.5 Descriptive Statistics for Numerical Variables A framework to describe quantitative data: Describe the Shape, Center and Spread, and Unusual Features Shape How is the data
PASS Sample Size Software
 Chapter 945 Introduction This section describes the options that are available for the appearance of a histogram. A set of all these options can be stored as a template file which can be retrieved later.
Thursday 2 November 2017 Morning Time allowed: 1 hour 30 minutes
 Please write clearly in block capitals. Centre number Candidate number Surname Forename(s) Candidate signature GCSE MATHEMATICS Foundation Tier Paper 1 Non-Calculator F Thursday 2 November 2017 Morning
ESTABLISHMENT AND MONITORING OF PERMANENT LICHEN QUADRATS AT KAWERUA, NORTHLAND, NEW ZEALAND. by Roger V. Grace* and Glenys C.
 TANE 24, 1978 ESTABLISHMENT AND MONITORING OF PERMANENT LICHEN QUADRATS AT KAWERUA, NORTHLAND, NEW ZEALAND by Roger V. Grace* and Glenys C. Haywardf *274a Birkdale Road, Birkenhead, Auckland 10 135 Trafalgar
Specifications for Post-Earthquake Precise Levelling and GNSS Survey. Version 1.0 National Geodetic Office
 Specifications for Post-Earthquake Precise Levelling and GNSS Survey Version 1.0 National Geodetic Office 24 November 2010 Specification for Post-Earthquake Precise Levelling and GNSS Survey Page 1 of
Product design: Communicating your design proposals
 Product design: Communicating your design proposals In the world of business and industry design proposals can only be turned into saleable products if the designers communicate their proposals effectively.
How to define Graph in HDSME
 How to define Graph in HDSME HDSME provides several chart/graph options to let you analyze your business in a visual format (2D and 3D). A chart/graph can display a summary of sales, profit, or current
Migratory Bird Math and Science Lessons
 Hubbard Brook Research Foundation Least Flycatcher/Robert Royse Lesson: Hunt and Peck N eotropical migratory birds make use of a variety of foods throughout their life cycle, yet every year they migrate
Student Exploration: Quadratics in Factored Form
 Name: Date: Student Exploration: Quadratics in Factored Form Vocabulary: factored form of a quadratic function, linear factor, parabola, polynomial, quadratic function, root of an equation, vertex of a
Mathematics Paper 1 (Non-Calculator)
") Write your name here Surname Other names Pearson Edexcel Level 1/Level 2 GCSE (9-1) Centre Number Candidate Number Mathematics Paper 1 (Non-Calculator) Mock Set 1 Autumn 2016 Time: 1 hour 30 minutes Higher
Write your name here Surname Other names Pearson Edexcel Level 1/Level 2 GCSE (9-1) Centre Number Candidate Number Mathematics Paper 1 (Non-Calculator) Mock Set 1 Autumn 2016 Time: 1 hour 30 minutes Higher
PASS Sample Size Software. These options specify the characteristics of the lines, labels, and tick marks along the X and Y axes.
 Chapter 940 Introduction This section describes the options that are available for the appearance of a scatter plot. A set of all these options can be stored as a template file which can be retrieved later.
How to Make a Run Chart in Excel
 How to Make a Run Chart in Excel While there are some statistical programs that you can use to make a run chart, it is simple to make in Excel, using Excel s built-in chart functions. The following are
CHM 109 Excel Refresher Exercise adapted from Dr. C. Bender s exercise
 CHM 109 Excel Refresher Exercise adapted from Dr. C. Bender s exercise (1 point) (Also see appendix II: Summary for making spreadsheets and graphs with Excel.) You will use spreadsheets to analyze data
CHAPTER 6 PROBABILITY. Chapter 5 introduced the concepts of z scores and the normal curve. This chapter takes
 CHAPTER 6 PROBABILITY Chapter 5 introduced the concepts of z scores and the normal curve. This chapter takes these two concepts a step further and explains their relationship with another statistical concept
Investigation. Triangle, Triangle, Triangle. Work with a partner.
 Investigation Triangle, Triangle, Triangle Work with a partner. Materials: centimetre ruler 1-cm grid paper scissors Part 1 On grid paper, draw a large right triangle. Make sure its base is along a grid
MATHEMATICAL FUNCTIONS AND GRAPHS
 1 MATHEMATICAL FUNCTIONS AND GRAPHS Objectives Learn how to enter formulae and create and edit graphs. Familiarize yourself with three classes of functions: linear, exponential, and power. Explore effects
3301/2I. MATHEMATICS (SPECIFICATION A) 3301/2I Intermediate Tier Paper 2 Calculator. General Certificate of Secondary Education June 2004
 3301/2I Intermediate Tier Paper 2 Calculator. General Certificate of Secondary Education June 2004") Surname Other Names Leave blank Centre Number Candidate Number Candidate Signature General Certificate of Secondary Education June 2004 MATHEMATICS (SPECIFICATION A) 3301/2I Intermediate Tier Paper 2 Calculator
Surname Other Names Leave blank Centre Number Candidate Number Candidate Signature General Certificate of Secondary Education June 2004 MATHEMATICS (SPECIFICATION A) 3301/2I Intermediate Tier Paper 2 Calculator
Laboratory 1: Motion in One Dimension
 Phys 131L Spring 2018 Laboratory 1: Motion in One Dimension Classical physics describes the motion of objects with the fundamental goal of tracking the position of an object as time passes. The simplest
Unit 3 Phenology LESSON OUTLINE: OUTCOMES: GRADUATION STANDARDS: KEY CONCEPTS: and abiotic factors can change over time.
 Unit 3 Phenology Unit 3 Phenology LESSON OUTLINE: I. January to June multi-year Outdoor Phenological Study: a collection of observations that students will use to compare current to previous years data.
Forced Perspective Photography Structured Inquiry
 Forced Perspective Photography Structured Inquiry Question: Can we define the relationships between objects and the camera in Forced Perspective Photography mathematically? Part 1: Locate photos 1 3 and
GCSE Mathematics Practice Tests: Set 1
 GCSE Mathematics Practice Tests: Set 1 Paper 3H (Calculator) Time: 1 hour 30 minutes You should have: Ruler graduated in centimetres and millimetres, protractor, pair of compasses, pen, HB pencil, eraser,
Using column addition, keep the decimal points aligned one beneath the other to keep the correct place value of the digits.
 Q1-5. Using column addition, keep the decimal points aligned one beneath the other to keep the correct place value of the digits. Q1. 1. 6 3 8. 2 + 3. 2 5 4 3. 0 5 [1.6 + 38.2 + 3.25 = 43.05] Q2. 0. 1
Surveying For Red & Grey Squirrels in Northern England: Methodologies
 Surveying For & Squirrels in Northern England: Methodologies 1 Introduction Squirrels Northern England will establish a program of standardised red and grey squirrel monitoring at selected sites across
Data Analysis Part 1: Excel, Log-log, & Semi-log plots
 Data Analysis Part 1: Excel, Log-log, & Semi-log plots Why Excel is useful Excel is a powerful tool used across engineering fields. Organizing data Multiple types: date, text, numbers, currency, etc Sorting
Teacher s notes Induction of a voltage in a coil: A set of simple investigations
 Faraday s law Sensors: Loggers: Voltage An EASYSENSE capable of fast recording Logging time: 200 ms Teacher s notes Induction of a voltage in a coil: A set of simple investigations Read This activity is
Patterns and Graphing Year 10
 Patterns and Graphing Year 10 While students may be shown various different types of patterns in the classroom, they will be tested on simple ones, with each term of the pattern an equal difference from
FlowPhase Examples Page 1 of 15. Table of Contents
 FlowPhase Examples Page 1 of 15 Table of Contents 1. VLE Flash... 2 1.1 Basic Input... 2 1.2 Entering Components... 3 1.3 Entering mol fractions... 3 1.4 Performing a flash... 4 1.5 Changing Units... 4
Sensor Calibration Lab
 Sensor Calibration Lab The lab is organized with an introductory background on calibration and the LED speed sensors. This is followed by three sections describing the three calibration techniques which
Sensor Calibration Lab
 Sensor Calibration Lab The lab is organized with an introductory background on calibration and the LED speed sensors. This is followed by three sections describing the three calibration techniques which
Tennessee Senior Bridge Mathematics
 A Correlation of to the Mathematics Standards Approved July 30, 2010 Bid Category 13-130-10 A Correlation of, to the Mathematics Standards Mathematics Standards I. Ways of Looking: Revisiting Concepts
Lecture Slides. Elementary Statistics Twelfth Edition. by Mario F. Triola. and the Triola Statistics Series. Section 2.2- #
 Lecture Slides Elementary Statistics Twelfth Edition and the Triola Statistics Series by Mario F. Triola Chapter 2 Summarizing and Graphing Data 2-1 Review and Preview 2-2 Frequency Distributions 2-3 Histograms
Physics 253 Fundamental Physics Mechanic, September 9, Lab #2 Plotting with Excel: The Air Slide
 1 NORTHERN ILLINOIS UNIVERSITY PHYSICS DEPARTMENT Physics 253 Fundamental Physics Mechanic, September 9, 2010 Lab #2 Plotting with Excel: The Air Slide Lab Write-up Due: Thurs., September 16, 2010 Place
Example: Your Name (instead of contestant number) / Job 1
 / Job 1") BPA PROJECT Advanced Spreadsheet Applications ASA Description: Finished Product: This project is based on the Advanced Spreadsheet Applications event; it consists of creating a spreadsheet with multiple
BPA PROJECT Advanced Spreadsheet Applications ASA Description: Finished Product: This project is based on the Advanced Spreadsheet Applications event; it consists of creating a spreadsheet with multiple
GCSE MATHEMATICS (LINEAR) Foundation Tier Paper 2. Morning (JUN F01)
 Foundation Tier Paper 2. Morning (JUN F01)") Please write clearly in block capitals. Centre number Candidate number Surname Forename(s) Candidate signature GCSE F MATHEMATICS (LINEAR) Foundation Tier Paper 2 Thursday 9 June 2016 Materials For this
Please write clearly in block capitals. Centre number Candidate number Surname Forename(s) Candidate signature GCSE F MATHEMATICS (LINEAR) Foundation Tier Paper 2 Thursday 9 June 2016 Materials For this
This lab is to be completed using University computer labs in your own time.
 College of Natural Resources Department of Forest Resources Forest Measurements and Inventory Laboratory 3 Part 1: Introduction to Excel The objectives of this laboratory exercise are to: Become familiar
Situations Involving Multiplication and Division with Products to 50
 Mathematical Ideas Composing, decomposing, addition, and subtraction of numbers are foundations of multiplication and division. The following are examples of situations that involve multiplication and/or
GCSE Mathematics Practice Tests: Set 2
 GCSE Mathematics Practice Tests: Set 2 Paper 2F (Calculator) Time: 1 hour 30 minutes You should have: Ruler graduated in centimetres and millimetres, protractor, pair of compasses, pen, HB pencil, eraser,
Paper 1. Calculator not allowed. Mathematics test. First name. Last name. School. Remember KEY STAGE 3 TIER 6 8
 Ma KEY STAGE 3 Mathematics test TIER 6 8 Paper 1 Calculator not allowed First name Last name School 2007 Remember The test is 1 hour long. You must not use a calculator for any question in this test. You
INSTALLATION GUIDE DUOFUSE SLAT WALL SYSTEM
 06/2013 ENG 1 INSTALLATION GUIDE DUOFUSE SLAT WALL SYSTEM The Duofuse wood composite slat wall system is much more durable than wooden fences, and correct installation is necessary to enjoy the fences
Excel / Education. GCSE Mathematics. Paper 5B (Calculator) Higher Tier. Time: 2 hours. Turn over
 Higher Tier. Time: 2 hours. Turn over") Excel / Education GCSE Mathematics Paper 5B (Calculator) Higher Tier Time: 2 hours 5B Materials required for examination Ruler graduated in centimetres and millimetres, protractor, compasses, pen, HB pencil,
Excel / Education GCSE Mathematics Paper 5B (Calculator) Higher Tier Time: 2 hours 5B Materials required for examination Ruler graduated in centimetres and millimetres, protractor, compasses, pen, HB pencil,
Name Date. Chapter 15 Final Review
 Name Date Chapter 15 Final Review Tell whether the events are independent or dependent. Explain. 9) You spin a spinner twice. First Spin: You spin a 2. Second Spin: You spin an odd number. 10) Your committee
Photo Scale The photo scale and representative fraction may be calculated as follows: PS = f / H Variables: PS - Photo Scale, f - camera focal
 Scale Scale is the ratio of a distance on an aerial photograph to that same distance on the ground in the real world. It can be expressed in unit equivalents like 1 inch = 1,000 feet (or 12,000 inches)
Landscaping Tutorial
 Landscaping Tutorial This tutorial describes how to use Home Designer Architectural s Terrain Tools. In it, you will learn how to add elevation information to your terrain, how to create terrain features,
Square Roots and the Pythagorean Theorem
 UNIT 1 Square Roots and the Pythagorean Theorem Just for Fun What Do You Notice? Follow the steps. An example is given. Example 1. Pick a 4-digit number with different digits. 3078 2. Find the greatest
GCSE 9-1 Higher Edexcel Set C Paper 2 - Calculator
 Name: GCSE 9-1 Higher Edexcel Set C Paper 2 - Calculator Equipment 1. A black ink ball-point pen. 2. A pencil. 3. An eraser. 4. A ruler. 5. A pair of compasses. 6. A protractor. 7. A calculator Guidance
Review. In an experiment, there is one variable that is of primary interest. There are several other factors, which may affect the measured result.
 Review Observational study vs experiment Experimental designs In an experiment, there is one variable that is of primary interest. There are several other factors, which may affect the measured result.
Physics 2310 Lab #5: Thin Lenses and Concave Mirrors Dr. Michael Pierce (Univ. of Wyoming)
") Physics 2310 Lab #5: Thin Lenses and Concave Mirrors Dr. Michael Pierce (Univ. of Wyoming) Purpose: The purpose of this lab is to introduce students to some of the properties of thin lenses and mirrors.
Physics 2310 Lab #5: Thin Lenses and Concave Mirrors Dr. Michael Pierce (Univ. of Wyoming) Purpose: The purpose of this lab is to introduce students to some of the properties of thin lenses and mirrors.
GCSE Mathematics Specification (8300/2F)
") NEW SPECIMEN PAPERS PUBLISHED JUNE 2015 GCSE Mathematics Specification (8300/2F) Paper 2 Foundation tier F Date Morning 1 hour 30 minutes Materials For this paper you must have: a calculator mathematical
NEW SPECIMEN PAPERS PUBLISHED JUNE 2015 GCSE Mathematics Specification (8300/2F) Paper 2 Foundation tier F Date Morning 1 hour 30 minutes Materials For this paper you must have: a calculator mathematical
Vowel A E I O U Probability
 Section A Concepts and Skills A computer is going to choose a letter at random from the text of an English novel. The table shows the probabilities of the computer choosing the various vowels. Vowel A
Wetland Amphibian Monitoring Protocol
 Wetland Amphibian Monitoring Protocol Terrestrial Long-term Fixed Plot Monitoring Program Regional Watershed Monitoring and Reporting November 2011 Report prepared by: Reviewed by: Paul Prior, Fauna Biologist
Statistics 101: Section L Laboratory 10
 Statistics 101: Section L Laboratory 10 This lab looks at the sampling distribution of the sample proportion pˆ and probabilities associated with sampling from a population with a categorical variable.
User Manual for Grass Snap (Android Version)
") User Manual for Grass Snap (Android Version) Grass Snap is a useful tool when monitoring your pastures and grasslands. Grass Snap will take you through the monitoring process step-by-step. Grass Snap meets
User Manual for Grass Snap (Android Version) Grass Snap is a useful tool when monitoring your pastures and grasslands. Grass Snap will take you through the monitoring process step-by-step. Grass Snap meets
Mathematics Test. Go on to next page
 Mathematics Test Time: 60 minutes for 60 questions Directions: Each question has five answer choices. Choose the best answer for each question, and then shade in the corresponding oval on your answer sheet.
Edexcel GCSE 5503/03. Mathematics A Paper 3 (Non-Calculator) Intermediate Tier Tuesday 11 November 2003 Morning Time: 2 hours
 Intermediate Tier Tuesday 11 November 2003 Morning Time: 2 hours") Paper Reference(s) 5503/03 Edexcel GCSE Mathematics A 1387 Paper 3 (Non-Calculator) Intermediate Tier Tuesday 11 November 2003 Morning Time: 2 hours Materials required for examination Ruler graduated in
Paper Reference(s) 5503/03 Edexcel GCSE Mathematics A 1387 Paper 3 (Non-Calculator) Intermediate Tier Tuesday 11 November 2003 Morning Time: 2 hours Materials required for examination Ruler graduated in
Linear Regression Exercise
 Linear Regression Exercise A document on using the Linear Regression Formula by Miguel David Margarita Hechanova Andrew Jason Lim Mark Stephen Ong Richard Ong Aileen Tan December 4, 2007 Table of Contents
BacklightFly Manual.
 BacklightFly Manual http://www.febees.com/ Contents Start... 3 Installation... 3 Registration... 7 BacklightFly 1-2-3... 9 Overview... 10 Layers... 14 Layer Container... 14 Layer... 16 Density and Design
KS specimen papers
 KS4 2016 specimen papers OCR H3 specimen 14 A straight line goes through the points (p, q) and (r, s), where p + 2 = r q + 4 = s. Find the gradient of the line. AQA F3 H3 specimen 21 When x² = 16 the only
Paper 2. Mathematics test. Calculator allowed. satspapers.org. First name. Last name. School KEY STAGE TIER
 Ma KEY STAGE 3 TIER 4 6 2005 Mathematics test Paper 2 Calculator allowed Please read this page, but do not open your booklet until your teacher tells you to start. Write your name and the name of your
Mapping The Study Area
 While on the beach you will need to take some measurements to show where the study area is relative to the rest of the world and to show what is inside the study area. Once the measurements have been taken,
Merloni Elettrodomestici. Technical Fitting Manual FRIDGE. Language Issue/Edition Page GB /
 GB 99-11-03/01 1-38 Index 1 CONFORMITY OF APPLIANCE 3 2 MAIN ASSEMBLY TYPES 3 2.1 Under worktop 3 2.2 Double door 10 2.3 Combined 14 2.4 Single door Fridge or single door Freezer 19 2.5 Combined free-standing
OALCF Task Cover Sheet. Goal Path: Employment Apprenticeship Secondary School Post Secondary Independence
 OALCF Task Cover Sheet Task Title: Math Measurement Test Learner Name: Date Started: Date Completed: Successful Completion: Yes No Goal Path: Employment Apprenticeship Secondary School Post Secondary Independence
Edexcel GCSE Mathematics
 Centre No. Paper Reference Surname Initial(s) Candidate No. Signature Paper Reference(s) Edexcel GCSE Mathematics Paper 2 (Calculator) Foundation Tier Specimen paper Time: 1 hour and 30 minutes Examiner
You must have: Ruler graduated in centimetres and millimetres, protractor, pair of compasses, pen, HB pencil, eraser. Tracing paper may be used.
 Write your name here Surname Other names Pearson Edexcel Level 1/Level 2 GCSE (9 1) Centre Number Mathematics Paper 1 (Non-Calculator) Thursday 24 May 2018 Morning Time: 1 hour 30 minutes Candidate Number
Landscaping Tutorial. Adding a Driveway Adding Library Objects to Your Plan
 Landscaping Tutorial This tutorial describes how to use Home Designer Pro s Terrain Tools. In it, you will learn how to add elevation information to your terrain, how to create terrain features, and how
Name Date. Chapter 15 Final Review
 Name Date Chapter 15 Final Review Tell whether the events are independent or dependent. Explain. 9) You spin a spinner twice. First Spin: You spin a 2. Second Spin: You spin an odd number. 10) Your committee
Guide to Developing a Stream Photograph Documentation Program
 Guide to Developing a Stream Photograph Documentation Program William Robertson: MSUEWQ & BSWC Introduction Landscape photographs can offer a qualitative and, in some situations, quantitative evaluation
Unit 1: Statistics and Probability (Calculator) Wednesday 9 November 2011 Afternoon Time: 1 hour 15 minutes
 Wednesday 9 November 2011 Afternoon Time: 1 hour 15 minutes") Write your name here Surname Other names Edexcel GCSE Centre Number Candidate Number Mathematics B Unit 1: Statistics and Probability (Calculator) Wednesday 9 November 2011 Afternoon Time: 1 hour 15 minutes
Write your name here Surname Other names Edexcel GCSE Centre Number Candidate Number Mathematics B Unit 1: Statistics and Probability (Calculator) Wednesday 9 November 2011 Afternoon Time: 1 hour 15 minutes
Excel / Education. GCSE Mathematics. Paper 3B (Calculator) Higher Tier. Time: 2 hours. Turn over
 Higher Tier. Time: 2 hours. Turn over") Excel / Education GCSE Mathematics Paper 3B (Calculator) Higher Tier Time: 2 hours 3B Materials required for examination Ruler graduated in centimetres and millimetres, protractor, compasses, pen, HB pencil,
Excel / Education GCSE Mathematics Paper 3B (Calculator) Higher Tier Time: 2 hours 3B Materials required for examination Ruler graduated in centimetres and millimetres, protractor, compasses, pen, HB pencil,
POPULAT A ION DYNAMICS
 POPULATION DYNAMICS POPULATIONS Population members of one species living and reproducing in the same region at the same time. Community a number of different populations living together in the one area.
Post & Rail Crossbuck
 Post & Rail Crossbuck 1. Getting Started 6. Crossbuck Be sure to call underground prior to digging Assemble gates (if necessary) and decide where they will be located Stake out the fence line Space and
Which equipment is necessary? How is the panorama created?
 Congratulations! By purchasing your Panorama-VR-System you have acquired a tool, which enables you - together with a digital or analog camera, a tripod and a personal computer - to generate high quality
Biggar High School Mathematics Department. S1 Block 1. Revision Booklet GOLD
 Biggar High School Mathematics Department S1 Block 1 Revision Booklet GOLD Contents MNU 3-01a MNU 3-03a MNU 3-03b Page Whole Number Calculations & Decimals 3 MTH 3-05b MTH 3-06a MTH 4-06a Multiples, Factors,
Math 247: Continuous Random Variables: The Uniform Distribution (Section 6.1) and The Normal Distribution (Section 6.2)
 and The Normal Distribution (Section 6.2)") Math 247: Continuous Random Variables: The Uniform Distribution (Section 6.1) and The Normal Distribution (Section 6.2) The Uniform Distribution Example: If you are asked to pick a number from 1 to 10
Math 247: Continuous Random Variables: The Uniform Distribution (Section 6.1) and The Normal Distribution (Section 6.2) The Uniform Distribution Example: If you are asked to pick a number from 1 to 10
COIN PACKAGING SPECIFICATIONS Number of coins in roll 0,01 0, , ,05 2, , , ,
 COIN PACKAGING SPECIFICATIONS ANNEX 1. ROLLS 1.1. Composition of rolls Coin face values in 1.. Technical specifications of the paper Roll value in 1.1.1. Number of coins in roll 0,01 0,0 0 0,0 1 0 0,0,0
Determining the Dynamic Characteristics of a Process
 Exercise 5-1 Determining the Dynamic Characteristics of a Process EXERCISE OBJECTIVE In this exercise, you will determine the dynamic characteristics of a process. DISCUSSION OUTLINE The Discussion of
Post & Rail. Includes: Crossbuck, 2-Rail, 3-Rail and 4-Rail POST SUPPORT OPTIONS
 Post & Rail Includes: Crossbuck, 2-Rail, 3-Rail and 4-Rail STAGGER RAIL ENDS FOR GREATER STRENGTH ALLOW 1-1/2" GAP ON HINGE SIDE OF GATE AND 1-1/4" ON LATCH SIDE OF GATE HARDWARE DIG HOLES 30" MINIMUM
I STATISTICAL TOOLS IN SIX SIGMA DMAIC PROCESS WITH MINITAB APPLICATIONS
 Six Sigma Quality Concepts & Cases- Volume I STATISTICAL TOOLS IN SIX SIGMA DMAIC PROCESS WITH MINITAB APPLICATIONS Chapter 7 Measurement System Analysis Gage Repeatability & Reproducibility (Gage R&R)
GPS NAVSTAR PR (XR5PR) N/A
 N/A") WinFrog Device Group: GPS Device Name/Model: Device Manufacturer: Device Data String(s) Output to WinFrog: WinFrog Data String(s) Output to Device: NAVSTAR PR (XR5PR) Symmetricom Navstar Systems Ltd. Mansard
WinFrog Device Group: GPS Device Name/Model: Device Manufacturer: Device Data String(s) Output to WinFrog: WinFrog Data String(s) Output to Device: NAVSTAR PR (XR5PR) Symmetricom Navstar Systems Ltd. Mansard
Number patterns on a spreadsheet
 A1 SS Number patterns on a spreadsheet This sheet will help you to create your own number patterns on a spreadsheet. Do the steps one at a time. You will soon feel more confident with a spreadsheet program.