Economic Inequality and Academic Achievement
|
|
|
- Jonathan Lewis
- 5 years ago
- Views:
Transcription
1 Economic Inequality and Academic Achievement Larry V. Hedges Northwestern University, USA Prepared for the 5 th IEA International Research Conference, Singapore, June 25, 2013
2 Background Social background has been known to be linked to test scores since Binet and Simon Sometimes the dependence of test scores on social background leads to relevant variance, sometimes it is irrelevant variance The relation of social background to individual s test scores has been a major research topic for half a century This relation has been called the most replicated result in social science It is a general result, internationally
3 Background In the US, especially, there have sometimes been innatist interpretations There has also been serious work to understand what the causal elements of social class might be (e.g. the Alison Davis tradition, linguistic restrictions) There has been serious work to understand how home environment factors correlated with social class could explain achievement differences (e.g., Benjamin Bloom) There has recently been a great deal of more nuanced work focusing on achievement as a function of family income (e.g., Sean Reardon) We also know that income is related to achievement both within and between countries
4 Background There has been a parallel set of work on the impact of economic inequality and its impact on economic growth The argument is that economic inequality in a society can actually hamper economic growth That is, countries with greater inequality experience slower economic growth than countries that are more economically egalitarian The same kinds of theoretical arguments are beginning to be made about education
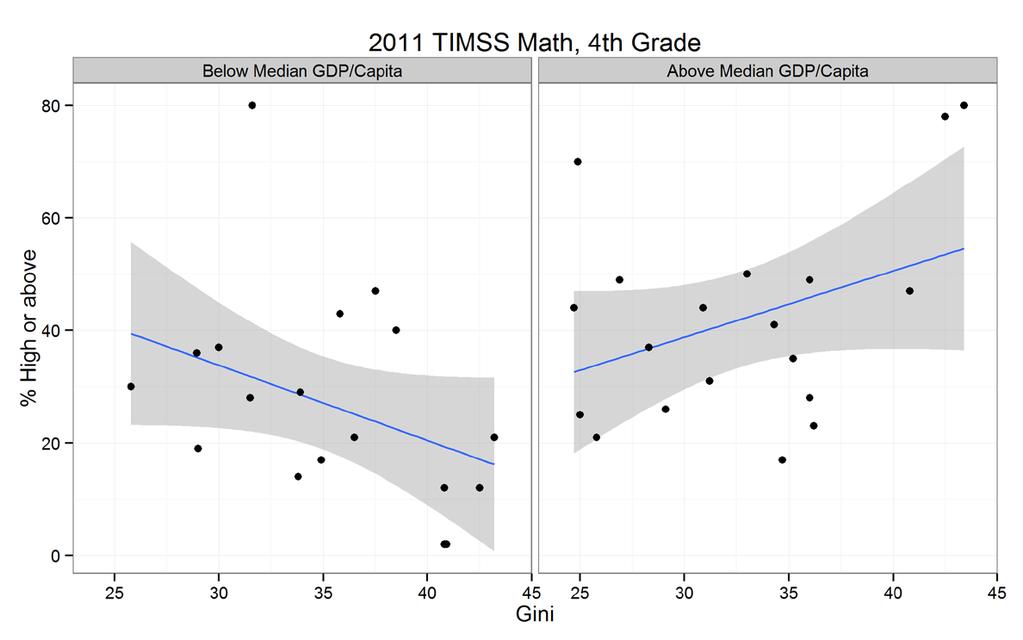
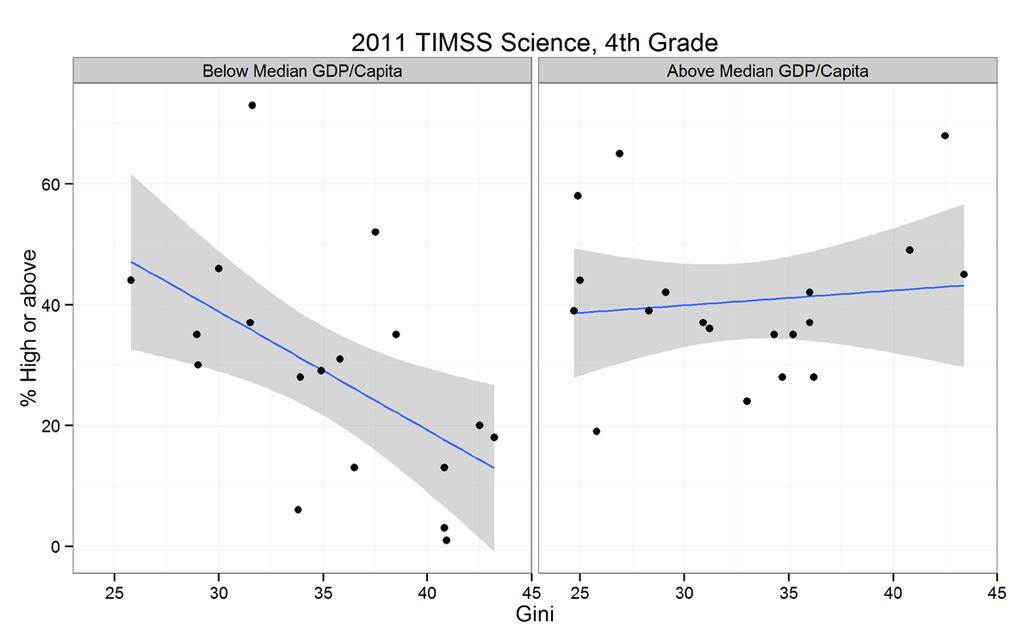
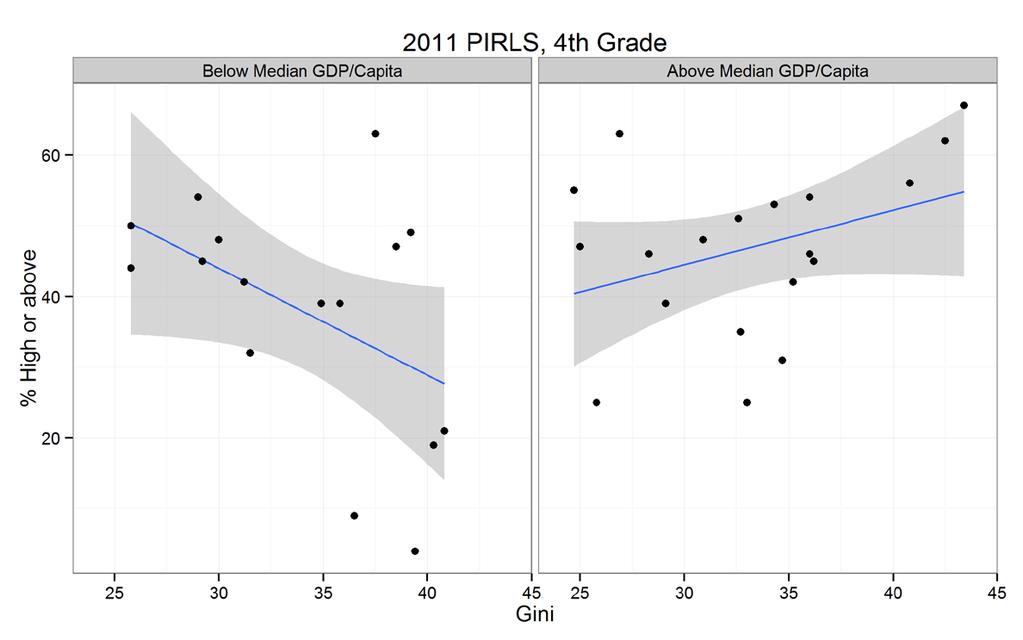
5 This Talk My topic is the relation of economic inequality and the academic achievement of nations I will draw on IEA data (TIMSS and PIRLS) and UN and World Bank data on economies I look at average achievement, the fraction of students with (internationally benchmarked) high achievement, and low achievement
6 How Do We Measure Economic Inequality? There are lots of ways to do this One way is the ratio of the income of the top 10% of the population to that of the bottom 10% of the population (the 90/10 ratio) The problem with this measure is that it focuses on two specific parts of the income distribution Another measure that takes the entire income distribution into account is the Gini coefficient
7 Plot the percent of total income against the income percentile, the Lorentz curve
8 Plot the percent of total income against the income percentile, the Lorentz curve
9 If everyone had the same share of income, the Lorentz curve would be a line at 45

10 If one person had all the income, the Lorentz curve would be a backwards L shape
11 The real situation is between these two extremes, so the Lorentz curve looks like this

12 The Gini coefficient is proportional to the area between the 45 line and the Lorentz curve

13 The bigger the Gini coefficient, the greater the economic inequality
14 The Gini coefficient is not a perfect measure of economic inequality It does not reflect: resources available to all (e.g., health care in some countries) regional differences in income and cost of living restrictions on availability of resources But any national measure of inequality must oversimplify to some extent Results that follow would be qualitatively equivalent with 90/10 ratio used in place of Gini coefficients
15
16
17
18
19
20
21
22
23
24 Overall, It Appears That There Is A slight negative relation between average achievement and inequality A negligible relation between inequality and proportion of high achieving students A weak positive relation between inequality and proportion of low achieving students Results are quite similar in 8 th grade Math and Science
25 How Does National Wealth Affect These Results? We might measure national wealth by GDP per capita Fit a regression model like Achievement = β 0 + β 1 Gini + β 2 GDP/C + β 3 Gini*GDP/C + ε The interaction is significant in every analysis (Deleting apparent outliers does not change results much) It is easiest to summarize the analyses by using a simple dichotomization of countries by GDP per capita
26 GDP per Capita is an Imperfect Measure of National Wealth GDP/Capita does not account for the distribution of wealth within countries
27
28
29
30
31
32
33
34
35
36
37
38
39
40
41
42
43
44
45 Conclusions The relation between inequality and achievement is very different in richer versus poorer countries In poorer countries Inequality is negatively related to average achievement Inequality is negatively related to proportion of high achieving students Inequality is positively related to proportion with low achieving students
46 Conclusions In richer countries Inequality is weakly related to average achievement Inequality is positively related to proportion of high achieving students Inequality is unrelated to proportion with low achieving students But
47 Important Limitation These are all associations We d like to know if they are causal A difference in differences analysis (differences in Gini versus difference in achievement) would be more persuasive There is too little variation to make these analysis credible (countries change slowly)
48 Thank You!
Convergence Forward and Backward? 1. Quentin Wodon and Shlomo Yitzhaki. World Bank and Hebrew University. March Abstract
 Convergence Forward and Backward? Quentin Wodon and Shlomo Yitzhaki World Bank and Hebrew University March 005 Abstract This note clarifies the relationship between -convergence and -convergence in a univariate
IES, Faculty of Social Sciences, Charles University in Prague
 IMPACT OF INTELLECTUAL PROPERTY RIGHTS AND GOVERNMENTAL POLICY ON INCOME INEQUALITY. Ing. Oksana Melikhova, Ph.D. 1, 1 IES, Faculty of Social Sciences, Charles University in Prague Faculty of Mathematics
A Note on Growth and Poverty Reduction
 N. KAKWANI... A Note on Growth and Poverty Reduction 1 The views expressed in this paper are those of the author and do not necessarily reflect the views or policies of the Asian Development Bank. The
The Relationship Between Annual GDP Growth and Income Inequality: Developed and Undeveloped Countries
 The Relationship Between Annual GDP Growth and Income Inequality: Developed and Undeveloped Countries Zeyao Luan, Ziyi Zhou Georgia Institute of Technology ECON 3161 Dr. Shatakshee Dhongde April 2017 1
IS THE DIGITAL DIVIDE REALLY CLOSING? A CRITIQUE OF INEQUALITY MEASUREMENT IN A NATION ONLINE
 IT&SOCIETY, VOLUME, ISSUE 4, SPRING 2003, PP. -3 A CRITIQUE OF INEQUALITY MEASUREMENT IN A NATION ONLINE STEVEN P. ABSTRACT According to the U.S. Department of Commerce Report A Nation Online: How Americans
Programme Curriculum for Master Programme in Economic History
 Programme Curriculum for Master Programme in Economic History 1. Identification Name of programme Scope of programme Level Programme code Master Programme in Economic History 60/120 ECTS Master level Decision
EC Chapter 1. Burak Alparslan Eroğlu. October 13, Burak Alparslan Eroğlu EC Chapter 1
 EC 101 - Chapter 1 Burak Alparslan Eroğlu October 13, 2016 Outline Introduction to New Course Module Introduction to Unit 1 Hockey Stick Growth Capitalism Inequality Economics and Economy Introduction
Montclair State University; Research Methods: Spring 2015 ON INEQUALITY: MEASUREMENT AND OTHER ISSUES
 Montclair State University; Research Methods: Spring 2015 ON INEQUALITY: MEASUREMENT AND OTHER ISSUES WHAT IS INEQUALITY? If there were in the world today any large number of people who desired their own
Female Height. Height (inches)
") Math 111 Normal distribution NAME: Consider the histogram detailing female height. The mean is 6 and the standard deviation is 2.. We will use it to introduce and practice the ideas of normal distributions.
Math 111 Normal distribution NAME: Consider the histogram detailing female height. The mean is 6 and the standard deviation is 2.. We will use it to introduce and practice the ideas of normal distributions.
Answer Sheets Cover Page
 page 1 of 17 Experimental Competition May 7, 2015 08:30-13:30 hours Answer Sheets Cover Page STUDENT CODE Additional number of writing sheets= Do not write below this line Part A Part B Part C Part D Part
How Many Imputations are Really Needed? Some Practical Clarifications of Multiple Imputation Theory
 Prev Sci (2007) 8:206 213 DOI 10.1007/s11121-007-0070-9 How Many Imputations are Really Needed? Some Practical Clarifications of Multiple Imputation Theory John W. Graham & Allison E. Olchowski & Tamika
The Pareto Distribution of World s GDP
 The Economies of the Balkan and the Eastern European Countries in the changing World Volume 2018 Conference Paper The Pareto Distribution of World s GDP Zoran Petar Tomić Faculty of Economics, University
The unfair consequences of equal opportunities: comparing exchange models of wealth distribution
 J. Phys. IV France (2006) Pr- c EDP Sciences, Les Ulis The unfair consequences of equal opportunities: comparing exchange models of wealth distribution G. M. Caon, S. Gonçalves and J. R. Iglesias Instituto
MULTIPLE CHOICE. Choose the one alternative that best completes the statement or answers the question.
 Practice for Final Exam Name Identify the following variable as either qualitative or quantitative and explain why. 1) The number of people on a jury A) Qualitative because it is not a measurement or a
Spring 2017 Math 54 Test #2 Name:
 Spring 2017 Math 54 Test #2 Name: You may use a TI calculator and formula sheets from the textbook. Show your work neatly and systematically for full credit. Total points: 101 1. (6) Suppose P(E) = 0.37
The Weakness of the Gini Coefficient in Farm States
 Whitepaper No. 16506 The Weakness of the Gini Coefficient in Farm States November 22, 2016 Morgan Campbell, Gail Werner-Robertson Fellow Faculty Mentors: Dr. Ernie Goss Executive Summary Over the past
Mining and income distribution in regional Australia
 Mining and income distribution in regional Australia Tom Measham and Andrew Reeson SEGRA Conference, 2011 Overview Background on mining and the national economy Consider impact of mining on other sectors
Progressivity, vertical and horizonal equity
 Progressivity, vertical and horizonal equity Abdelkrim Araar, Sami Bibi and Jean-Yves Duclos Workshop on poverty and social impact analysis in Sub-Saharan Africa Kampala, Uganda, 23-27 November 2009 Progressivity
Do Local and International Venture Capitalists Play Well Together? A Study of International Venture Capital Investments
 Do Local and International Venture Capitalists Play Well Together? A Study of International Venture Capital Investments Thomas J. Chemmanur* Tyler J. Hull** and Karthik Krishnan*** This Version: September
Exam 2 Review. Review. Cathy Poliak, Ph.D. (Department of Mathematics ReviewUniversity of Houston ) Exam 2 Review
 Exam 2 Review") Exam 2 Review Review Cathy Poliak, Ph.D. cathy@math.uh.edu Department of Mathematics University of Houston Exam 2 Review Exam 2 Review 1 / 20 Outline 1 Material Covered 2 What is on the exam 3 Examples
Exam 2 Review Review Cathy Poliak, Ph.D. cathy@math.uh.edu Department of Mathematics University of Houston Exam 2 Review Exam 2 Review 1 / 20 Outline 1 Material Covered 2 What is on the exam 3 Examples
DETERMINATES OF CLUSTERING ACROSS AMERICA S NATIONAL PARKS: AN APPLICATION OF THE GINI COEFFICIENT
 DETERMINATES OF CLUSTERING ACROSS AMERICA S NATIONAL PARKS: AN APPLICATION OF THE GINI COEFFICIENT R. Geoffrey Lacher Department of Parks, Recreation & Tourism Management Clemson University rlacher@clemson.edu
Modeling Companion B Measures of well being and inequality
 Modeling Companion B Measures of well being and inequality LEARNING OBJECTIVES What is the Human Development Index? What is affective/evaluative happiness and how do we measure them? Measuring inequality
Statistical and operational complexities of the studies I Sample design: Use of sampling and replicated weights
 Statistical and operational complexities of the studies I Sample design: Use of sampling and replicated weights Andrés Sandoval-Hernández IEA DPC Workshop on using PISA, PIAAC, TIMSS & PIRLS, TALIS datasets
Economics 448 Lecture 13 Functional Inequality
 Economics 448 Functional Inequality October 16, 2012 Introduction Last time discussed the measurement of inequality. Today we will look how inequality can influences how an economy works. Chapter 7 explores
Miguel I. Aguirre-Urreta
 RESEARCH NOTE REVISITING BIAS DUE TO CONSTRUCT MISSPECIFICATION: DIFFERENT RESULTS FROM CONSIDERING COEFFICIENTS IN STANDARDIZED FORM Miguel I. Aguirre-Urreta School of Accountancy and MIS, College of
Digital Economy and Gender Well-Being Measurement: Evidence from Indonesia. Eni Lestariningsih (BPS Statistics Indonesia - National Office)
") Digital Economy and Gender Well-Being Measurement: Evidence from Indonesia Eni Lestariningsih (BPS Statistics Indonesia - National Office) Sri Rachmad (BPS Statistics Indonesia - National Office) Atika
Digital Economy and Gender Well-Being Measurement: Evidence from Indonesia Eni Lestariningsih (BPS Statistics Indonesia - National Office) Sri Rachmad (BPS Statistics Indonesia - National Office) Atika
Web Appendix: Online Reputation Mechanisms and the Decreasing Value of Chain Affiliation
 Web Appendix: Online Reputation Mechanisms and the Decreasing Value of Chain Affiliation November 28, 2017. This appendix accompanies Online Reputation Mechanisms and the Decreasing Value of Chain Affiliation.
ESTIMATION OF GINI-INDEX FROM CONTINUOUS DISTRIBUTION BASED ON RANKED SET SAMPLING
 Electronic Journal of Applied Statistical Analysis EJASA, Electron. j. app. stat. anal. (008), ISSN 070-98, DOI 0.8/i07098vnp http://siba.unile.it/ese/ejasa http://faculty.yu.edu.jo/alnasser/ejasa.htm
Cross-country Analysis of ICT and Education Indicators: An Exploratory Study
 IOP Conference Series: Materials Science and Engineering PAPER OPEN ACCESS Crosscountry Analysis of ICT and Education Indicators: An Exploratory Study Recent citations Ahmad R. Pratama To cite this article:
How to use Bibliometric Data to Rank Universities according to their Research Performance?
 How to use Bibliometric Data to Rank Universities according to their Research Performance? Rüdiger Mutz, ETH Zurich COST Conference, Zurich, 12.2.-13.2.2015 Professorship for Social Psychology and Research
INTELLECTUAL PROPERTY AND ECONOMIC GROWTH
 International Journal of Economics, Commerce and Management United Kingdom Vol. IV, Issue 2, February 2016 http://ijecm.co.uk/ ISSN 2348 0386 INTELLECTUAL PROPERTY AND ECONOMIC GROWTH A REVIEW OF EMPIRICAL
HOW DOES INCOME DISTRIBUTION AFFECT ECONOMIC GROWTH? EVIDENCE FROM JAPANESE PREFECTURAL DATA
 Discussion Paper No. 910 HOW DOES INCOME DISTRIBUTION AFFECT ECONOMIC GROWTH? EVIDENCE FROM JAPANESE PREFECTURAL DATA Masako Oyama July 2014 The Institute of Social and Economic Research Osaka University
Math Released Item Grade 7. Sum of Perimeters VF801806
 Math Released Item 2017 Grade 7 Sum of Perimeters VF801806 Anchor Set A1 A8 With Annotations Prompt VF801806 Rubric Part A (This part is machine scored) Score Description 1 Student response includes the
Math 10 Homework 2 ANSWER KEY. Name: Lecturer: Instructions
 Math 10 Homework 2 ANSWER KEY Name: Lecturer: Instructions Type your answers and paste images directly into this document. Answers are usually short, with 1-3 sentences. Print out and hand in homework
Project summary. Key findings, Winter: Key findings, Spring:
 Summary report: Assessing Rusty Blackbird habitat suitability on wintering grounds and during spring migration using a large citizen-science dataset Brian S. Evans Smithsonian Migratory Bird Center October
Lab. 1: Simple Linear Circuit Analysis
 Lab. 1: Simple Linear Circuit Analysis Philippe Piot (February 9th, 27) 1. Ohm's Law The circuit shown in Figure 1 was built with resistance R=1 and then 1 kω. For these two values of the resistance, the
2.2 More on Normal Distributions and Standard Normal Calculations
 The distribution of heights of adult American men is approximately normal with mean 69 inches and standard deviation 2.5 inches. Use the 68-95-99.7 rule to answer the following questions: What percent
ONLINE APPENDIX: SUPPLEMENTARY ANALYSES AND ADDITIONAL ESTIMATES FOR. by Martha J. Bailey, Olga Malkova, and Zoë M. McLaren.
 ONLINE APPENDIX: SUPPLEMENTARY ANALYSES AND ADDITIONAL ESTIMATES FOR DOES ACCESS TO FAMILY PLANNING INCREASE CHILDREN S OPPORTUNITIES? EVIDENCE FROM THE WAR ON POVERTY AND THE EARLY YEARS OF TITLE X by
Math Spring Operational Grade 5 PBA Item #11 Time on Chores M02372
 Math Spring Operational 2015 Grade 5 PBA Item #11 Time on Chores M02372 Prompt Rubric Task is worth a total of 3 points. M02372 Rubric Score Description 3 Student response includes each of the following
Reminders. Quiz today. Please bring a calculator to the quiz
 Reminders Quiz today Please bring a calculator to the quiz 1 Regression Review (sort of Ch. 15) Warning: Outside of known textbook space Aaron Zimmerman STAT 220 - Summer 2014 Department of Statistics
2008 Excellence in Mathematics Contest Team Project A. School Name: Group Members:
 2008 Excellence in Mathematics Contest Team Project A School Name: Group Members: Reference Sheet Frequency is the ratio of the absolute frequency to the total number of data points in a frequency distribution.
Joyce Meng November 23, 2008
 Joyce Meng November 23, 2008 What is the distinction between positive and normative measures of income inequality? Refer to the properties of one positive and one normative measure. Can the Gini coefficient
TJHSST Senior Research Project Exploring Artificial Societies Through Sugarscape
 TJHSST Senior Research Project Exploring Artificial Societies Through Sugarscape 2007-2008 Jordan Albright January 22, 2008 Abstract Agent based modeling is a method used to understand complicated systems
Table 1. List of NFL divisions that have won the Superbowl over the past 52 years.
 MA 2113 Homework #1 Table 1. List of NFL divisions that have won the Superbowl over the past 52 years. NFC North AFC West NFC East NFC North AFC South NFC North NFC East NFC East AFC West NFC East AFC
Math Released Item Grade 5. Fractions of Paint Cans Using Number Line M500200
 Math Released Item 2018 Grade 5 Fractions of Paint Cans Using Number Line M500200 Anchor Set A1 A6 With Annotations Prompt M500200 Rubric Part A Score Description 1 This part of the item is machine-scored.
CHAPTER 6 PROBABILITY. Chapter 5 introduced the concepts of z scores and the normal curve. This chapter takes
 CHAPTER 6 PROBABILITY Chapter 5 introduced the concepts of z scores and the normal curve. This chapter takes these two concepts a step further and explains their relationship with another statistical concept
Measuring Income Inequality in Farm States: Weaknesses of the Gini Coefficient
 Whitepaper No. 16006 Measuring Income Inequality in Farm States: Weaknesses of the Gini Coefficient April 28, 2016 Madelyn McGlynn, Gail Werner-Robertson Fellow Faculty Mentor: Dr. Ernie Goss EXECUTIVE
KUZNETS INVERTED U-CURVE HYPOTHESIS EXAMINED ON UP-TO DATE OBSERVATIONS FOR 145 COUNTRIES
 KUZNETS INVERTED U-CURVE HYPOTHESIS EXAMINED ON UP-TO DATE OBSERVATIONS FOR 145 COUNTRIES Oksana Melikhova, Jakub Čížek* Abstract: The Kuznets hypothesis of inverted U-curve dependence of the income inequality
FM AND BESSEL ZEROS TUTORIAL QUESTIONS using the WAVE ANALYSER without a WAVE ANALYSER...137
 FM AND BESSEL ZEROS PREPARATION... 132 introduction... 132 EXPERIMENT... 133 spectral components... 134 locate the carrier... 134 the method of Bessel zeros... 136 looking for a Bessel zero... 136 using
Math 247: Continuous Random Variables: The Uniform Distribution (Section 6.1) and The Normal Distribution (Section 6.2)
 and The Normal Distribution (Section 6.2)") Math 247: Continuous Random Variables: The Uniform Distribution (Section 6.1) and The Normal Distribution (Section 6.2) The Uniform Distribution Example: If you are asked to pick a number from 1 to 10
Math 247: Continuous Random Variables: The Uniform Distribution (Section 6.1) and The Normal Distribution (Section 6.2) The Uniform Distribution Example: If you are asked to pick a number from 1 to 10
(Notice that the mean doesn t have to be a whole number and isn t normally part of the original set of data.)
") One-Variable Statistics Descriptive statistics that analyze one characteristic of one sample Where s the middle? How spread out is it? Where do different pieces of data compare? To find 1-variable statistics
One-Variable Statistics Descriptive statistics that analyze one characteristic of one sample Where s the middle? How spread out is it? Where do different pieces of data compare? To find 1-variable statistics
2011, Stat-Ease, Inc.
 Practical Aspects of Algorithmic Design of Physical Experiments from an Engineer s perspective Pat Whitcomb Stat-Ease Ease, Inc. 612.746.2036 fax 612.746.2056 pat@statease.com www.statease.com Statistics
Chaloemphon Meechai 1 1
 A Study of Factors Affecting to Public mind of The Eastern University of Management and Technology in Faculty Business Administration students Chaloemphon Meechai 1 1 Office of Business Administration,
Measuring Income Inequality in Farm States: Weaknesses of The Gini Coefficient
 Whitepaper No. 16006 Measuring Income Inequality in Farm States: Weaknesses of The Gini Coefficient April 28, 2016 Madelyn McGlynn, Gail Werner-Robertson Fellow Faculty Mentor: Dr. Ernest Goss Executive
List of Blackline Masters (BLMs) Grade 7 Mathematics Blackline Masters Grades 5 to 8 Mathematics Blackline Masters. Introduction 1
 Grade 7 Mathematics Blackline Masters Grades 5 to 8 Mathematics Blackline Masters. Introduction 1") C o n t e n t s List of Blackline Masters (BLMs) Grade 7 Mathematics Blackline Masters Grades 5 to 8 Mathematics Blackline Masters v v viii Acknowledgements ix Introduction 1 Overview 2 Conceptual Framework
C o n t e n t s List of Blackline Masters (BLMs) Grade 7 Mathematics Blackline Masters Grades 5 to 8 Mathematics Blackline Masters v v viii Acknowledgements ix Introduction 1 Overview 2 Conceptual Framework
Math 65A Elementary Algebra A Exam II STUDY GUIDE and REVIEW Chapter 2, Sections 3 5, and Chapter 3, Sections 1-3
 Exam II STUDY GUIDE and REVIEW Chapter 2, Sections 5, and Chapter, Sections 1 - Exam II will be given on Thursday, April 10. You will have the entire class time for the exam. It will cover Chapter 2, Sections
2. How many different three-member teams can be formed from six students?
 KCATM 2011 Probability & Statistics 1. A fair coin is thrown in the air four times. If the coin lands with the head up on the first three tosses, what is the probability that the coin will land with the
NBER WORKING PAPER SERIES URBAN INEQUALITY. Edward L. Glaeser Matthew G. Resseger Kristina Tobio
 NBER WORKING PAPER SERIES URBAN INEQUALITY Edward L. Glaeser Matthew G. Resseger Kristina Tobio Working Paper 14419 http://www.nber.org/papers/w14419 NATIONAL BUREAU OF ECONOMIC RESEARCH 1050 Massachusetts
7 Mathematics Curriculum
 New York State Common Core 7 Mathematics Curriculum GRADE Table of Contents 1 Percent and Proportional Relationships GRADE 7 MODULE 4... 3 Topic A: Finding the Whole (7.RP.A.1, 7.RP.A.2c, 7.RP.A.3)...
HPS Scope Sequence Last Revised June SUBJECT: Math GRADE: 7. Michigan Standard (GLCE) Code & Language. What this Standard means:
 Code & Language. What this Standard means:") Number and Numeration MA.7.NS.1 (Apply and extend previous understandings of addition and subtraction to add and subtract rational numbers; represent addition and subtraction on a horizontal or vertical
Number and Numeration MA.7.NS.1 (Apply and extend previous understandings of addition and subtraction to add and subtract rational numbers; represent addition and subtraction on a horizontal or vertical
December 12, FGCU Invitational Mathematics Competition Statistics Team
 1 Directions You will have 4 minutes to answer each question. The scoring will be 16 points for a correct response in the 1 st minute, 12 points for a correct response in the 2 nd minute, 8 points for
Department of Economics and Policy Research Institute University of Kansas and National Bureau of Economic Research W P S T A E
 THE UNIVERSITY OF KANSAS WORKING PAPERS SERIES IN THEORETICAL AND APPLIED ECONOMICS WHY INNOVATIVE ACTIVITY VARIES? THE ROLE OF HIGHER EDUCATION IN LOCAL INNOVATIVE ACTIVITY Joshua L. Rosenbloom Department
Online Appendix. Intergenerational Mobility and the Informational Content of Surnames. José V. Rodríguez Mora. University of Edinburgh and CEPR
 Online Appendix Intergenerational Mobility and the Informational Content of Surnames Maia Güell University of Edinburgh, CEP (LSE), CEPR & IZA José V. Rodríguez Mora University of Edinburgh and CEPR November
General Education Rubrics
 General Education Rubrics Rubrics represent guides for course designers/instructors, students, and evaluators. Course designers and instructors can use the rubrics as a basis for creating activities for
Source:
 According to Wikipedia, Occupy Wall Street was a protest movement that began in September of 2011 in New York City s Wall Street financial district. The movement was intended to raise awareness of social
Describing Data Visually. Describing Data Visually. Describing Data Visually 9/28/12. Applied Statistics in Business & Economics, 4 th edition
 A PowerPoint Presentation Package to Accompany Applied Statistics in Business & Economics, 4 th edition David P. Doane and Lori E. Seward Prepared by Lloyd R. Jaisingh Describing Data Visually Chapter
ELEMENTARY EDUCATION SUBTEST II
 ELEMENTARY EDUCATION SUBTEST II Content Domain Range of Competencies l. Mathematics 0001 0004 50% ll. Science 0005 0007 38% lll. The Arts, Health, and Fitness 0008 12% Approximate Percentage of Test Score
Wang-Iverson & Timpone. secondary school. 7th ICMI-East Asia Regional Conference on Mathematics Education May 2015, Cebu City, Philippines
 117 Examining TIMSS items through the lens of Origami Patsy Wang-Iverson, The Gabriella & Paul Rosenbaum Foundation, U.S.A. Nick Timpone, Primavera PD, U.S.A. Introduction With his invention of kindergarten
c. If you roll the die six times what are your chances of getting at least one d. roll.
 1. Find the area under the normal curve: a. To the right of 1.25 (100-78.87)/2=10.565 b. To the left of -0.40 (100-31.08)/2=34.46 c. To the left of 0.80 (100-57.63)/2=21.185 d. Between 0.40 and 1.30 for
Constructing the index system of Innovation-oriented country in China
 Department of Economics and Society Supervisor : Kenneth Natanaelsson Dalarna University 6 th of February 2007 Constructing the index system of Innovation-oriented country in China C-level essay in Statistics
Inequality as difference: A teaching note on the Gini coefficient
 Inequality as difference: A teaching note on the Gini coefficient Samuel Bowles Wendy Carlin SFI WORKING PAPER: 07-0-003 SFI Working Papers contain accounts of scienti5ic work of the author(s) and do not
CHAPTER 13A. Normal Distributions
 CHAPTER 13A Normal Distributions SO FAR We always want to plot our data. We make a graph, usually a histogram or a stemplot. We want to look for an overall pattern (shape, center, spread) and for any striking
Data Visualization in Capital in the 21st Century. Noah Wright. The University of Texas Inequality Project. Lyndon B. Johnson School of Public Affairs
 Data Visualization in Capital in the 21st Century Noah Wright The University of Texas Inequality Project Lyndon B. Johnson School of Public Affairs The University of Texas at Austin May 19, 2015 UTIP Working
TenMarks Curriculum Alignment Guide: EngageNY/Eureka Math, Grade 7
 EngageNY Module 1: Ratios and Proportional Relationships Topic A: Proportional Relationships Lesson 1 Lesson 2 Lesson 3 Understand equivalent ratios, rate, and unit rate related to a Understand proportional
Snapshot of Inequality in Nigeria (2004, 2013, 2016)
") Snapshot of Inequality in Nigeria (2004, 2013, 2016) Report Date: January 2018 Contents Executive Summary 1 The Gini, the Theil, and Decile Distribution 2 Consumption shares 3 Methodology 4 Appendix 5
Snapshot of Inequality in Nigeria (2004, 2013, 2016) Report Date: January 2018 Contents Executive Summary 1 The Gini, the Theil, and Decile Distribution 2 Consumption shares 3 Methodology 4 Appendix 5
Chess and Intelligence: Lessons for Scholastic Chess
 Chess and Intelligence: Lessons for Scholastic Chess Fernand Gobet Giovanni Sala Department of Psychological Sciences Overview Relation between chess and intelligence Are chess players smarter than non-players?
Analysis of Economic Data
 Analysis of Economic Data CHUNG-MING KUAN Department of Finance & CRETA National Taiwan University September 14, 2014 C.-M. Kuan (Finance & CRETA, NTU) Analysis of Economic Data September 14, 2014 1 /
The Geography of Innovation Commercialization in the United States During the 1990s
 Iowa State University From the SelectedWorks of Joshua L. Rosenbloom February, 2007 The Geography of Innovation Commercialization in the United States During the 1990s Joshua L. Rosenbloom, University
This PDF is a selection from a published volume from the National Bureau of Economic Research
 This PDF is a selection from a published volume from the National Bureau of Economic Research Volume Title: The Changing Frontier: Rethinking Science and Innovation Policy Volume Author/Editor: Adam B.
I Economic Growth 5. Second Edition. Robert J. Barro Xavier Sala-i-Martin. The MIT Press Cambridge, Massachusetts London, England
 I Economic Growth 5 Second Edition 1 Robert J. Barro Xavier Sala-i-Martin The MIT Press Cambridge, Massachusetts London, England Preface About the Authors xv xvii Introduction 1 1.1 The Importance of Growth
Understanding Knowledge Societies Report of UNDESA/DPADM. Measurement Aspects. Irene Tinagli Tunis, 17 Nov World Summit on Information Society
 Understanding Knowledge Societies Report of UNDESA/DPADM Measurement Aspects by Irene Tinagli Tunis, 17 Nov. 2005 World Summit on Information Society About Measurement WHY? To assess & better understand
Graph Formation Effects on Social Welfare and Inequality in a Networked Resource Game
 Graph Formation Effects on Social Welfare and Inequality in a Networked Resource Game Zhuoshu Li 1, Yu-Han Chang 2, and Rajiv Maheswaran 2 1 Beihang University, Beijing, China 2 Information Sciences Institute,
GROWTH AND CONSUMPTION INEQUALITY IN PAKISTAN
 69 Pakistan Economic and Social Review Volume 49, No. (Summer 20), pp. 69-89 GROWTH AND CONSUMPTION INEQUALITY IN PAKISTAN MUHAMMAD ALI ASAD and MEHBOOB AHMAD* Abstract. In this study an attempt is made
DOES INFORMATION AND COMMUNICATION TECHNOLOGY DEVELOPMENT CONTRIBUTES TO ECONOMIC GROWTH?
 DOES INFORATION AND COUNICATION TECHNOLOGY DEVELOPENT CONTRIBUTES TO ECONOIC GROWTH? 1 ARYA FARHADI, 2 RAHAH ISAIL 1 Islamic Azad University, obarakeh Branch, Department of Accounting, Isfahan, Iran 2
Parametric Bootstrap Analysis of Gini Index in Gamma Distribution
 EUROPEAN ACADEMIC RESEARCH Vol. VI, Issue 12/ March 2019 ISSN 2286-4822 www.euacademic.org Impact Factor: 3.4546 (UIF) DRJI Value: 5.9 (B+) Parametric Bootstrap Analysis of Gini Index in Gamma Distribution
Quantitative Reasoning: It s Not Just for Scientists & Economists Anymore
 Quantitative Reasoning: It s Not Just for Scientists & Economists Anymore Corri Taylor Quantitative Reasoning Program Wellesley College ctaylor1@wellesley.edu In today s world awash in numbers, strong
ore C ommon Core Edition APlgebra Algebra 1 ESTS RACTICE PRACTICE TESTS Topical Review Book Company Topical Review Book Company
 C ommon Core ommon Edition C ore Edition Algebra 1 APlgebra 1 T RACTICE ESTS Answer Keys PRACTICE TESTS Topical Review Book Company Topical Review Book Company TEST 1 Part I 1. 3 5. 2 9. 4 13. 1 17. 4
Pro-poor Growth. Peter Warr* Poverty is not natural. It is man-made. And it can be eradicated by human action. Nelson Mandela, July
 Blackwell Oxford, APEL Asian-Pacific 0818-9935 November 19 2ORIGINAL WARR ASIAN-PACIFIC 2005 UKPublishing, PRO-POOR 2005 Pacific ARTICLE Economic ECONOMIC School Ltd. GROWTH Literature of Economics LITERATURE
Section 1.5 Graphs and Describing Distributions
 Section 1.5 Graphs and Describing Distributions Data can be displayed using graphs. Some of the most common graphs used in statistics are: Bar graph Pie Chart Dot plot Histogram Stem and leaf plot Box
Core Learning Standards for Mathematics Grade 6
 Core Learning Standards for Mathematics Grade 6 Write and evaluate numerical expressions involving whole-number exponents. Write, read, and evaluate expressions; identify parts of an expression using mathematical
Industry Concentration: The Case of Real Estate Investment Trusts
 Industry Concentration: The Case of Real Estate Investment Trusts by Vinod Chandrashekaran Manager, Equity Risk Model Research BARRA Inc. 2100 Milvia Street Berkeley, California 94704 phone: 510-649-4689
THE INNOVATION PERFORMANCE OF THE NORWEGIAN OFFSHORE INDUSTRY
 THE INNOVATION PERFORMANCE OF THE NORWEGIAN OFFSHORE INDUSTRY A REPORT FOR THE NORWEGIAN OIL AND GAS ASSOCIATION Yuriy Zhovtobryukh Marius Nordkvelde Torger Reve Forskningsrapport 4/2014 Handelshøyskolen
Welcome to Norwalk High School!
 Welcome to Norwalk High School! You are about to embark on the next journey in your educational career. We are looking forward to a year-long adventure with you in Algebra. There are a team of teachers
Keywords: Poverty reduction, income distribution, Gini coefficient, T21 Model
 A Model for Evaluating the Policy Impact on Poverty Weishuang Qu and Gerald O. Barney Millennium Institute 1117 North 19 th Street, Suite 900 Arlington, VA 22209, USA Phone/Fax: 703-841-0048/703-841-0050
Household Inequality, Corporate Capital Structure and Entrepreneurial Dynamism
 1 Household Inequality, Corporate Capital Structure and Entrepreneurial Dynamism Fabio Braggion Tilburg University Mintra Dwarkasing Tilburg University Steven Ongena University of Zürich, SFI and CEPR
AGS Math Algebra 2 Correlated to Kentucky Academic Expectations for Mathematics Grades 6 High School
 AGS Math Algebra 2 Correlated to Kentucky Academic Expectations for Mathematics Grades 6 High School Copyright 2008 Pearson Education, Inc. or its affiliate(s). All rights reserved AGS Math Algebra 2 Grade
NUMBERS & OPERATIONS. 1. Understand numbers, ways of representing numbers, relationships among numbers and number systems.
 7 th GRADE GLE S NUMBERS & OPERATIONS 1. Understand numbers, ways of representing numbers, relationships among numbers and number systems. A) Read, write and compare numbers (MA 5 1.10) DOK 1 * compare
Teddington School Sixth Form
 Teddington School Sixth Form AS / A level Sociology Induction and Key Course Materials AS and A level Sociology Exam Board AQA This GCE Sociology specification has been designed so that candidates will
Science and Technology Takeoff in Historical Perspective
 Science and Technology Takeoff in Historical Perspective Gao Jian Tsinghua University Gary H. Jefferson Brandeis University January 3, 2005 Draft: for review and comment only 1. Introduction Economists
Tables and Figures. Germination rates were significantly higher after 24 h in running water than in controls (Fig. 4).
.") Tables and Figures Text: contrary to what you may have heard, not all analyses or results warrant a Table or Figure. Some simple results are best stated in a single sentence, with data summarized parenthetically:
Tables and Figures Text: contrary to what you may have heard, not all analyses or results warrant a Table or Figure. Some simple results are best stated in a single sentence, with data summarized parenthetically: